Milwaukee, WI Investment Properties for Sale
Browse homes for sale and investment properties in Milwaukee, WI. Refine your search by price, property type, or more.
Best cash flowing properties in Milwaukee, WI
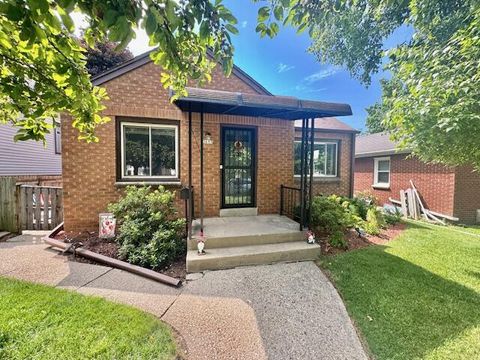
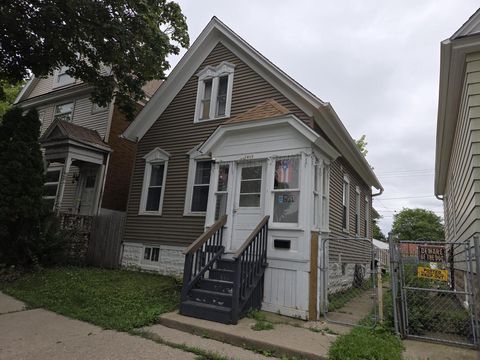
Active
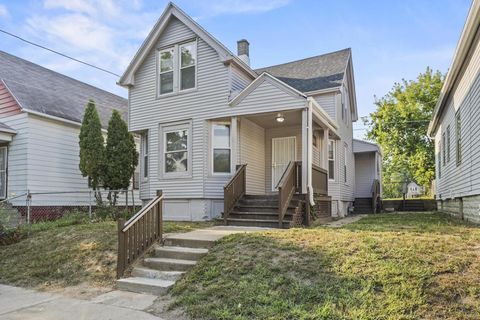
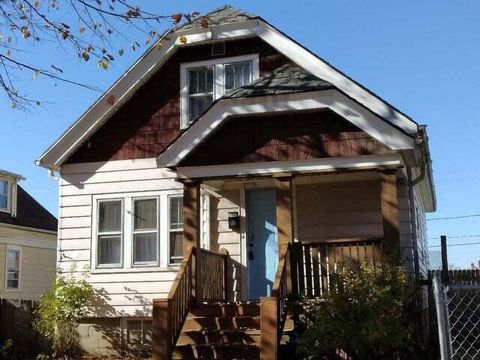
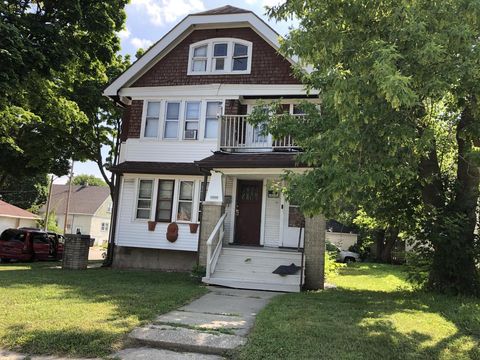
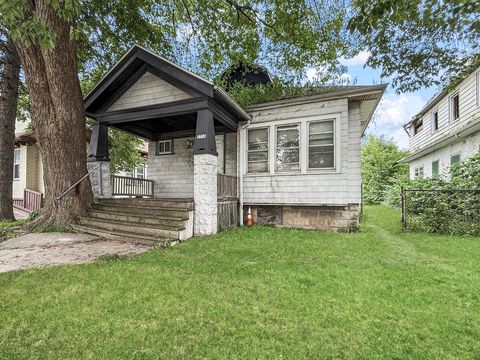
$72,500
4
bds
|
1
ba
|
1,535
sqft
|
built
1894
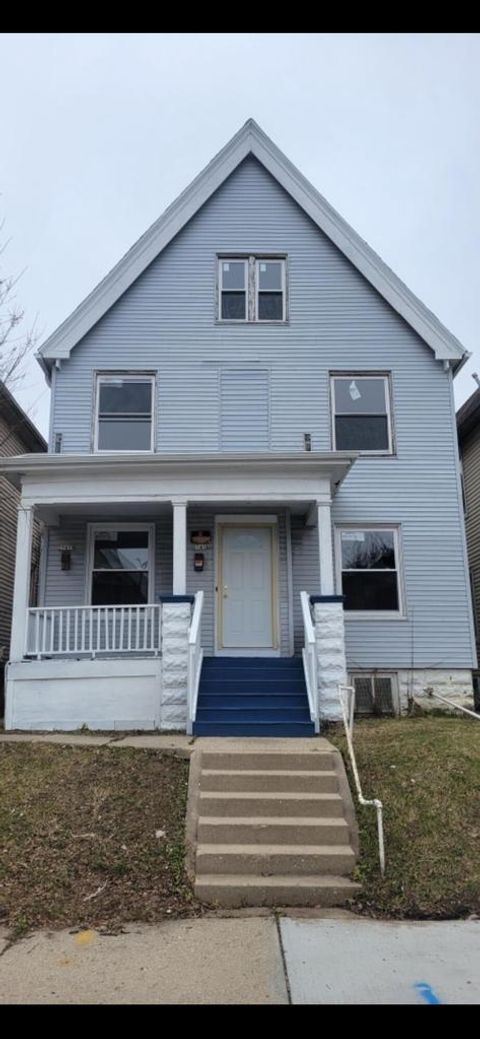
1540 W Groeling Ave, Milwaukee, WI 53206
$918
Cash flow
14.8%
Cash-on-Cash Return
15.2%
Cap rate
1.9%
Rent to Value Ratio
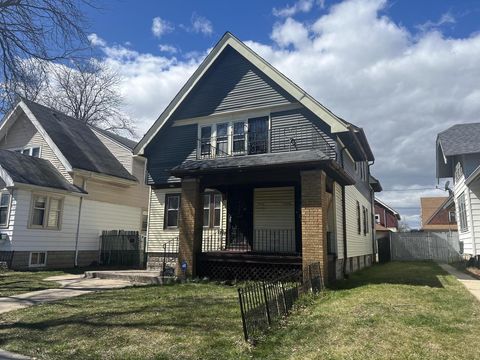
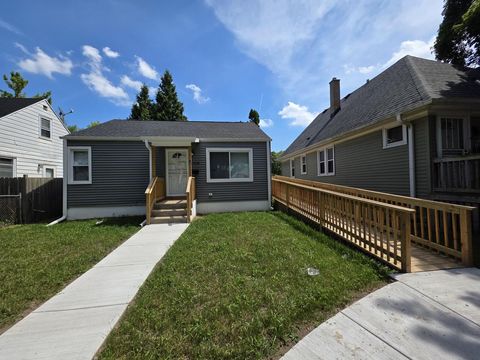
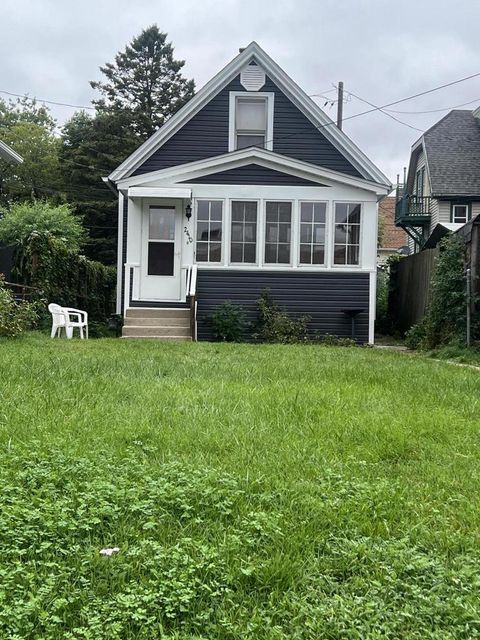
Active
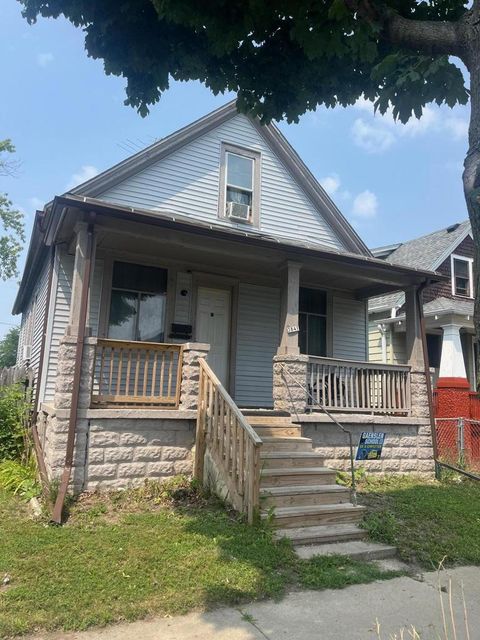
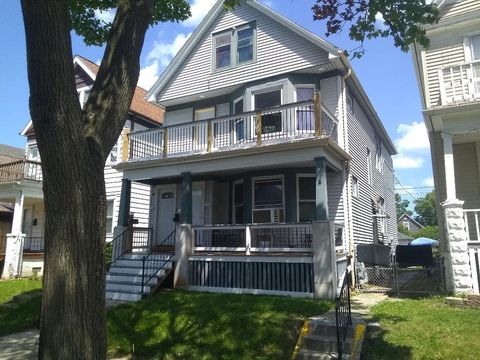
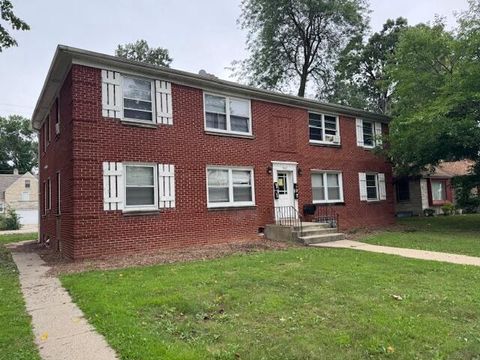
$49,900
2
bds
|
1
ba
|
792
sqft
|
built
1900
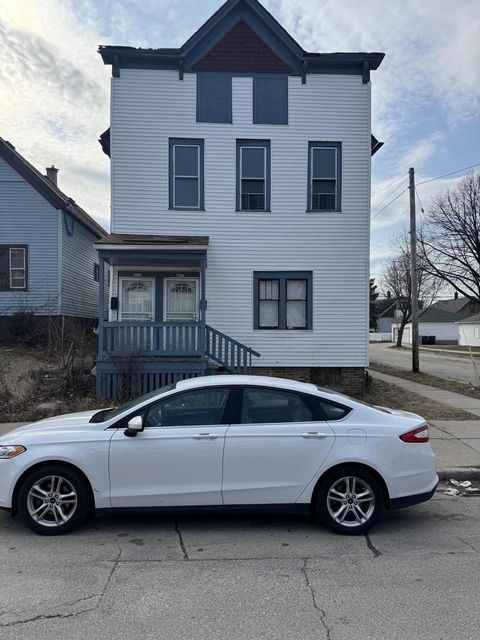
3841 N 19th Pl, Milwaukee, WI 53206
$687
Cash flow
16.0%
Cash-on-Cash Return
16.5%
Cap rate
2.2%
Rent to Value Ratio
443 out of 562 properties for sale in Milwaukee, WI
Limited Results Shown
Create a free account, or log in to reveal all property listings and enjoy the complete experience.
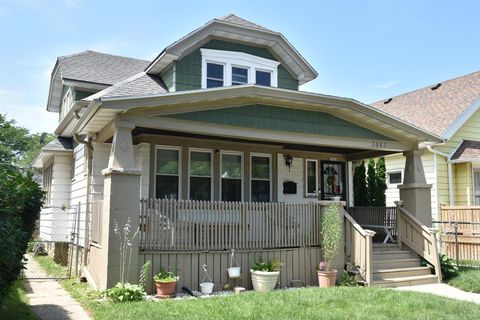
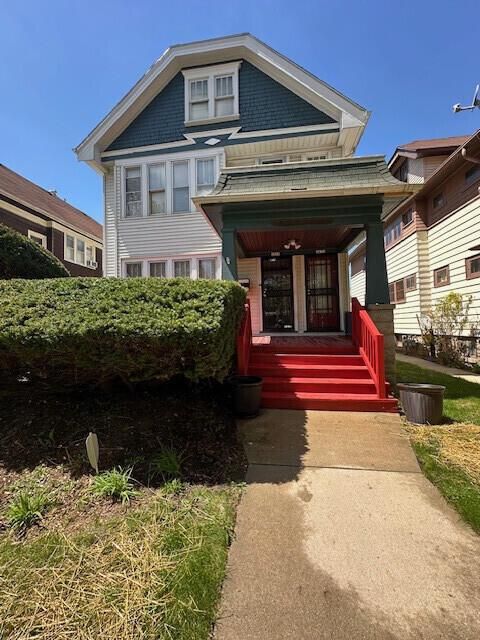
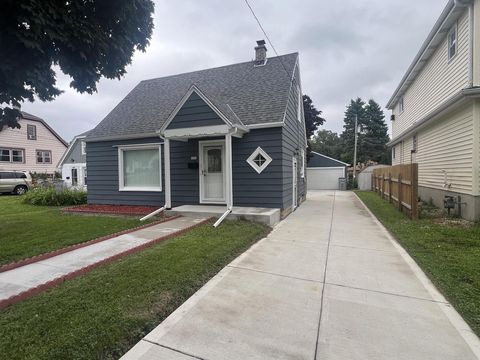
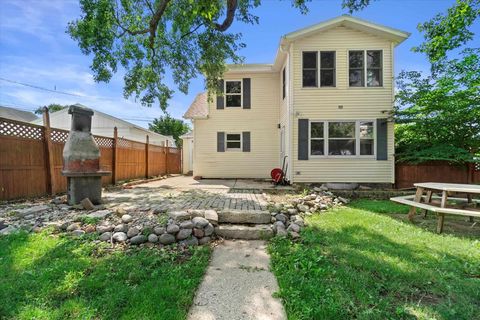
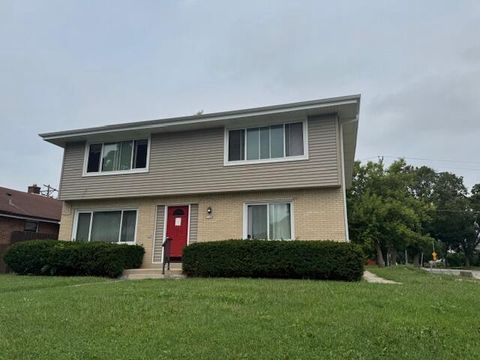
Active
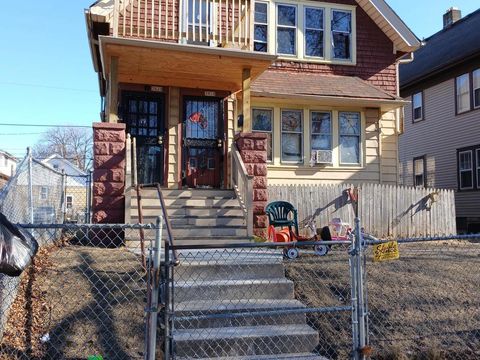
$130,000
2
bds
|
1
ba
|
1,110
sqft
|
built
1925
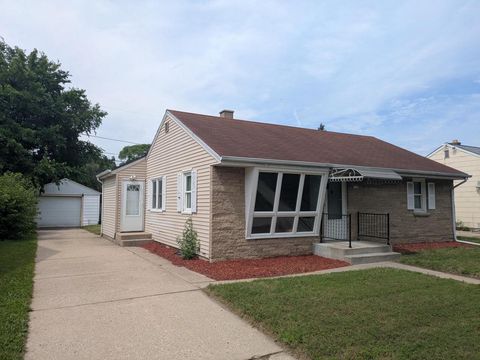
3843 N 25th St, Milwaukee, WI 53206
$108
Cash flow
4.3%
Cash-on-Cash Return
7.1%
Cap rate
1.0%
Rent to Value Ratio
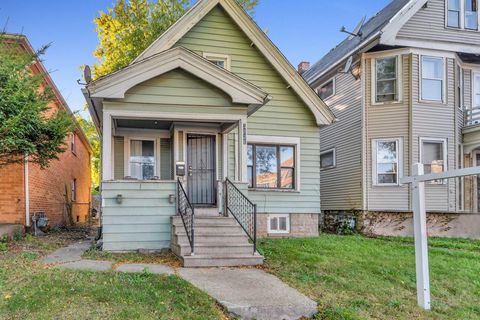
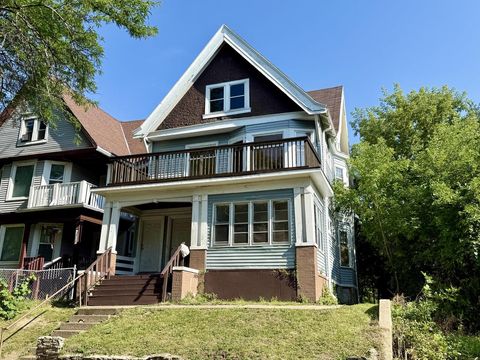
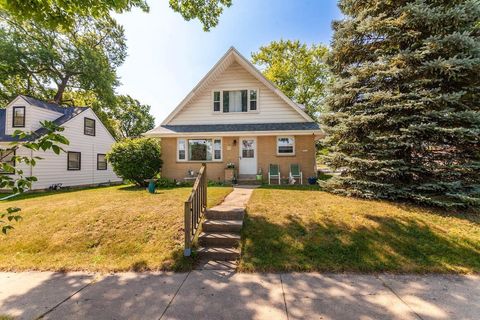
Active
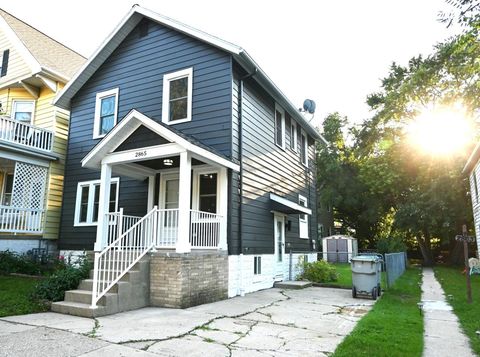
$85,000
3
bds
|
0
ba
|
1,174
sqft
|
built
1915
3221 N 38th St, Milwaukee, WI 53216
$250
Cash flow
15.3%
Cash-on-Cash Return
9.7%
Cap rate
1.4%
Rent to Value Ratio
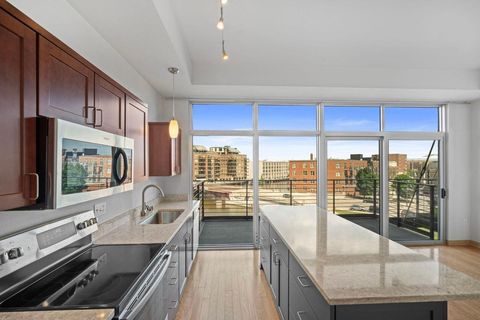
Active
$299,000
1
bds
|
1
ba
|
678
sqft
|
built
2006
106 W Seeboth St, Milwaukee, WI 53204
$-1,456
Cash flow
-25.4%
Cash-on-Cash Return
0.3%
Cap rate
0.5%
Rent to Value Ratio
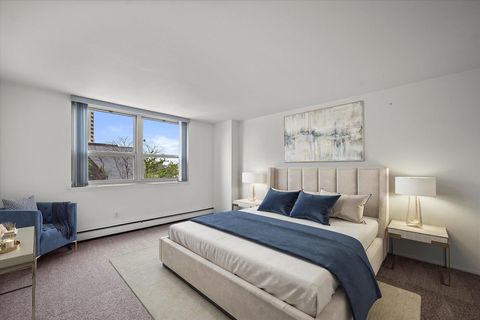
Active
$285,000
3
bds
|
2
ba
|
1,255
sqft
|
built
1967
1707 N Prospect Ave, Milwaukee, WI 53202
$-1,522
Cash flow
-27.9%
Cash-on-Cash Return
-0.3%
Cap rate
0.6%
Rent to Value Ratio
Active
$245,555
6
bds
|
0
ba
|
3,043
sqft
|
built
1923
2809 N 48th St, Milwaukee, WI 53210
$-679
Cash flow
-14.4%
Cash-on-Cash Return
2.8%
Cap rate
0.5%
Rent to Value Ratio
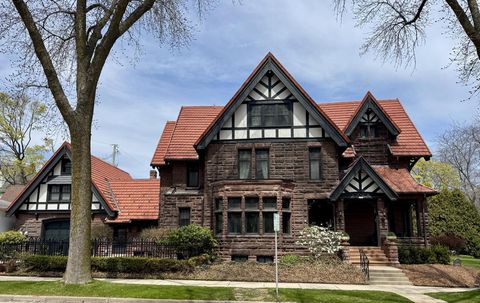
Active
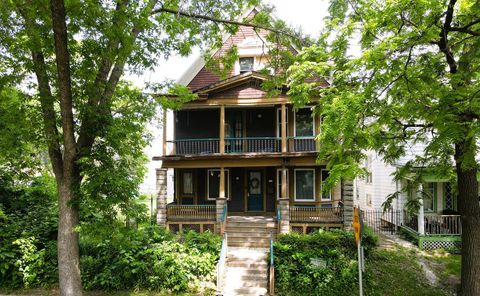
$1,399,000
7
bds
|
5
ba
|
6,911
sqft
|
built
1895
2701 N Lake Dr, Milwaukee, WI 53211
$-7,346
Cash flow
-27.4%
Cash-on-Cash Return
-0.2%
Cap rate
0.3%
Rent to Value Ratio
Active
$259,900
3
bds
|
1
ba
|
963
sqft
|
built
1953
5509 N 20th St, Milwaukee, WI 53209
$-183
Cash flow
-3.7%
Cash-on-Cash Return
5.3%
Cap rate
0.8%
Rent to Value Ratio
Active
$118,000
5
bds
|
0
ba
|
1,932
sqft
|
built
1910
2541 N 34th St, Milwaukee, WI 53210
$-3
Cash flow
-0.1%
Cash-on-Cash Return
6.1%
Cap rate
0.8%
Rent to Value Ratio
Active
$169,900
7
bds
|
0
ba
|
0
sqft
|
built
1892
3573 N 11th St, Milwaukee, WI 53206
$-280
Cash flow
-8.6%
Cash-on-Cash Return
4.2%
Cap rate
0.6%
Rent to Value Ratio
Active
$179,000
4
bds
|
1
ba
|
2,352
sqft
|
built
1955
2740 N 60th St, Milwaukee, WI 53210
$-547
Cash flow
-15.9%
Cash-on-Cash Return
2.5%
Cap rate
0.5%
Rent to Value Ratio
Active
$119,000
3
bds
|
1
ba
|
1,270
sqft
|
built
1893
3124 N 29th St, Milwaukee, WI 53216
$29
Cash flow
1.3%
Cash-on-Cash Return
6.4%
Cap rate
0.9%
Rent to Value Ratio
Active
$193,000
6
bds
|
1
ba
|
1,840
sqft
|
built
1953
5323 N 27th St, Milwaukee, WI 53209
$-487
Cash flow
-13.2%
Cash-on-Cash Return
3.1%
Cap rate
0.6%
Rent to Value Ratio

Active
$307,500
3
bds
|
1
ba
|
2,786
sqft
|
built
1927
2519 N 60th St, Milwaukee, WI 53210
$-828
Cash flow
-14.0%
Cash-on-Cash Return
2.9%
Cap rate
0.5%
Rent to Value Ratio
Active
$534,900
4
bds
|
3
ba
|
1,614
sqft
|
built
1920
4321 N Murray Ave, Milwaukee, WI 53211
$-2,285
Cash flow
-22.3%
Cash-on-Cash Return
1.0%
Cap rate
0.4%
Rent to Value Ratio
Active
$325,000
5
bds
|
2
ba
|
1,947
sqft
|
built
1954
5326 W Crawford Ave, Milwaukee, WI 53220
$-761
Cash flow
-12.2%
Cash-on-Cash Return
3.3%
Cap rate
0.6%
Rent to Value Ratio
Active
$90,000
3
bds
|
1
ba
|
892
sqft
|
built
1924
4715 N 39th St, Milwaukee, WI 53209
$222
Cash flow
12.9%
Cash-on-Cash Return
9.1%
Cap rate
1.3%
Rent to Value Ratio
Active
$369,900
4
bds
|
0
ba
|
1,800
sqft
|
built
1928
3044 S 9th Pl, Milwaukee, WI 53215
$-1,433
Cash flow
-20.2%
Cash-on-Cash Return
1.5%
Cap rate
0.3%
Rent to Value Ratio
Active
$129,900
4
bds
|
1
ba
|
1,981
sqft
|
built
1924
3918 N 24th St, Milwaukee, WI 53206
$-108
Cash flow
-4.3%
Cash-on-Cash Return
5.1%
Cap rate
0.8%
Rent to Value Ratio
Active
$440,000
4
bds
|
2
ba
|
1,320
sqft
|
built
1910
2865 S Ellen St, Milwaukee, WI 53207
$-1,405
Cash flow
-16.7%
Cash-on-Cash Return
2.3%
Cap rate
0.4%
Rent to Value Ratio
Active
$164,900
4
bds
|
1
ba
|
2,250
sqft
|
built
1926
2878 N 57th St, Milwaukee, WI 53210
$-359
Cash flow
-11.4%
Cash-on-Cash Return
3.5%
Cap rate
0.7%
Rent to Value Ratio
Active
$169,900
4
bds
|
2
ba
|
1,350
sqft
|
built
1926
4025 W Fairmount Ave, Milwaukee, WI 53209
$-275
Cash flow
-8.4%
Cash-on-Cash Return
4.2%
Cap rate
0.6%
Rent to Value Ratio
Active
$169,900
4
bds
|
1
ba
|
2,288
sqft
|
built
1930
3507 N 40th St, Milwaukee, WI 53216
$-331
Cash flow
-10.2%
Cash-on-Cash Return
3.8%
Cap rate
0.6%
Rent to Value Ratio
Active
$299,000
2
bds
|
1
ba
|
847
sqft
|
built
1938
4544 S Quincy Ave, Milwaukee, WI 53207
$-945
Cash flow
-16.5%
Cash-on-Cash Return
2.4%
Cap rate
0.4%
Rent to Value Ratio
Active
$95,000
6
bds
|
1
ba
|
2,619
sqft
|
built
1908
3912 W Cherry St, Milwaukee, WI 53208
$160
Cash flow
8.8%
Cash-on-Cash Return
8.2%
Cap rate
1.2%
Rent to Value Ratio
Active
$335,000
3
bds
|
1
ba
|
1,378
sqft
|
built
1953
3653 S Herman St, Milwaukee, WI 53207
$-960
Cash flow
-15.0%
Cash-on-Cash Return
2.7%
Cap rate
0.5%
Rent to Value Ratio
Active
$144,900
2
bds
|
1
ba
|
728
sqft
|
built
1951
4928 N 27th St, Milwaukee, WI 53209
$118
Cash flow
4.2%
Cash-on-Cash Return
7.1%
Cap rate
1.0%
Rent to Value Ratio
Active
$250,000
3
bds
|
2
ba
|
1,491
sqft
|
built
1922
2928 S 48th St, Milwaukee, WI 53219
$-703
Cash flow
-14.7%
Cash-on-Cash Return
2.8%
Cap rate
0.6%
Rent to Value Ratio
Active
$375,000
5
bds
|
1
ba
|
2,014
sqft
|
built
1965
8731 W Morgan Ave, Milwaukee, WI 53228
$-1,496
Cash flow
-20.8%
Cash-on-Cash Return
1.4%
Cap rate
0.4%
Rent to Value Ratio
Active
$315,900
5
bds
|
2
ba
|
3,544
sqft
|
built
1904
930 N 34th St, Milwaukee, WI 53208
$-244
Cash flow
-4.0%
Cash-on-Cash Return
5.2%
Cap rate
0.8%
Rent to Value Ratio
Active
$299,900
5
bds
|
0
ba
|
2,772
sqft
|
built
1960
7100 W Hampton Ave, Milwaukee, WI 53218
$-1,041
Cash flow
-18.1%
Cash-on-Cash Return
2.0%
Cap rate
0.5%
Rent to Value Ratio
Active
$139,900
3
bds
|
1
ba
|
1,326
sqft
|
built
1881
1815 W Galena St, Milwaukee, WI 53205
$264
Cash flow
9.8%
Cash-on-Cash Return
8.4%
Cap rate
1.1%
Rent to Value Ratio
Active
$144,900
3
bds
|
1
ba
|
690
sqft
|
built
1893
2410 W Legion St, Milwaukee, WI 53204
$-98
Cash flow
-3.5%
Cash-on-Cash Return
5.3%
Cap rate
0.8%
Rent to Value Ratio
Active
$199,900
3
bds
|
2
ba
|
1,401
sqft
|
built
1973
9033 N 70th St, Milwaukee, WI 53223
$-671
Cash flow
-17.5%
Cash-on-Cash Return
2.1%
Cap rate
0.8%
Rent to Value Ratio
Active
$254,900
4
bds
|
2
ba
|
1,963
sqft
|
built
1941
3132 N 49th St, Milwaukee, WI 53216
$-816
Cash flow
-16.7%
Cash-on-Cash Return
2.3%
Cap rate
0.5%
Rent to Value Ratio
Active
$88,000
3
bds
|
1
ba
|
1,638
sqft
|
built
1928
6841 W Fond Du Lac Ave, Milwaukee, WI 53218
$375
Cash flow
22.2%
Cash-on-Cash Return
11.3%
Cap rate
1.6%
Rent to Value Ratio
Active
$269,900
5
bds
|
1
ba
|
2,012
sqft
|
built
1966
4044 W Vera Ave, Milwaukee, WI 53209
$-788
Cash flow
-15.2%
Cash-on-Cash Return
2.6%
Cap rate
0.4%
Rent to Value Ratio
Active
$75,000
2
bds
|
1
ba
|
826
sqft
|
built
1924
3750 N 27th St, Milwaukee, WI 53216
$291
Cash flow
20.2%
Cash-on-Cash Return
10.8%
Cap rate
1.5%
Rent to Value Ratio
Active
$349,900
bds
|
0
ba
|
0
sqft
|
built
1951
4435 W Capitol Dr, Milwaukee, WI 53216
$-1,318
Cash flow
-19.7%
Cash-on-Cash Return
1.6%
Cap rate
0.4%
Rent to Value Ratio