Minneapolis, MN Investment Properties for Sale
Browse homes for sale and investment properties in Minneapolis, MN. Refine your search by price, property type, or more.
Best cash flowing properties in Minneapolis, MN
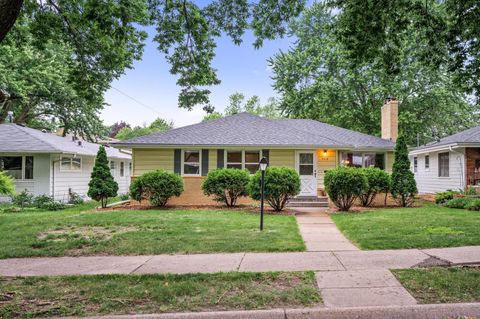
Active
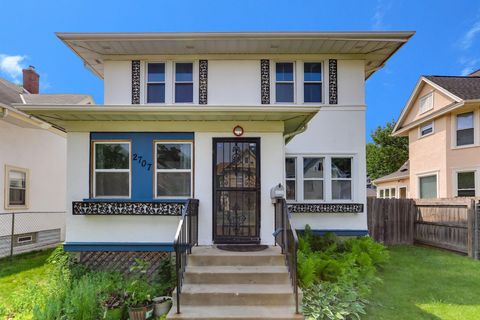
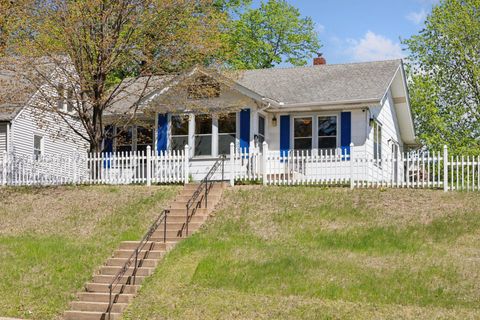
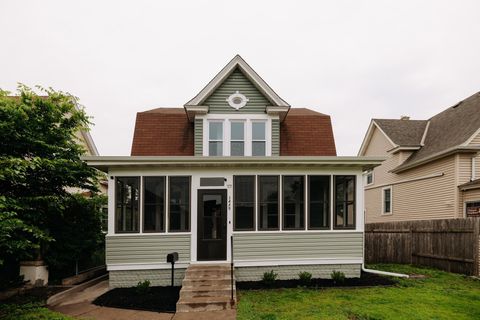
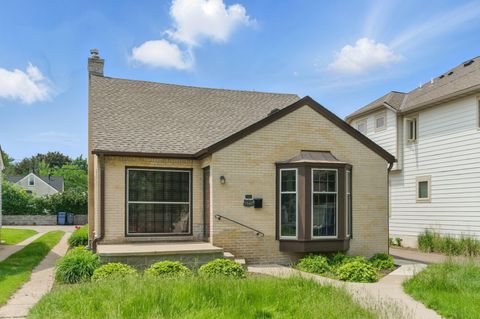
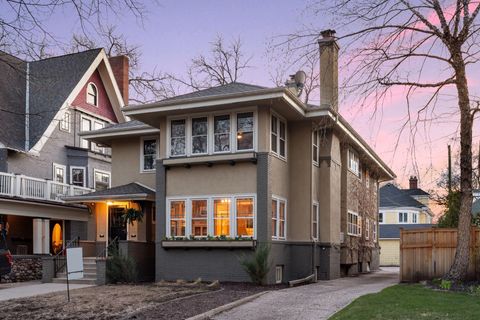
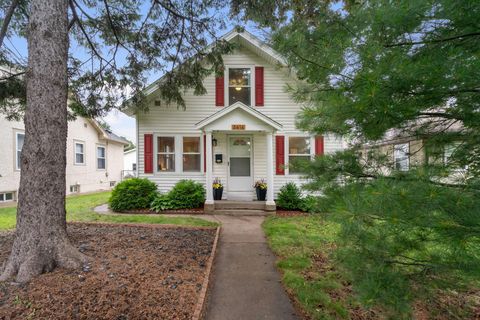
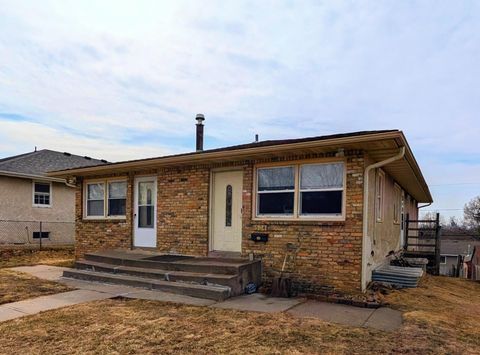
$229,900
3
bds
|
2
ba
|
1,892
sqft
|
built
1923
2707 Girard Ave N, Minneapolis, MN 55411
$204
Cash flow
4.6%
Cash-on-Cash Return
6.7%
Cap rate
1.0%
Rent to Value Ratio
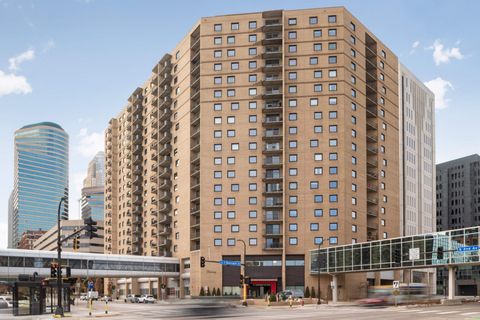
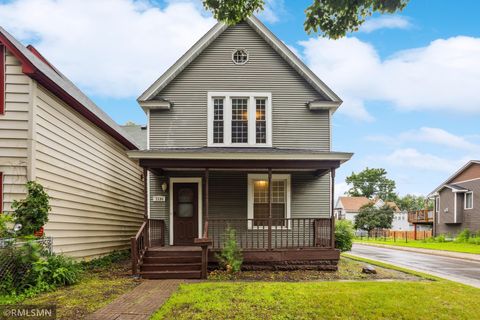
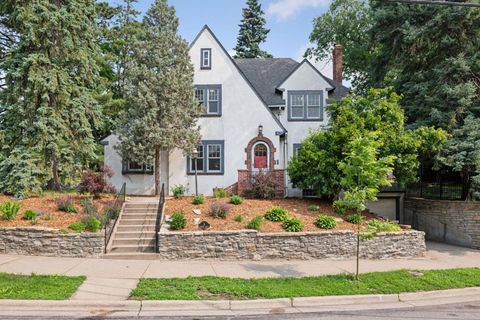
Active
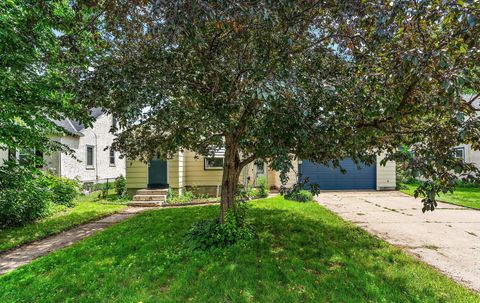
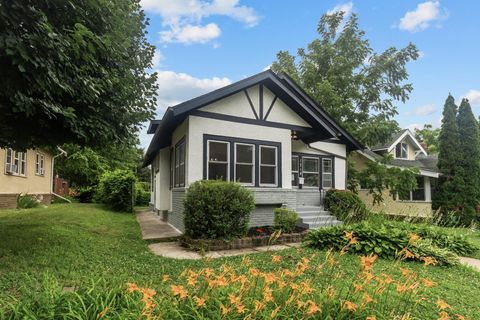
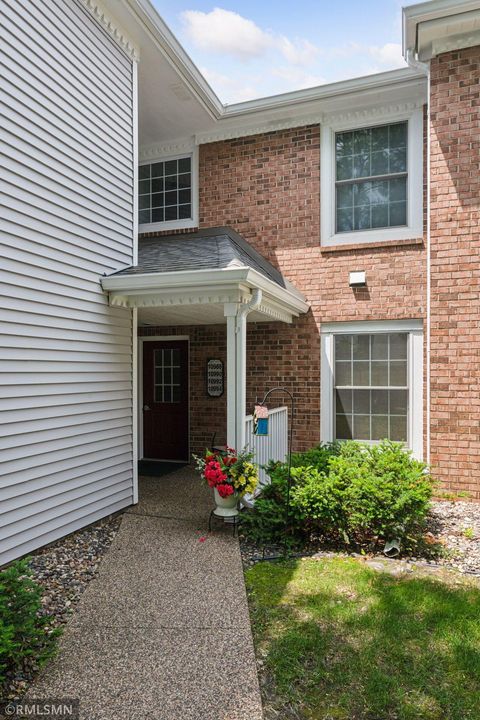
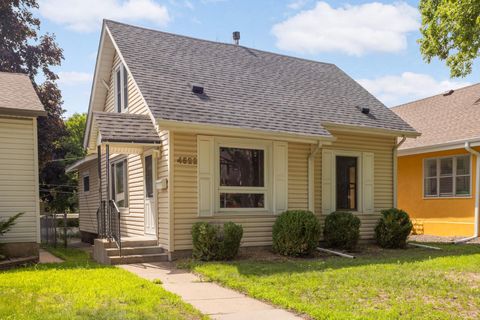
$305,000
2
bds
|
1
ba
|
1,168
sqft
|
built
1946
8219 Blaisdell Ave S, Minneapolis, MN 55420
$26
Cash flow
0.4%
Cash-on-Cash Return
5.8%
Cap rate
0.8%
Rent to Value Ratio
847 out of 1,028 properties for sale in Minneapolis, MN
Limited Results Shown
Create a free account, or log in to reveal all property listings and enjoy the complete experience.
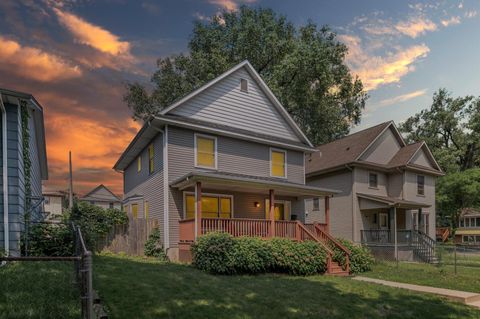
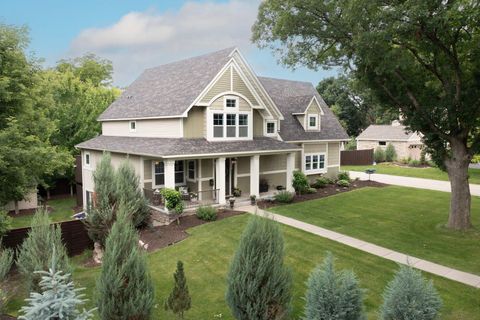
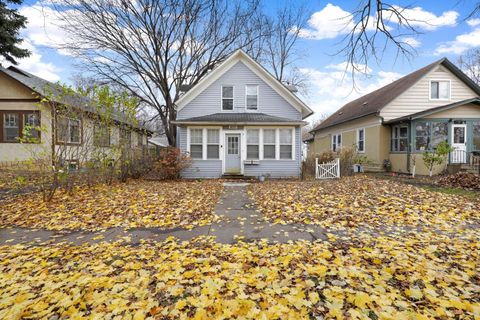
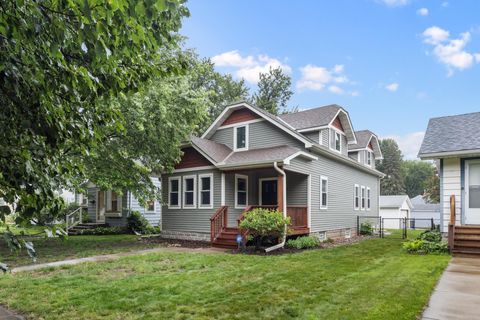
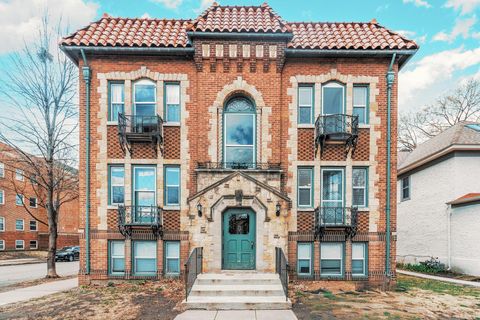
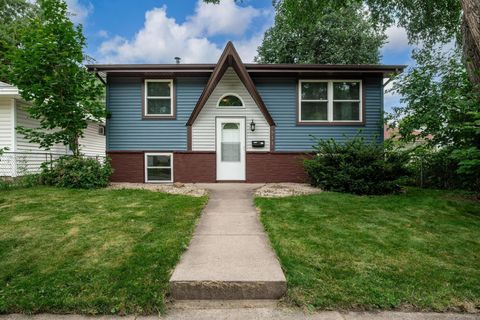
Active
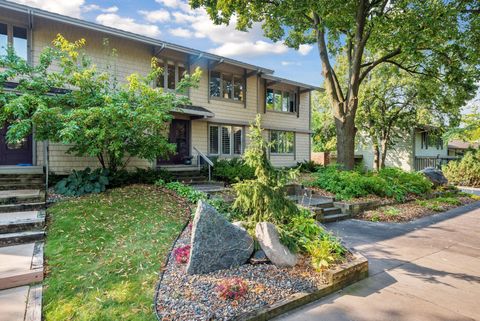
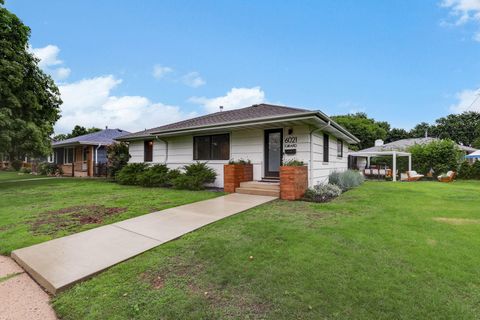
$310,000
4
bds
|
3
ba
|
2,303
sqft
|
built
2001
2651 Colfax Ave N, Minneapolis, MN 55411
$-33
Cash flow
-0.6%
Cash-on-Cash Return
5.6%
Cap rate
0.8%
Rent to Value Ratio
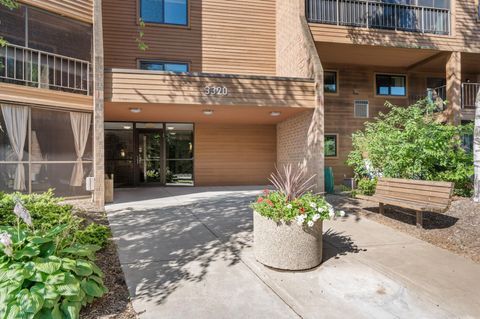
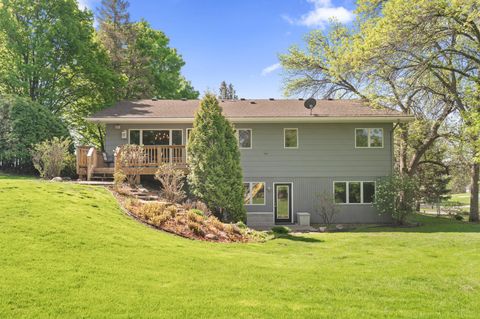
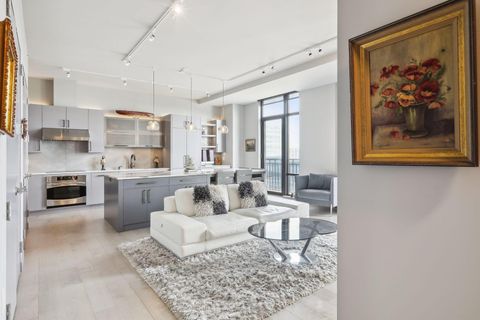
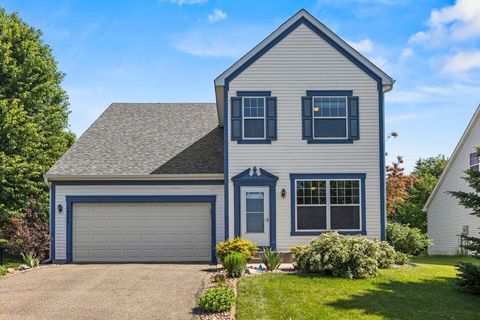
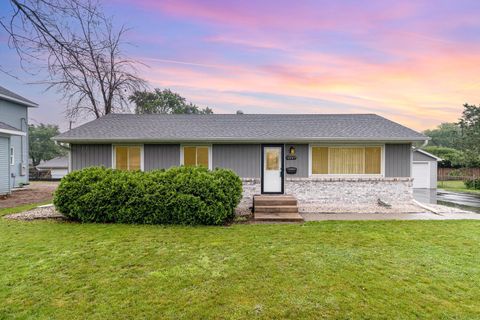
Active
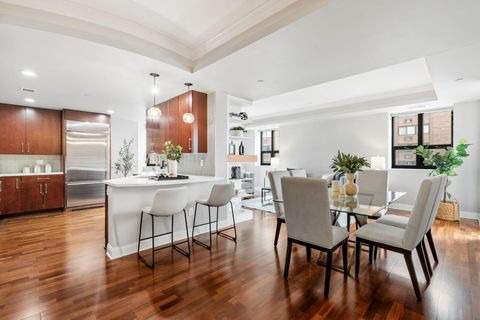
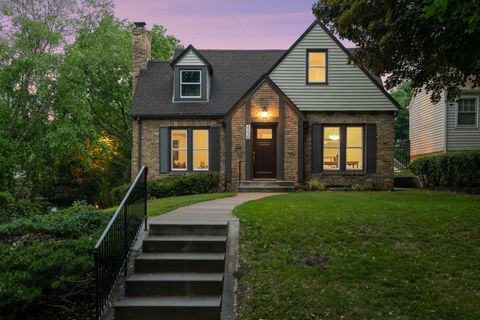
$214,900
2
bds
|
2
ba
|
1,140
sqft
|
built
1980
3320 Louisiana Ave S, Minneapolis, MN 55426
$-530
Cash flow
-12.9%
Cash-on-Cash Return
2.7%
Cap rate
0.9%
Rent to Value Ratio
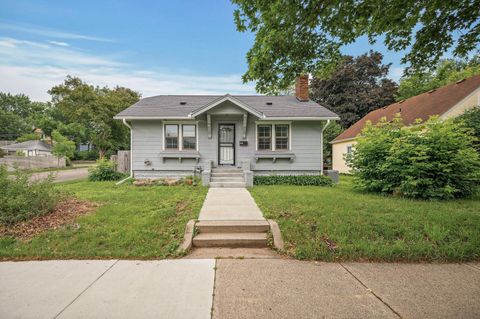
Active
$435,000
2
bds
|
2
ba
|
1,463
sqft
|
built
1915
5153 Penn Ave S, Minneapolis, MN 55419
$-707
Cash flow
-8.5%
Cash-on-Cash Return
3.7%
Cap rate
0.7%
Rent to Value Ratio
Active
$364,900
4
bds
|
2
ba
|
2,342
sqft
|
built
1924
1714 Vincent Ave N, Minneapolis, MN 55411
$-622
Cash flow
-8.9%
Cash-on-Cash Return
3.6%
Cap rate
0.6%
Rent to Value Ratio
Active
$544,000
2
bds
|
3
ba
|
2,219
sqft
|
built
1975
1058 Cedar View Dr, Minneapolis, MN 55405
$-1,519
Cash flow
-14.6%
Cash-on-Cash Return
2.3%
Cap rate
0.6%
Rent to Value Ratio
Active
$599,900
2
bds
|
2
ba
|
1,539
sqft
|
built
2006
100 3rd Ave S, Minneapolis, MN 55401
$-2,469
Cash flow
-21.5%
Cash-on-Cash Return
0.7%
Cap rate
0.6%
Rent to Value Ratio
Active
$675,000
6
bds
|
4
ba
|
3,476
sqft
|
built
1918
212 E Diamond Lake Rd, Minneapolis, MN 55419
$-2,140
Cash flow
-16.5%
Cash-on-Cash Return
1.9%
Cap rate
0.4%
Rent to Value Ratio
Active
$650,000
3
bds
|
2
ba
|
1,775
sqft
|
built
1909
4709 Colfax Ave S, Minneapolis, MN 55419
$-1,533
Cash flow
-12.3%
Cash-on-Cash Return
2.8%
Cap rate
0.5%
Rent to Value Ratio
Active
$459,900
4
bds
|
2
ba
|
2,306
sqft
|
built
1974
607 Adams St NE, Minneapolis, MN 55413
$-546
Cash flow
-6.2%
Cash-on-Cash Return
4.3%
Cap rate
0.7%
Rent to Value Ratio
Active
$2,395,000
4
bds
|
4
ba
|
4,080
sqft
|
built
1959
4113 Monterey Ave, Minneapolis, MN 55416
$-9,732
Cash flow
-21.2%
Cash-on-Cash Return
0.8%
Cap rate
0.1%
Rent to Value Ratio
Active
$389,900
3
bds
|
2
ba
|
1,795
sqft
|
built
1908
3445 4th Ave S, Minneapolis, MN 55408
$-581
Cash flow
-7.8%
Cash-on-Cash Return
3.9%
Cap rate
0.6%
Rent to Value Ratio
Active
$1,297,000
4
bds
|
5
ba
|
3,730
sqft
|
built
2013
6232 Virginia Ave S, Minneapolis, MN 55424
$-4,175
Cash flow
-16.8%
Cash-on-Cash Return
1.8%
Cap rate
0.4%
Rent to Value Ratio
Active
$549,900
4
bds
|
4
ba
|
3,411
sqft
|
built
1969
9610 28th Ave N, Minneapolis, MN 55441
$-732
Cash flow
-6.9%
Cash-on-Cash Return
4.1%
Cap rate
0.6%
Rent to Value Ratio
Active
$345,000
3
bds
|
2
ba
|
1,503
sqft
|
built
1924
4301 Columbus Ave, Minneapolis, MN 55407
$-589
Cash flow
-8.9%
Cash-on-Cash Return
3.6%
Cap rate
0.6%
Rent to Value Ratio
Active
$449,900
3
bds
|
2
ba
|
1,562
sqft
|
built
1941
5540 Aldrich Ave S, Minneapolis, MN 55419
$-861
Cash flow
-10.0%
Cash-on-Cash Return
3.9%
Cap rate
0.6%
Rent to Value Ratio
Active
$219,000
2
bds
|
2
ba
|
1,344
sqft
|
built
1984
10992 Quebec Ave S, Minneapolis, MN 55438
$-380
Cash flow
-9.1%
Cash-on-Cash Return
3.6%
Cap rate
0.9%
Rent to Value Ratio
Active
$359,000
3
bds
|
2
ba
|
1,258
sqft
|
built
1909
850 22nd Ave SE, Minneapolis, MN 55414
$-1,142
Cash flow
-16.6%
Cash-on-Cash Return
2.4%
Cap rate
0.5%
Rent to Value Ratio
Active
$289,000
1
bds
|
1
ba
|
875
sqft
|
built
2007
201 S 11th St, Minneapolis, MN 55403
$-903
Cash flow
-16.3%
Cash-on-Cash Return
2.5%
Cap rate
1.0%
Rent to Value Ratio
Active
$475,000
3
bds
|
3
ba
|
1,982
sqft
|
built
1919
1770 Humboldt Ave S, Minneapolis, MN 55403
$-1,090
Cash flow
-12.0%
Cash-on-Cash Return
2.9%
Cap rate
0.5%
Rent to Value Ratio
Active
$175,000
1
bds
|
1
ba
|
771
sqft
|
built
1981
121 Washington Ave S, Minneapolis, MN 55401
$-512
Cash flow
-15.3%
Cash-on-Cash Return
2.2%
Cap rate
0.9%
Rent to Value Ratio
Active
$519,900
4
bds
|
3
ba
|
2,587
sqft
|
built
1925
6015 Clinton Ave, Minneapolis, MN 55419
$-2,029
Cash flow
-20.4%
Cash-on-Cash Return
1.6%
Cap rate
0.3%
Rent to Value Ratio
Active
$525,000
4
bds
|
4
ba
|
2,562
sqft
|
built
2002
14004 52nd Ave N, Minneapolis, MN 55446
$-831
Cash flow
-8.3%
Cash-on-Cash Return
3.8%
Cap rate
0.6%
Rent to Value Ratio
Active
$299,000
3
bds
|
1
ba
|
1,214
sqft
|
built
1923
5616 36th Ave S, Minneapolis, MN 55417
$-162
Cash flow
-2.8%
Cash-on-Cash Return
5.0%
Cap rate
0.8%
Rent to Value Ratio
Active
$359,000
4
bds
|
2
ba
|
1,810
sqft
|
built
1900
1134 Lincoln St NE, Minneapolis, MN 55413
$-532
Cash flow
-7.7%
Cash-on-Cash Return
3.9%
Cap rate
0.6%
Rent to Value Ratio
Active
$149,900
2
bds
|
1
ba
|
0
sqft
|
built
1929
3252 Fremont Ave S, Minneapolis, MN 55408
$-235
Cash flow
-8.2%
Cash-on-Cash Return
3.8%
Cap rate
1.1%
Rent to Value Ratio

Active
$975,000
3
bds
|
4
ba
|
3,241
sqft
|
built
2021
5975 Inland Ln N, Minneapolis, MN 55446
$-2,074
Cash flow
-11.1%
Cash-on-Cash Return
3.1%
Cap rate
0.6%
Rent to Value Ratio
Active
$569,900
2
bds
|
2
ba
|
1,240
sqft
|
built
2006
215 10th Ave S, Minneapolis, MN 55415
$-1,511
Cash flow
-13.8%
Cash-on-Cash Return
2.5%
Cap rate
0.6%
Rent to Value Ratio
Active
$409,900
3
bds
|
2
ba
|
1,969
sqft
|
built
1958
5512 Vincent Ave S, Minneapolis, MN 55410
$-540
Cash flow
-6.9%
Cash-on-Cash Return
4.1%
Cap rate
0.7%
Rent to Value Ratio
Active
$575,000
4
bds
|
2
ba
|
2,050
sqft
|
built
1923
6 Elmwood Pl E, Minneapolis, MN 55419
$-1,203
Cash flow
-10.9%
Cash-on-Cash Return
3.2%
Cap rate
0.5%
Rent to Value Ratio
Active
$449,900
4
bds
|
2
ba
|
1,440
sqft
|
built
1972
711 Quincy St NE, Minneapolis, MN 55413
$-777
Cash flow
-9.0%
Cash-on-Cash Return
3.6%
Cap rate
0.6%
Rent to Value Ratio
Active
$385,000
4
bds
|
2
ba
|
2,002
sqft
|
built
1957
10209 Clinton Ave S, Minneapolis, MN 55420
$-250
Cash flow
-3.4%
Cash-on-Cash Return
4.9%
Cap rate
0.7%
Rent to Value Ratio
Active
$400,000
10
bds
|
4
ba
|
2,700
sqft
|
built
1965
524 37th Ave NE, Minneapolis, MN 55421
$-640
Cash flow
-8.3%
Cash-on-Cash Return
4.3%
Cap rate
0.7%
Rent to Value Ratio
Active
$275,000
3
bds
|
2
ba
|
1,152
sqft
|
built
1915
4522 15th Ave S, Minneapolis, MN 55407
$-119
Cash flow
-2.3%
Cash-on-Cash Return
5.7%
Cap rate
0.8%
Rent to Value Ratio
Active
$480,000
3
bds
|
2
ba
|
1,927
sqft
|
built
1957
6021 Girard Ave S, Minneapolis, MN 55419
$-627
Cash flow
-6.8%
Cash-on-Cash Return
4.1%
Cap rate
0.6%
Rent to Value Ratio
Active
$630,000
4
bds
|
3
ba
|
2,421
sqft
|
built
1939
4236 22nd Ave S, Minneapolis, MN 55407
$-1,974
Cash flow
-16.3%
Cash-on-Cash Return
1.9%
Cap rate
0.3%
Rent to Value Ratio
Active
$899,900
6
bds
|
3
ba
|
3,470
sqft
|
built
1925
1721 Humboldt Ave S, Minneapolis, MN 55403
$-3,150
Cash flow
-18.3%
Cash-on-Cash Return
2.0%
Cap rate
0.4%
Rent to Value Ratio
Active
$330,000
2
bds
|
2
ba
|
1,190
sqft
|
built
1911
4312 Nokomis Ave, Minneapolis, MN 55406
$-359
Cash flow
-5.7%
Cash-on-Cash Return
4.4%
Cap rate
0.7%
Rent to Value Ratio
Active
$86,000
1
bds
|
1
ba
|
686
sqft
|
built
1959
2500 Blaisdell Ave, Minneapolis, MN 55404
$-504
Cash flow
-30.6%
Cash-on-Cash Return
-1.4%
Cap rate
1.3%
Rent to Value Ratio