Minneapolis, MN Investment Properties for Sale
Browse homes for sale and investment properties in Minneapolis, MN. Refine your search by price, property type, or more.
Best cash flowing properties in Minneapolis, MN

Active
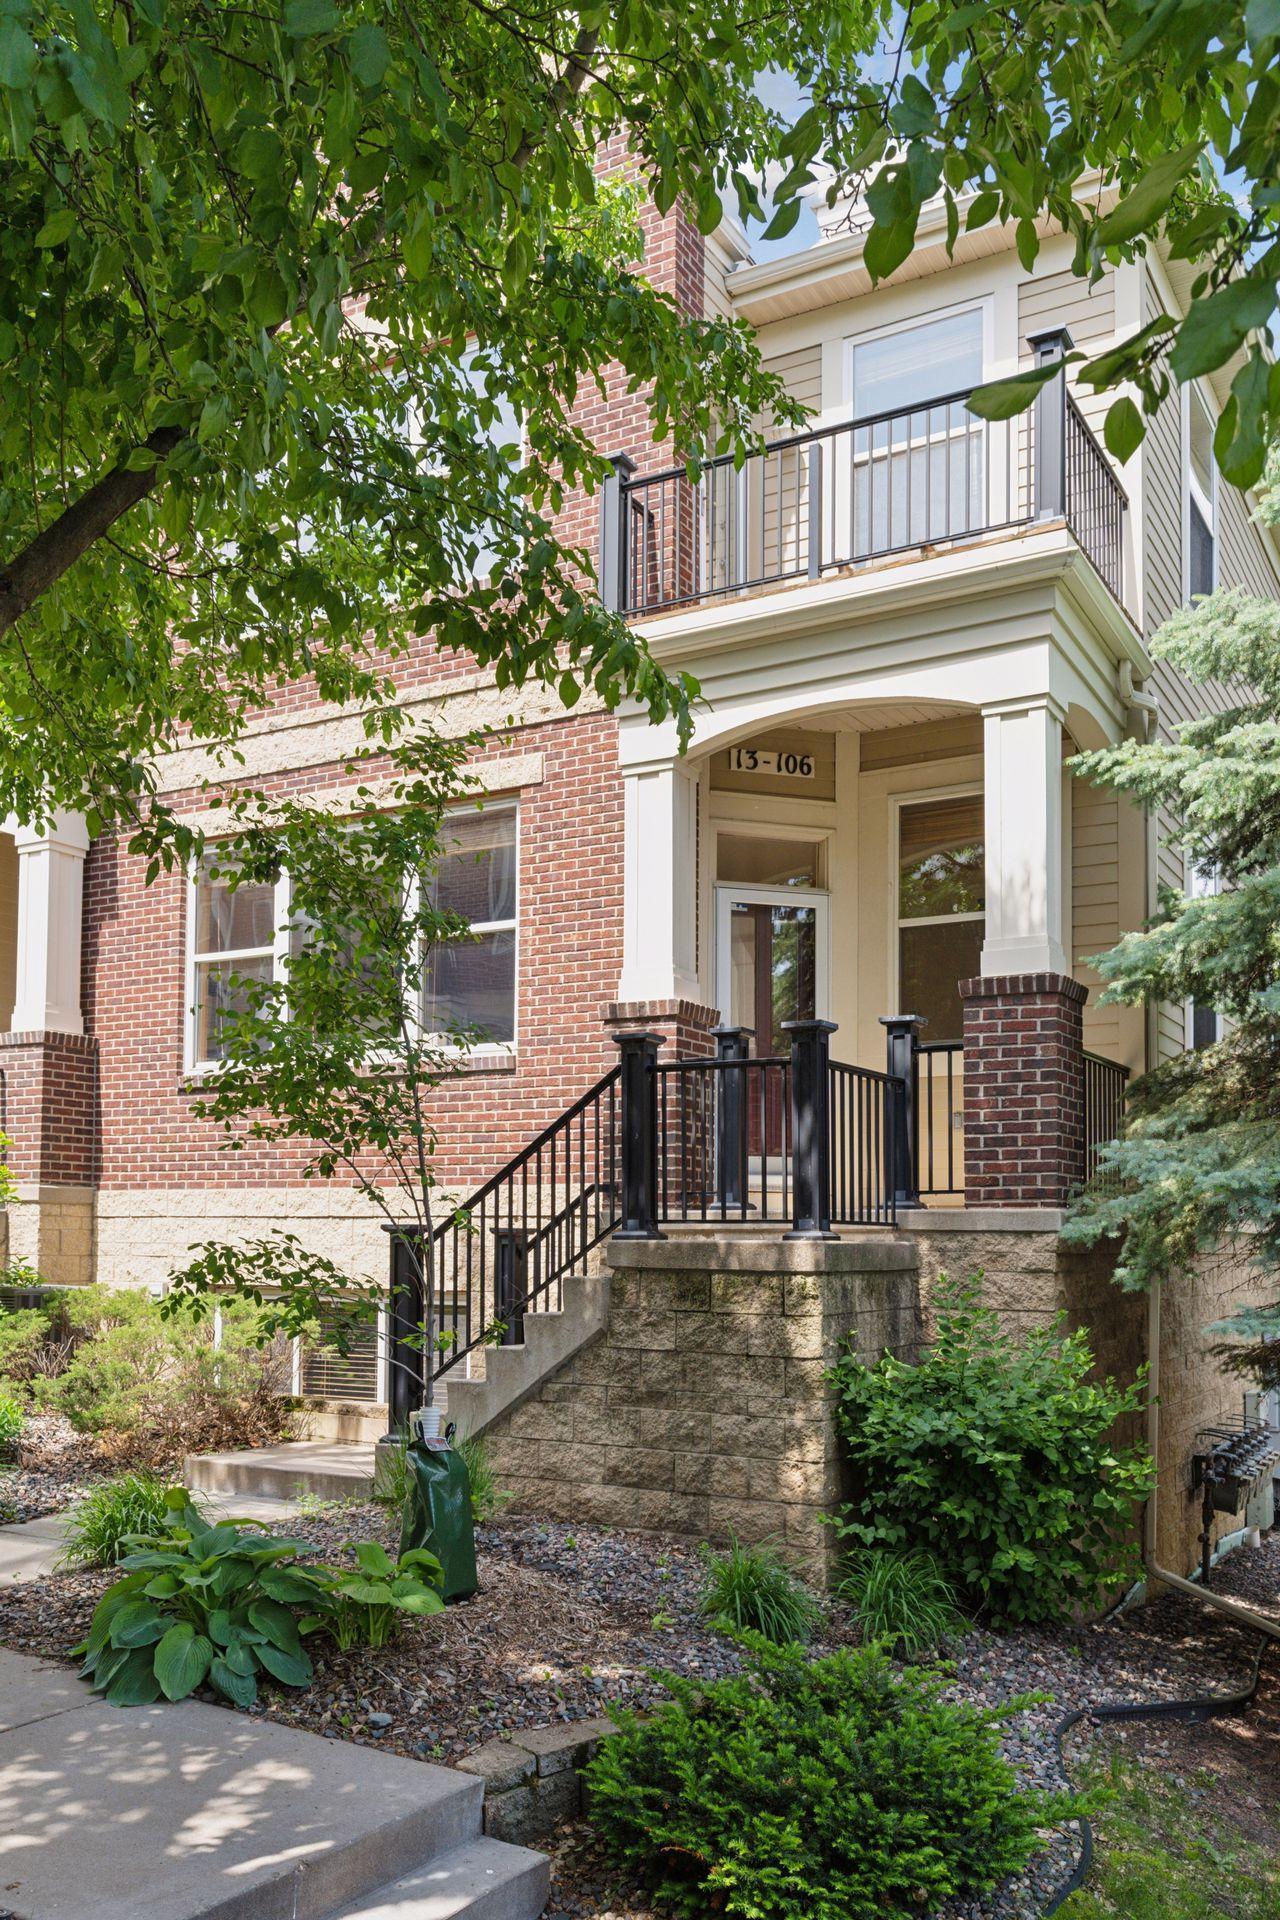
$324,900
4
bds
|
3
ba
|
1,827
sqft
|
built
1900
2450 13th Ave S, Minneapolis, MN 55404
$-330
Cash flow
-5.3%
Cash-on-Cash Return
5.1%
Cap rate
0.6%
Rent to Value Ratio
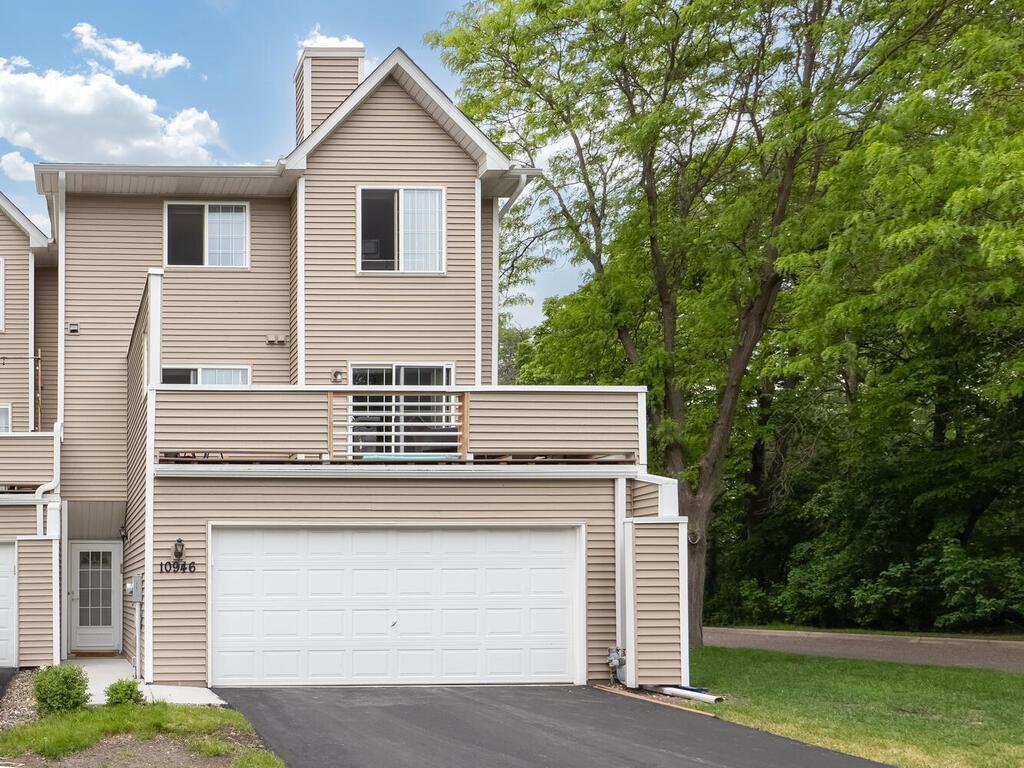
Active
$259,900
2
bds
|
3
ba
|
1,992
sqft
|
built
1996
10946 Johnson St NE, Minneapolis, MN 55434
$-420
Cash flow
-8.4%
Cash-on-Cash Return
4.4%
Cap rate
0.8%
Rent to Value Ratio
155 out of 177 properties for sale in Minneapolis, MN
Limited Results Shown
Create a free account, or log in to reveal all property listings and enjoy the complete experience.
Active
$390,000
4
bds
|
2
ba
|
2,236
sqft
|
built
1908
1049 18th Ave SE, Minneapolis, MN 55414
$-924
Cash flow
-12.4%
Cash-on-Cash Return
3.5%
Cap rate
0.6%
Rent to Value Ratio

Active
$444,900
6
bds
|
2
ba
|
2,050
sqft
|
built
1960
3536 Pillsbury Ave S, Minneapolis, MN 55408
$-1,409
Cash flow
-16.5%
Cash-on-Cash Return
2.5%
Cap rate
0.5%
Rent to Value Ratio

Active
$430,000
7
bds
|
4
ba
|
3,108
sqft
|
built
1921
1418 Oliver Ave N, Minneapolis, MN 55411
$-1,452
Cash flow
-17.6%
Cash-on-Cash Return
2.3%
Cap rate
0.5%
Rent to Value Ratio
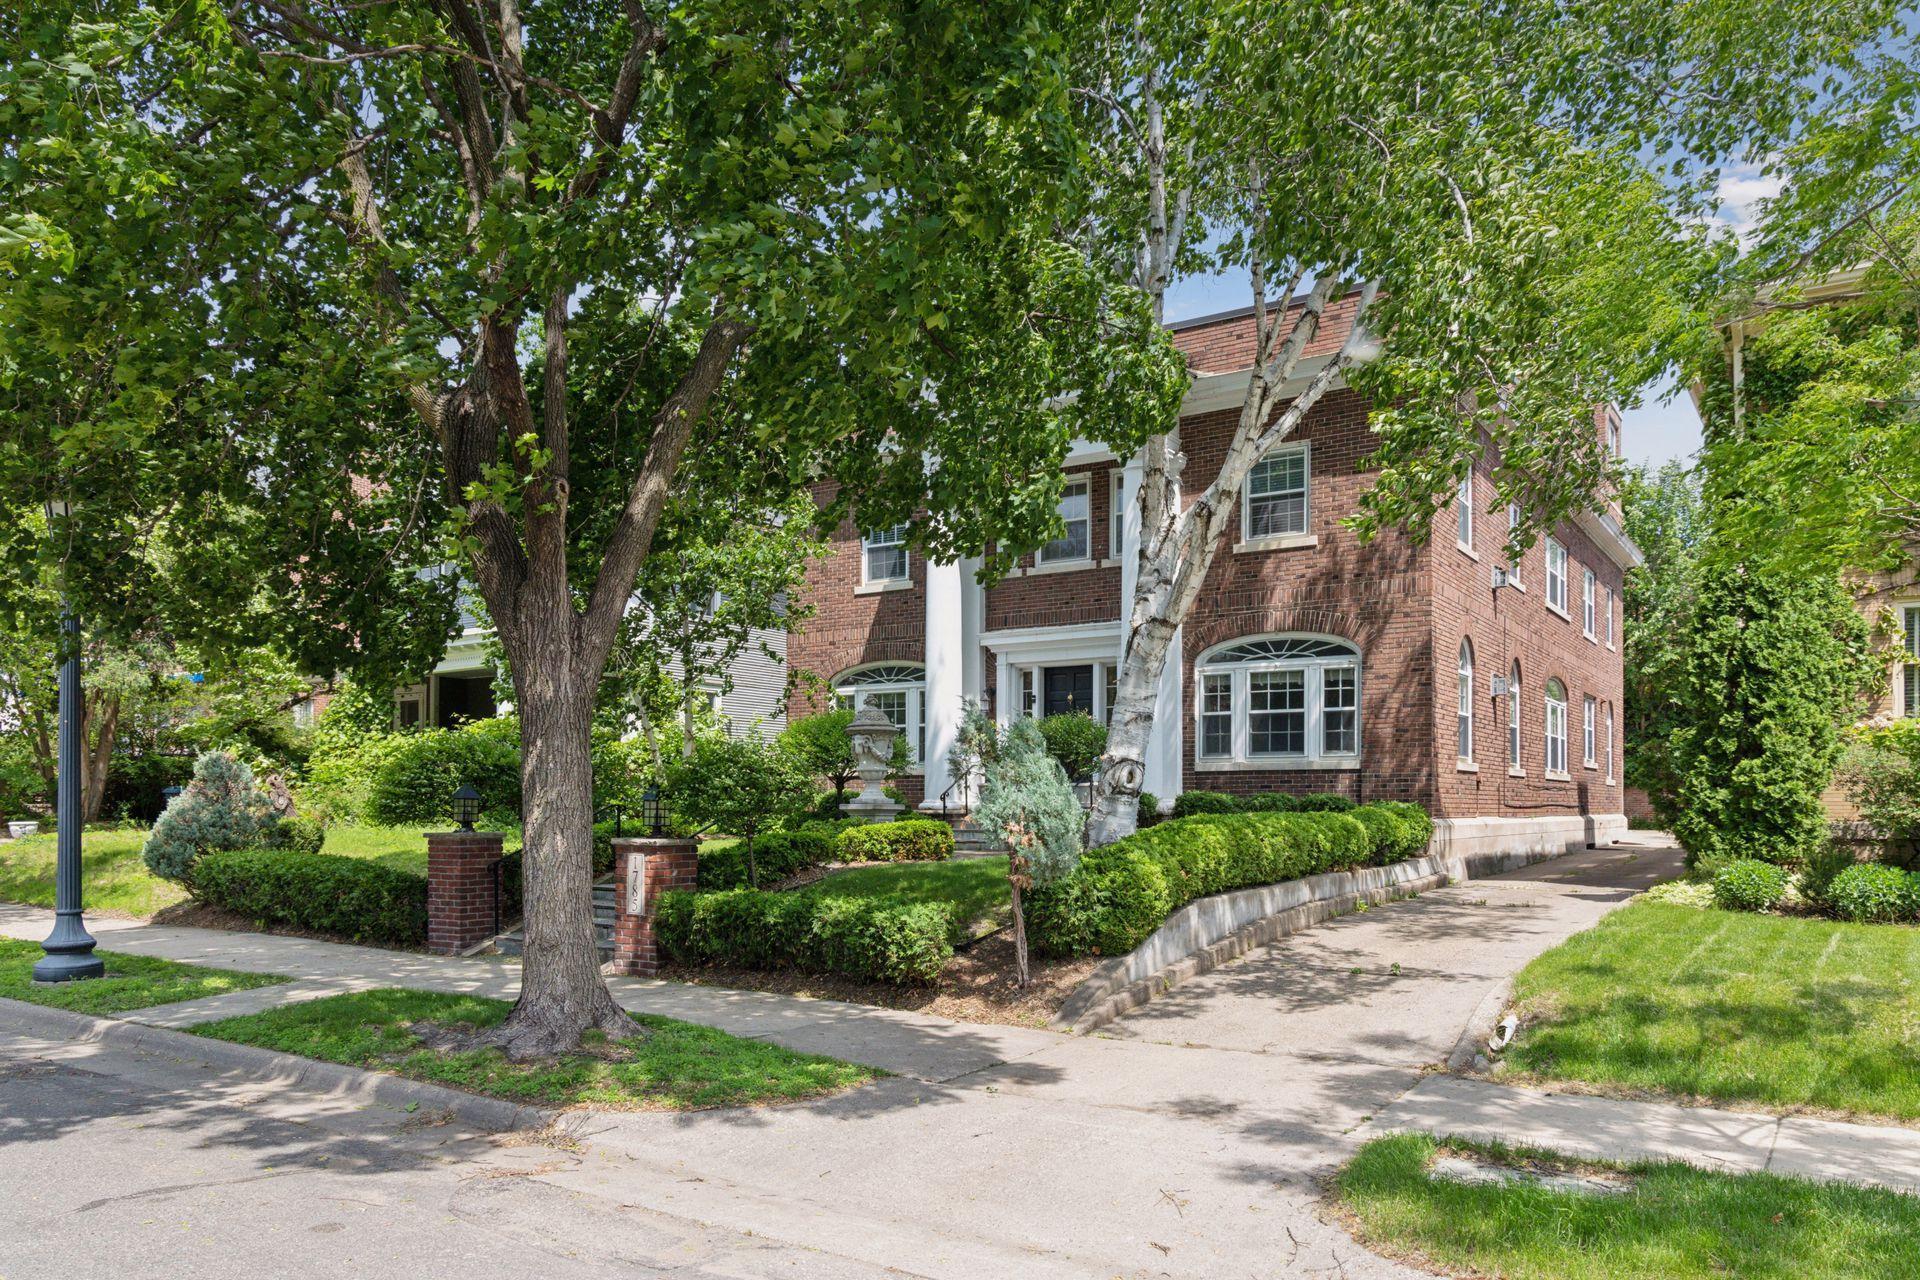
Active
$1,150,000
6
bds
|
6
ba
|
4,600
sqft
|
built
1920
1785 Dupont Ave S, Minneapolis, MN 55403
$-4,411
Cash flow
-20.0%
Cash-on-Cash Return
1.7%
Cap rate
0.4%
Rent to Value Ratio
Active
$574,900
6
bds
|
3
ba
|
3,821
sqft
|
built
1914
2519 E 22nd St, Minneapolis, MN 55406
$-2,418
Cash flow
-21.9%
Cash-on-Cash Return
1.3%
Cap rate
0.3%
Rent to Value Ratio
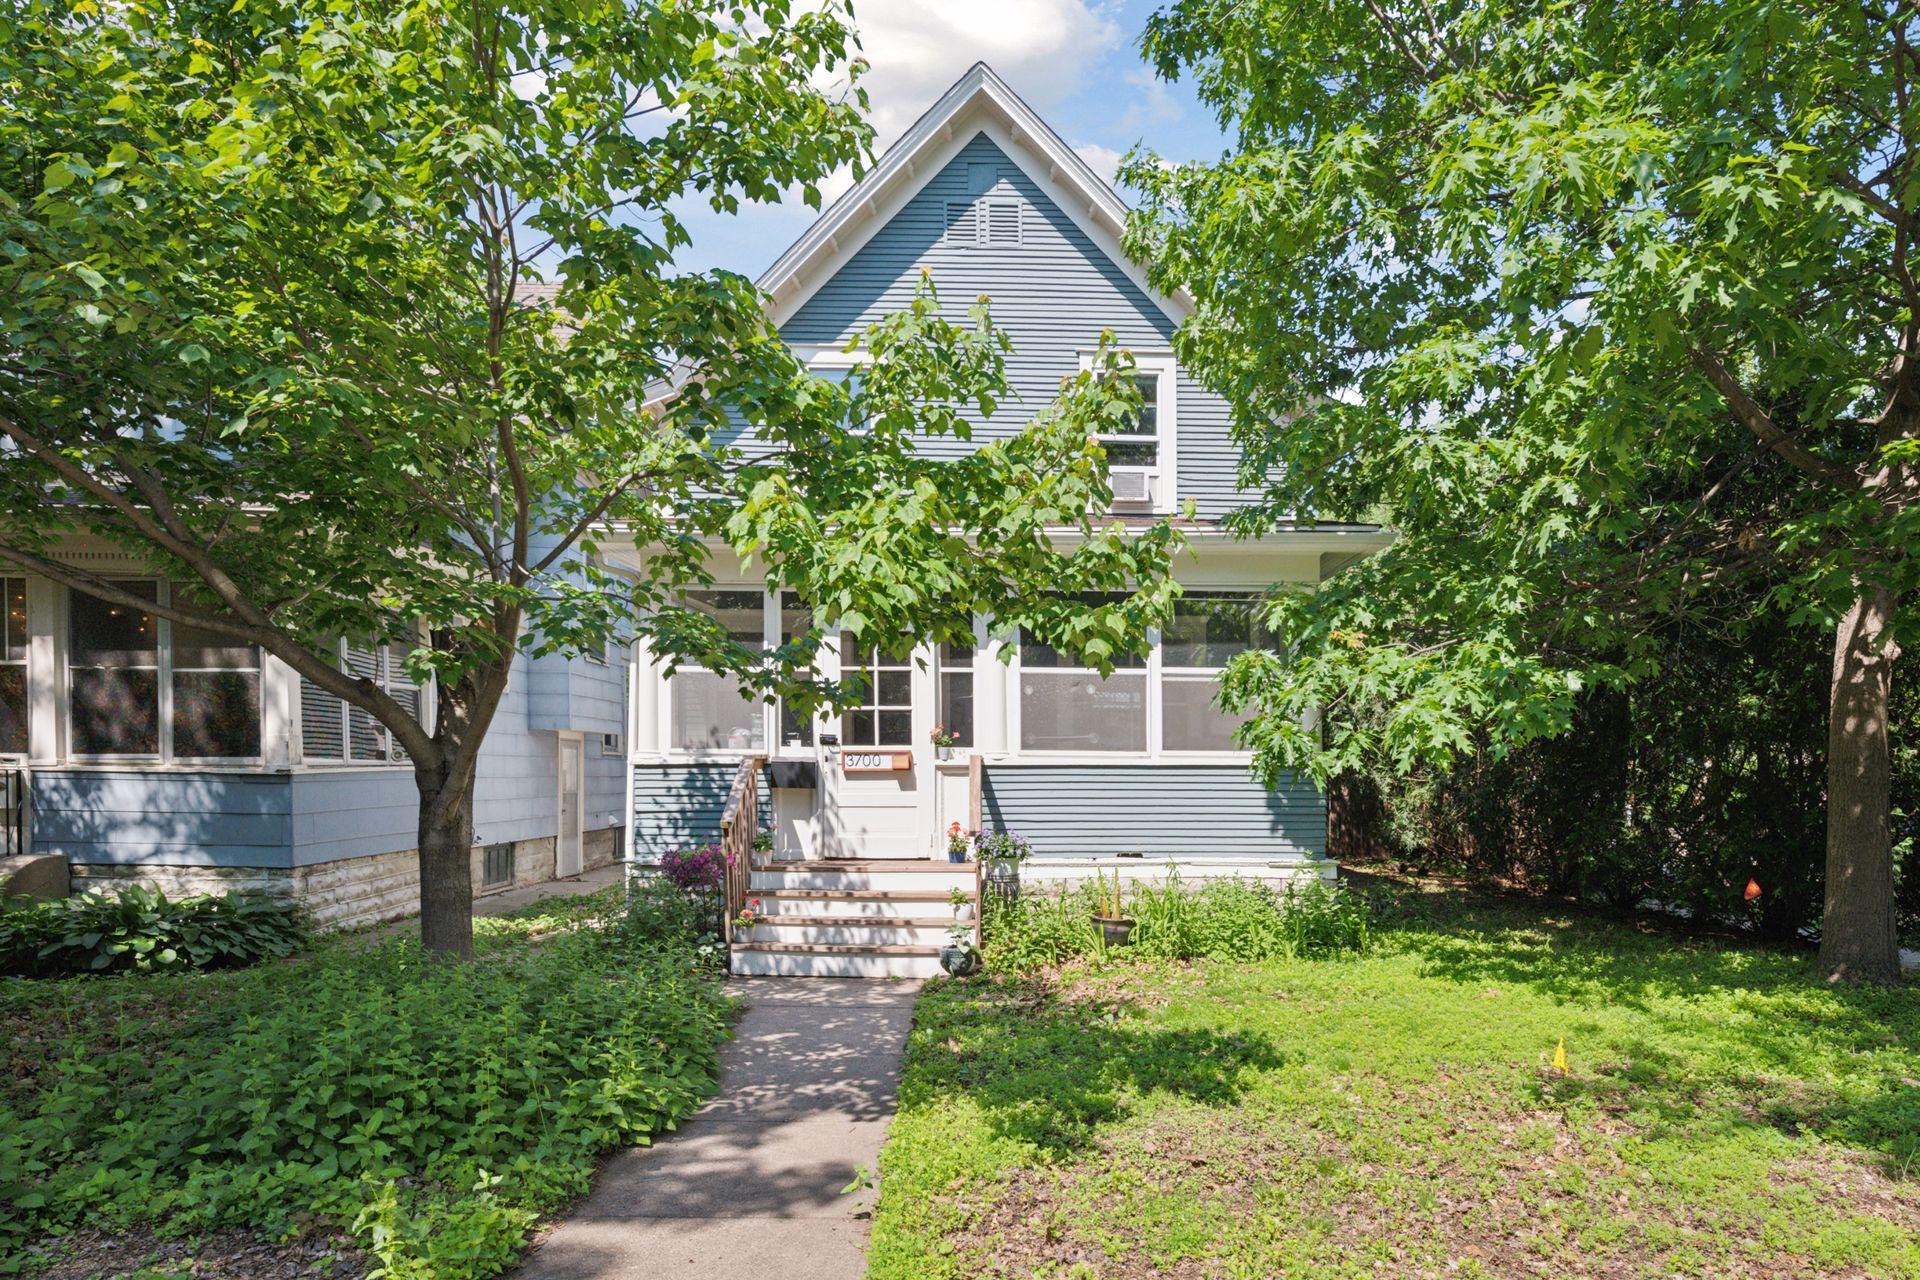
Active
$479,000
4
bds
|
2
ba
|
1,780
sqft
|
built
1906
611 W 37th St, Minneapolis, MN 55409
$-1,272
Cash flow
-13.9%
Cash-on-Cash Return
3.1%
Cap rate
0.5%
Rent to Value Ratio
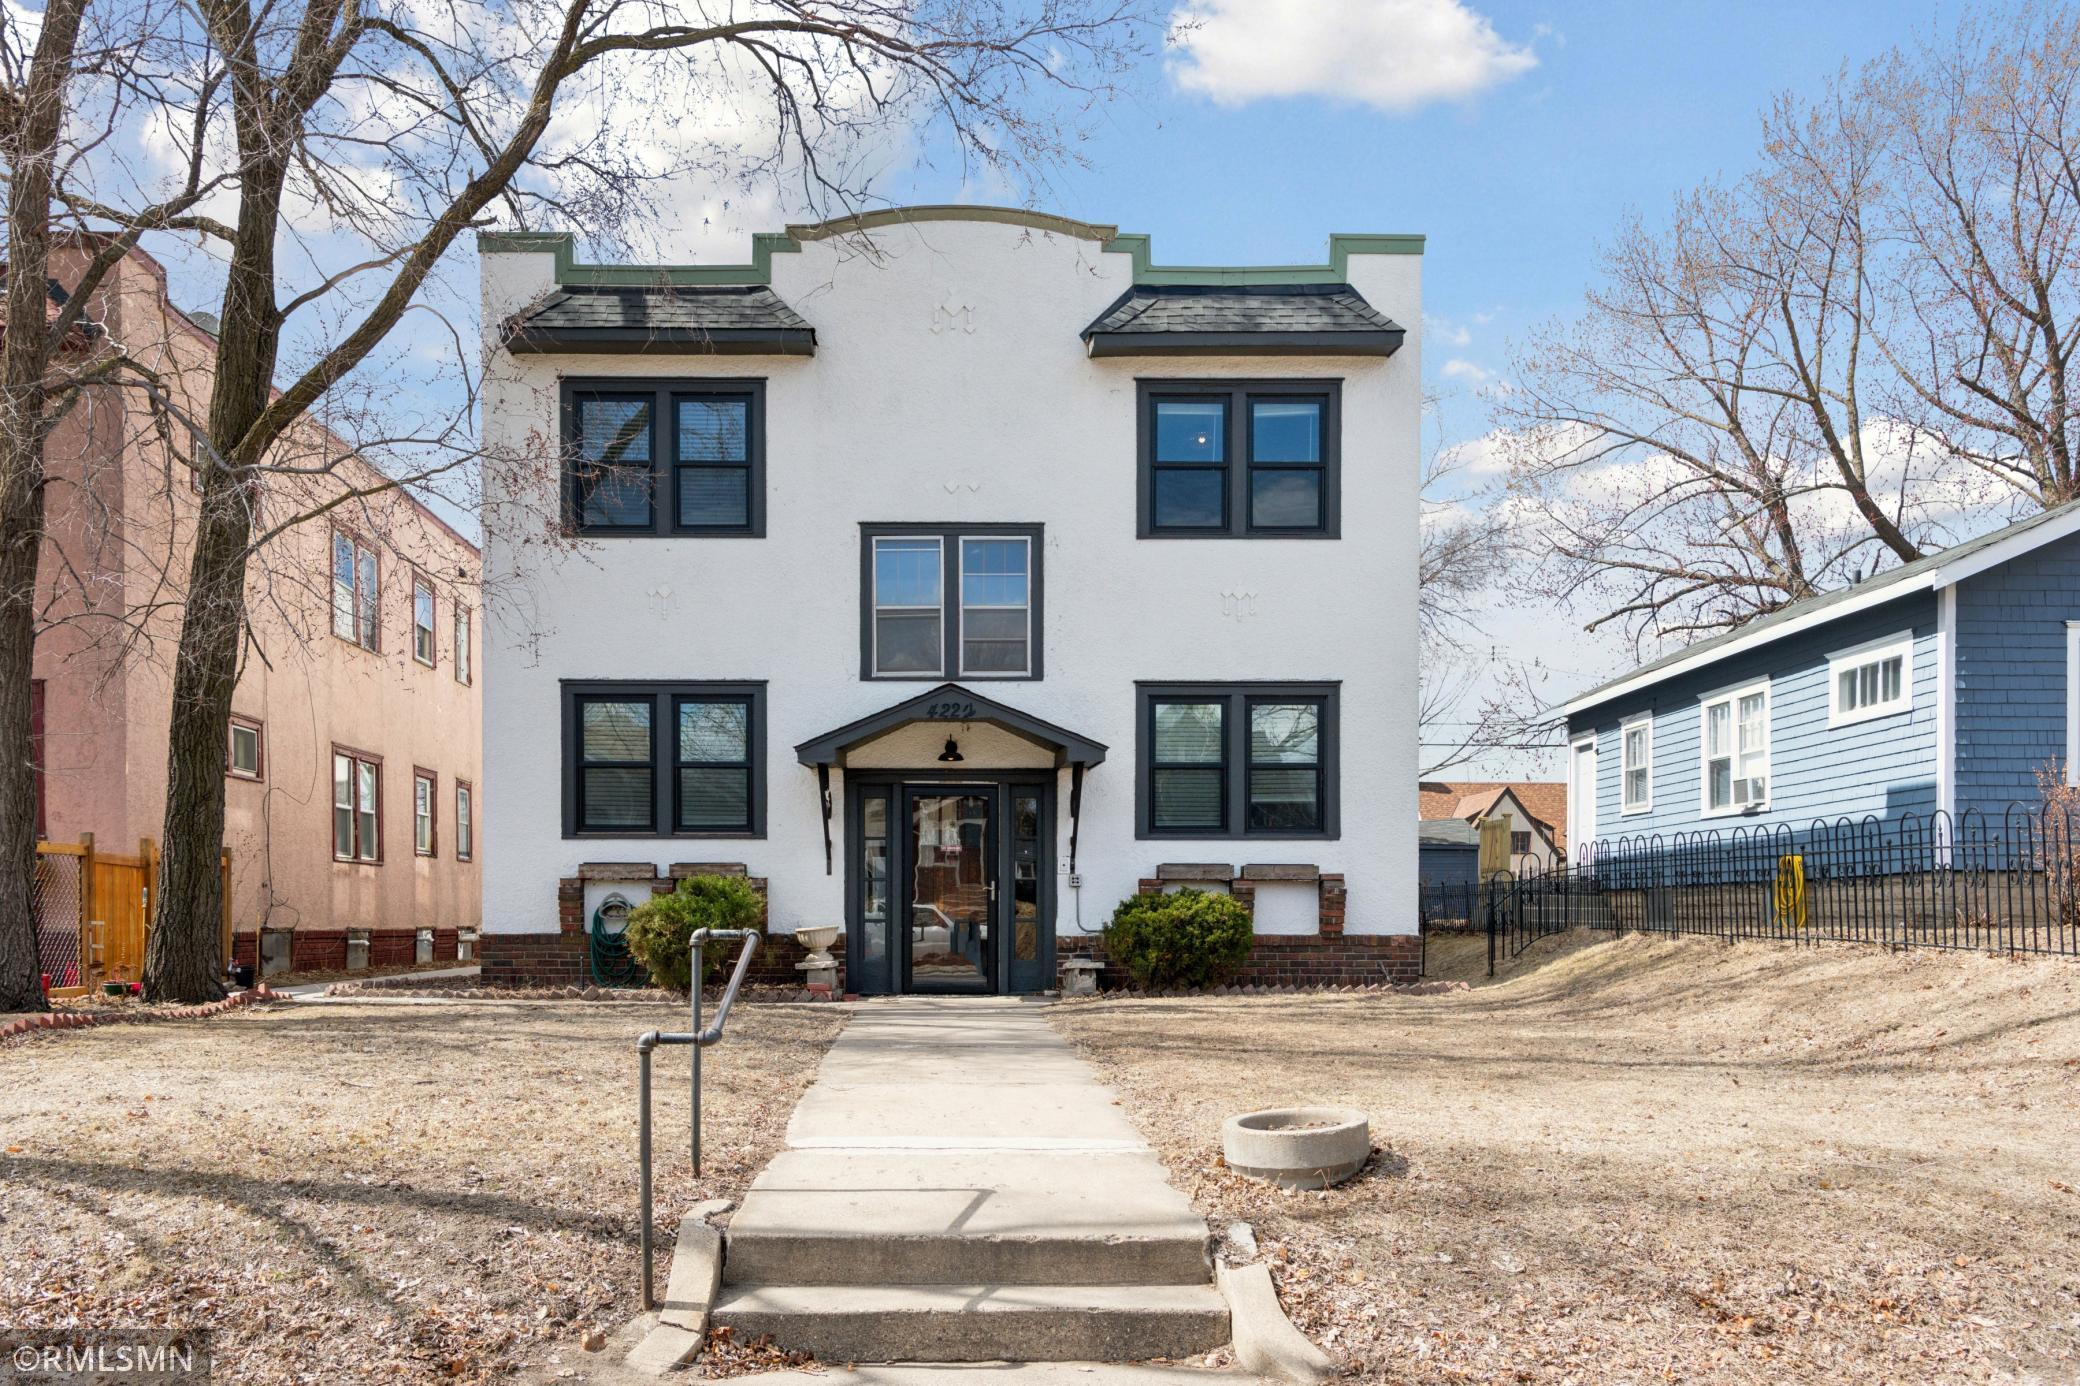
Active
$625,000
4
bds
|
4
ba
|
2,772
sqft
|
built
1927
4224 Cedar Ave S, Minneapolis, MN 55407
$-2,449
Cash flow
-20.4%
Cash-on-Cash Return
1.6%
Cap rate
0.4%
Rent to Value Ratio
Active
$719,000
5
bds
|
2
ba
|
3,108
sqft
|
built
1900
836 Thornton St SE, Minneapolis, MN 55414
$-2,657
Cash flow
-19.3%
Cash-on-Cash Return
1.9%
Cap rate
0.3%
Rent to Value Ratio
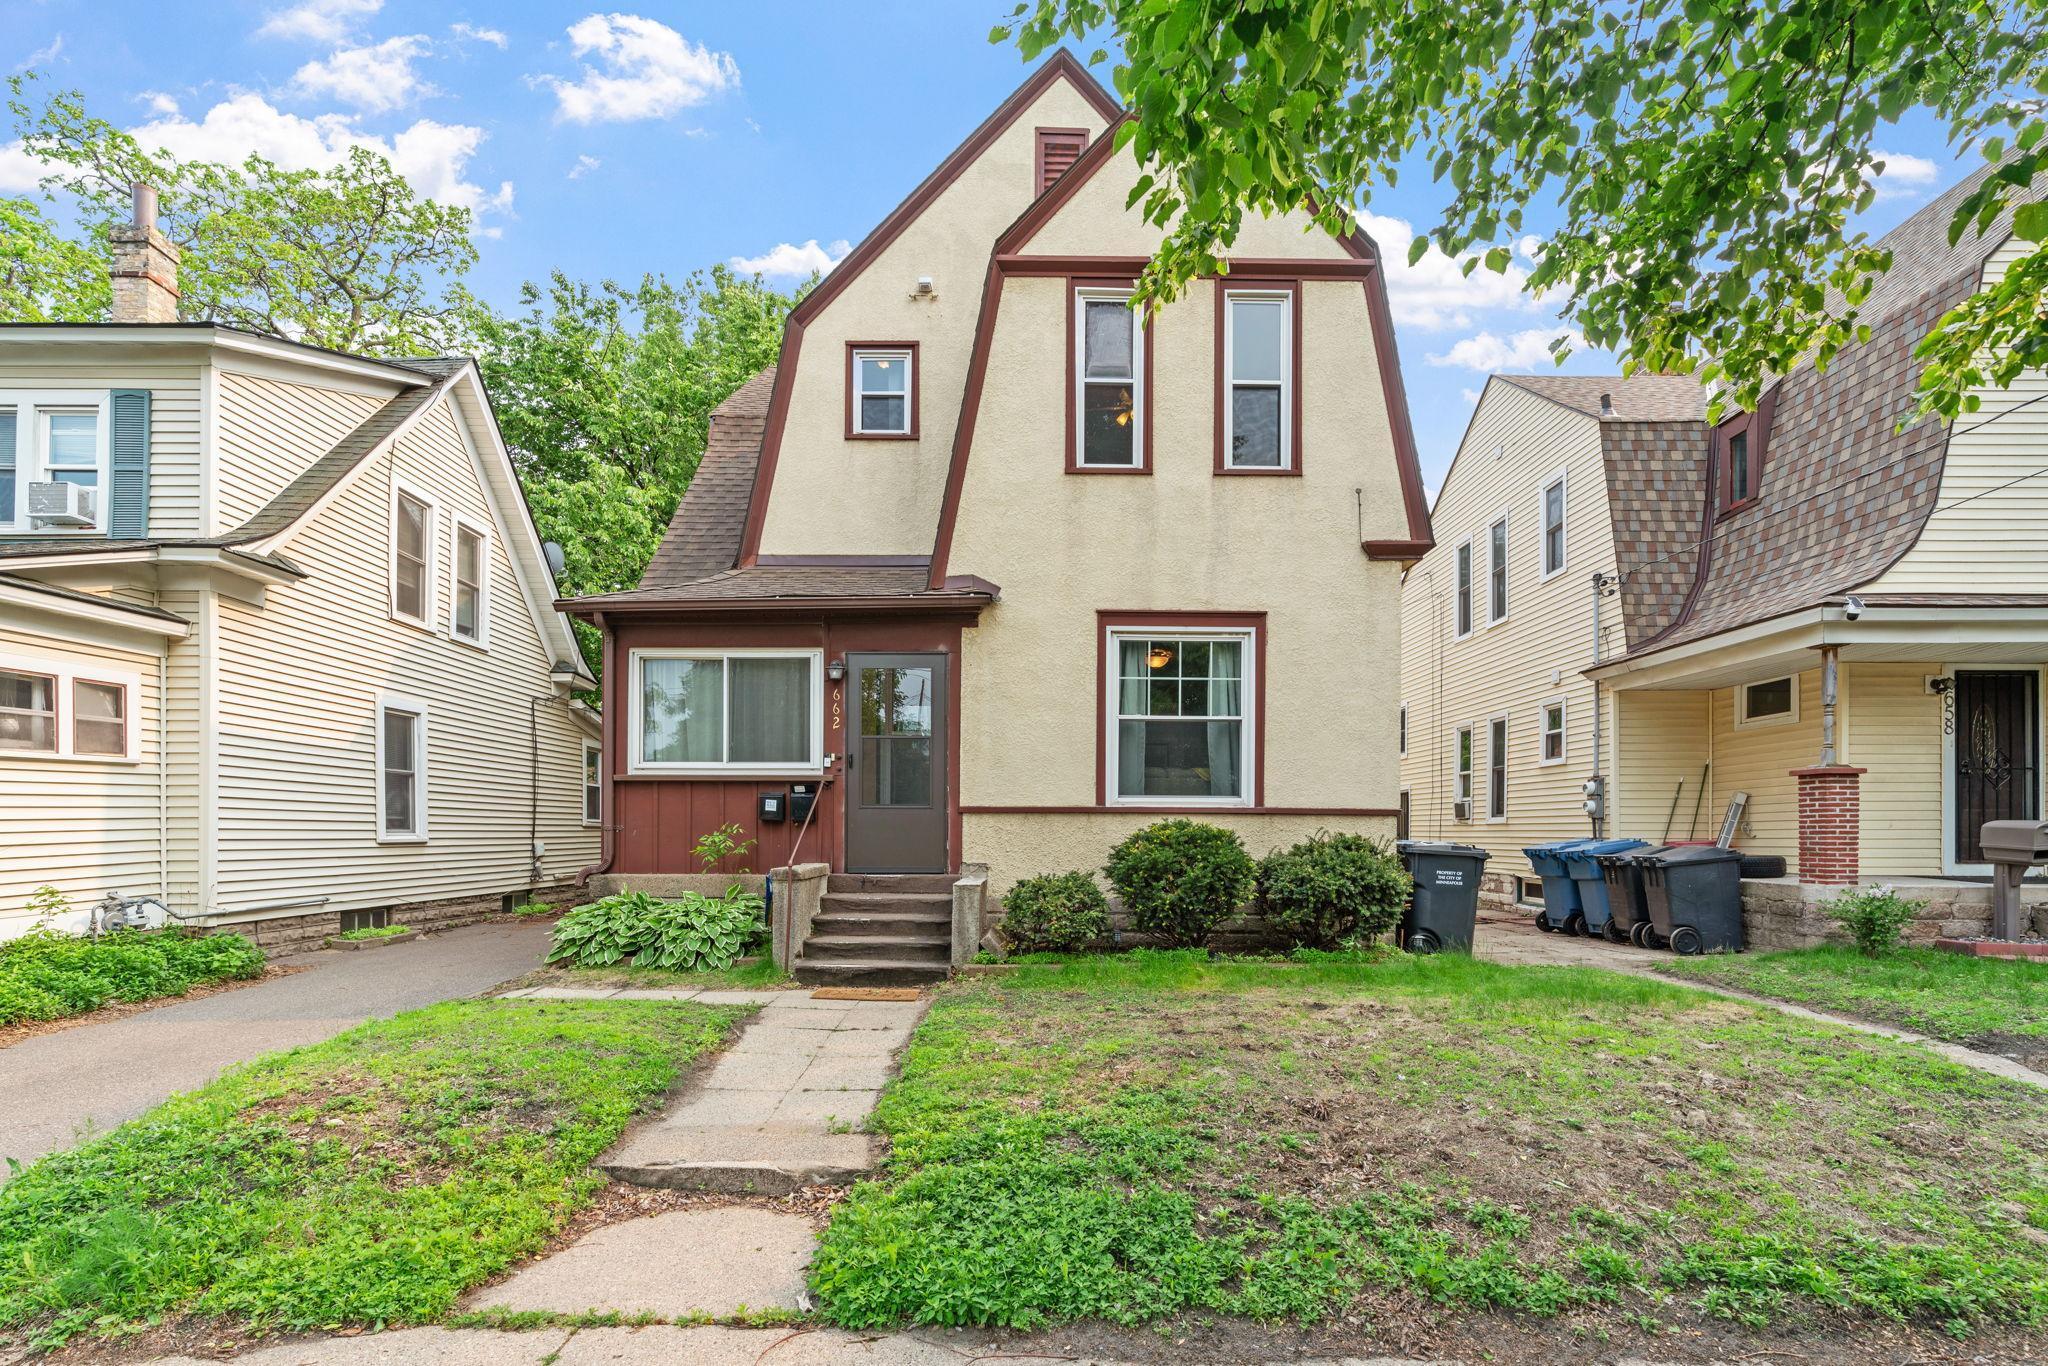
Active
$379,500
3
bds
|
2
ba
|
1,867
sqft
|
built
1900
662 24th Ave NE, Minneapolis, MN 55418
$-840
Cash flow
-11.5%
Cash-on-Cash Return
3.7%
Cap rate
0.6%
Rent to Value Ratio
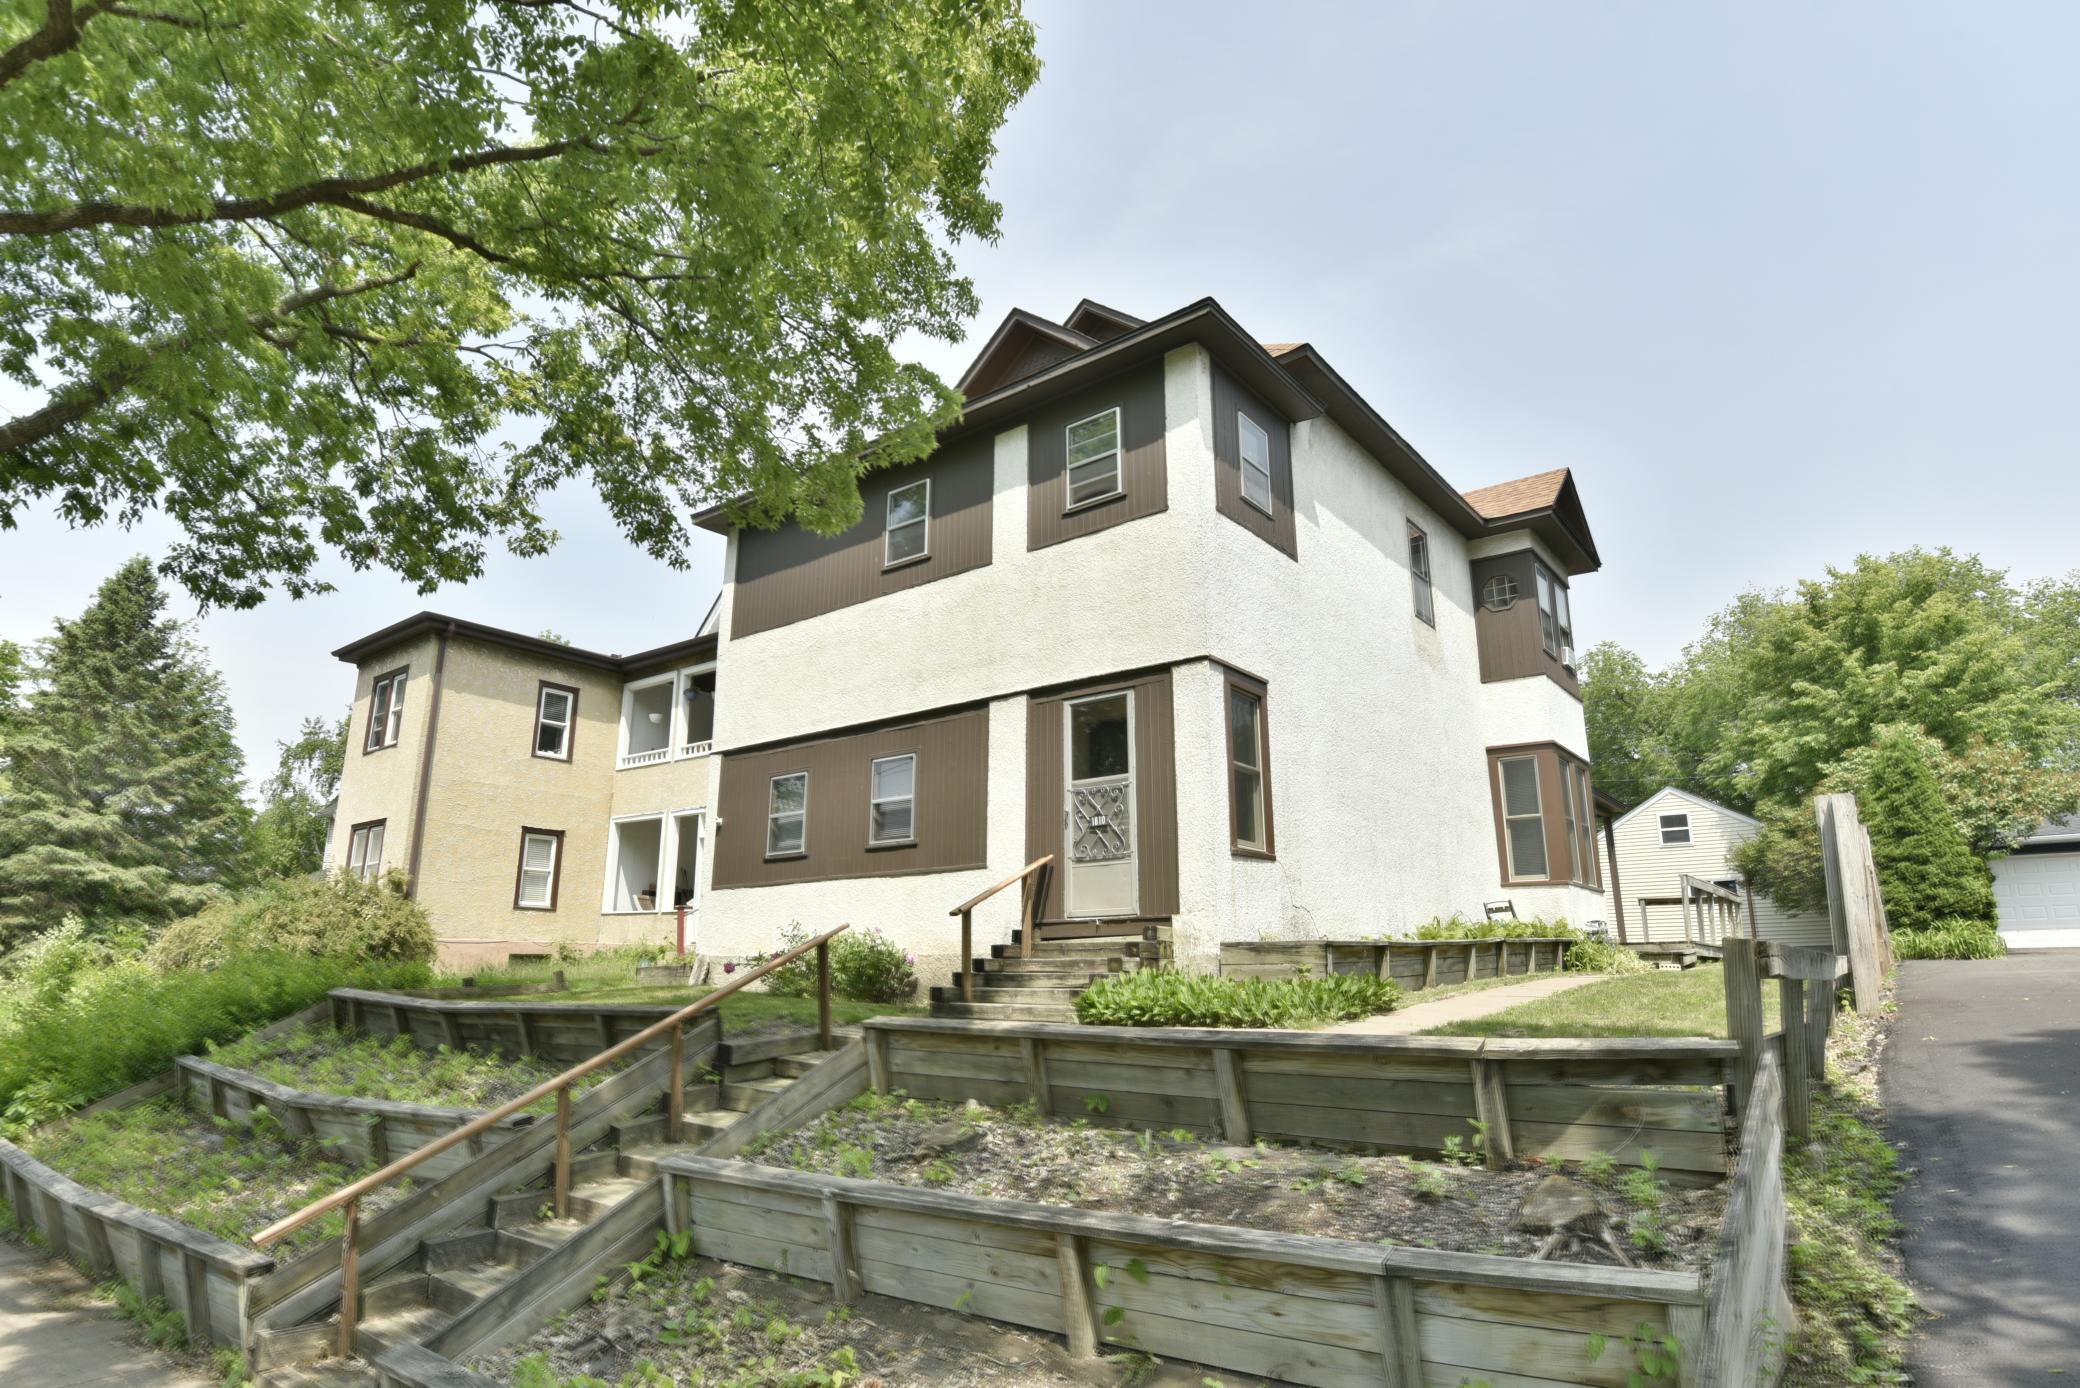
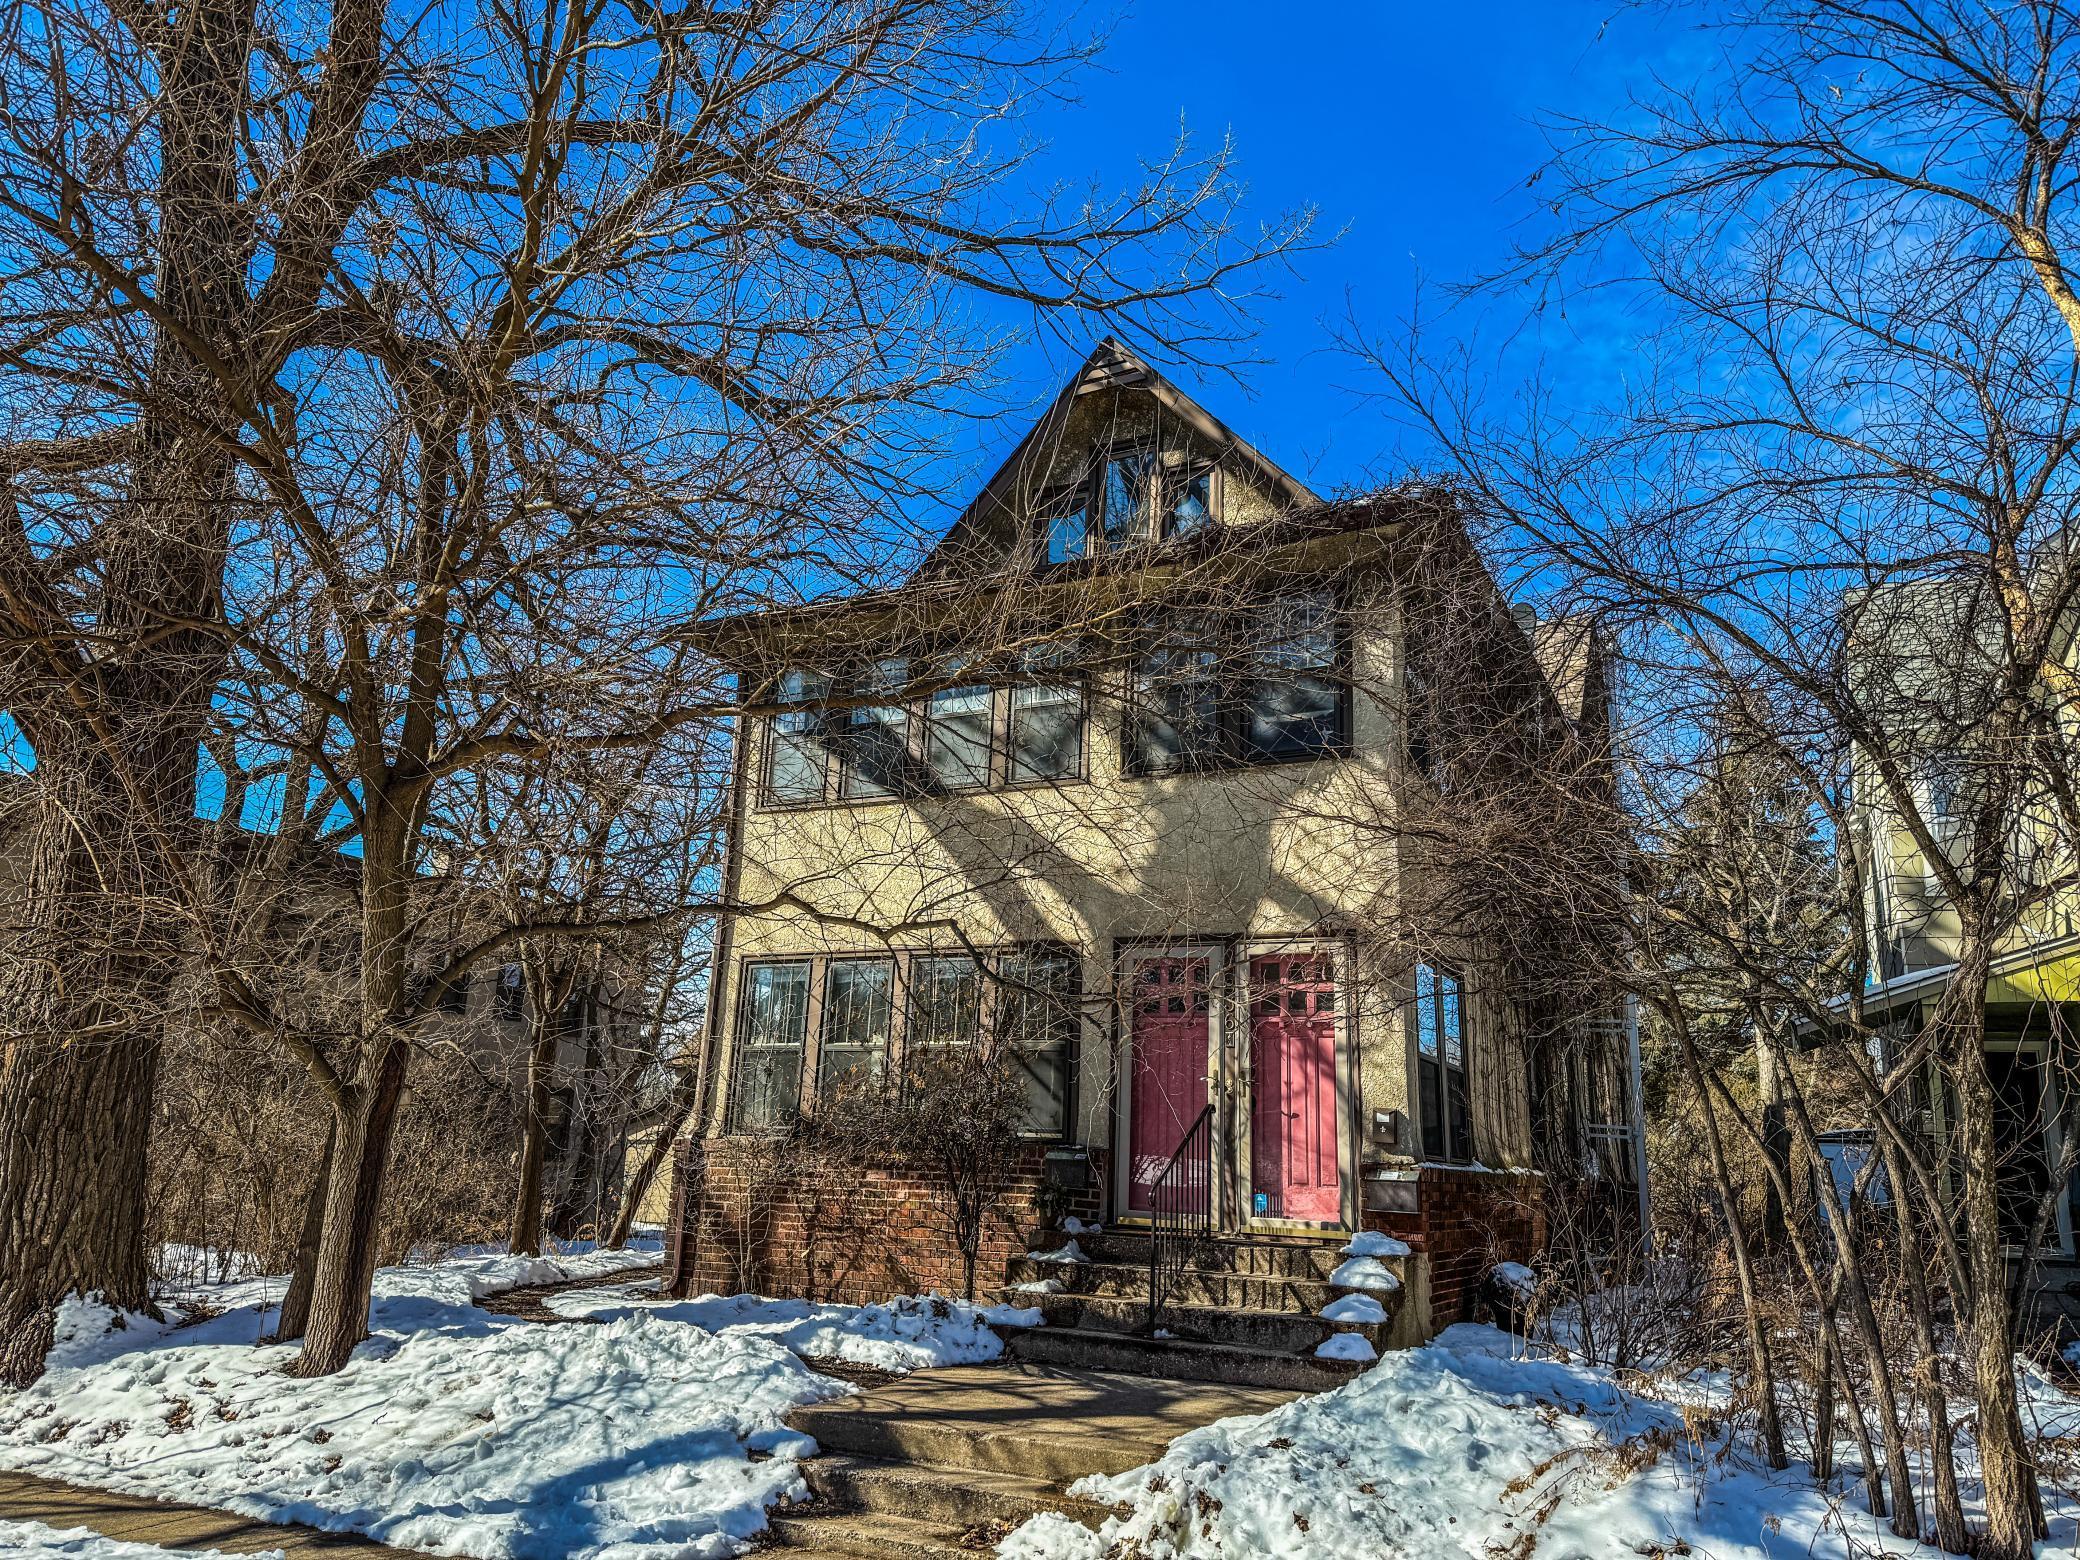
Active
$350,000
6
bds
|
2
ba
|
2,646
sqft
|
built
1854
1810 Chestnut Ave, Minneapolis, MN 55405
$-790
Cash flow
-11.8%
Cash-on-Cash Return
3.6%
Cap rate
0.6%
Rent to Value Ratio
Active
$859,000
5
bds
|
4
ba
|
6,723
sqft
|
built
1958
4922 Sheridan Ave S, Minneapolis, MN 55410
$-3,712
Cash flow
-22.5%
Cash-on-Cash Return
1.1%
Cap rate
0.3%
Rent to Value Ratio

Active
$499,900
4
bds
|
3
ba
|
2,724
sqft
|
built
1900
2813 Garfield Ave, Minneapolis, MN 55408
$-1,491
Cash flow
-15.6%
Cash-on-Cash Return
2.7%
Cap rate
0.5%
Rent to Value Ratio
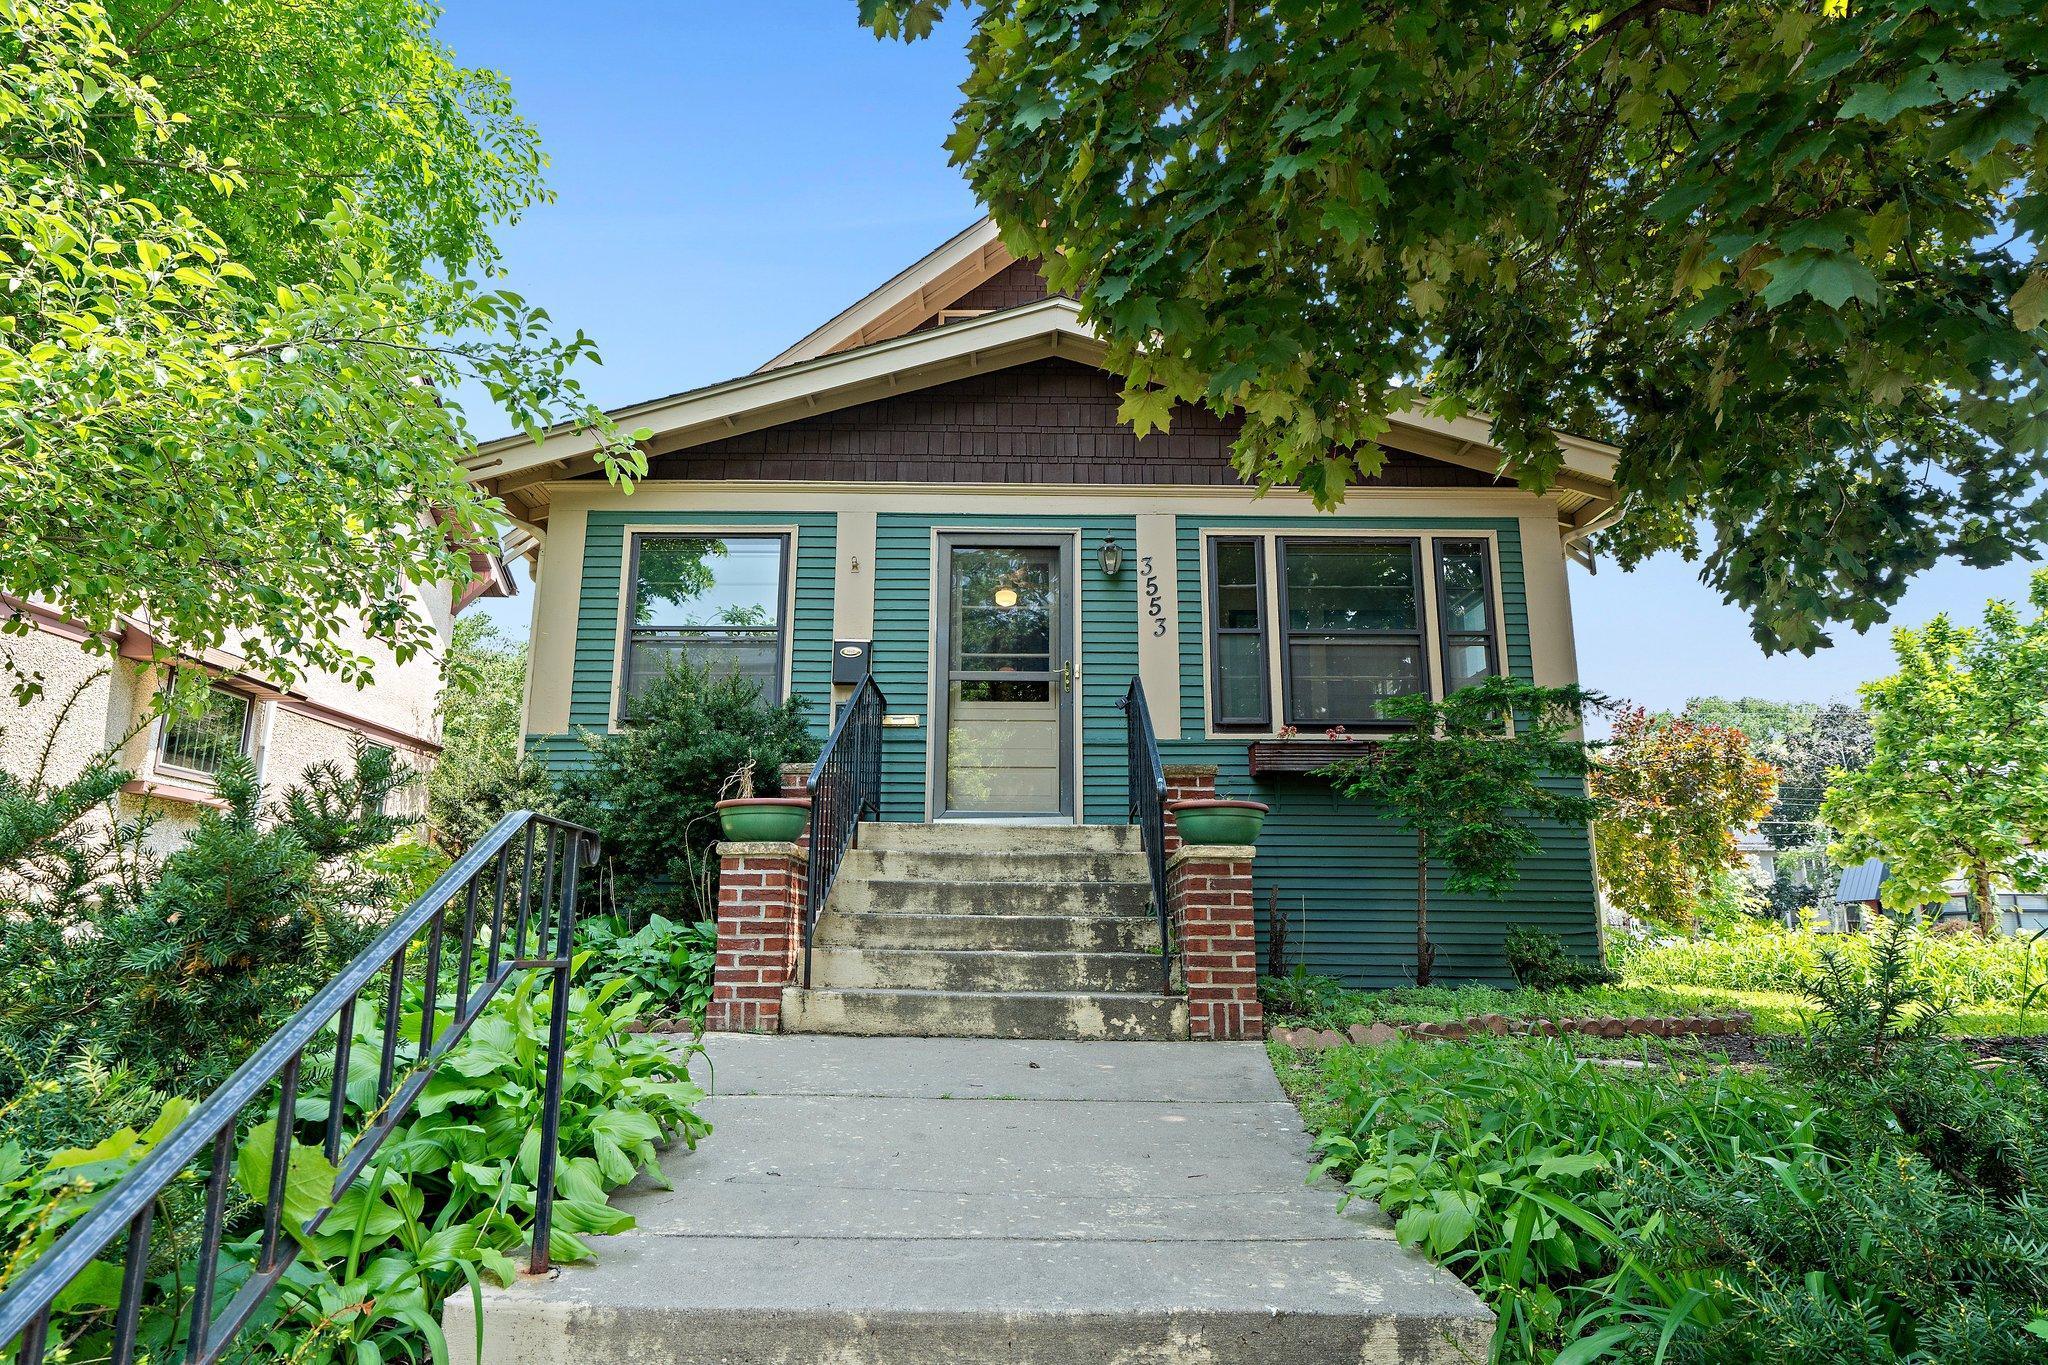
Active
$427,500
4
bds
|
3
ba
|
2,316
sqft
|
built
1913
3553 Dupont Ave S, Minneapolis, MN 55408
$-1,296
Cash flow
-15.8%
Cash-on-Cash Return
2.7%
Cap rate
0.5%
Rent to Value Ratio
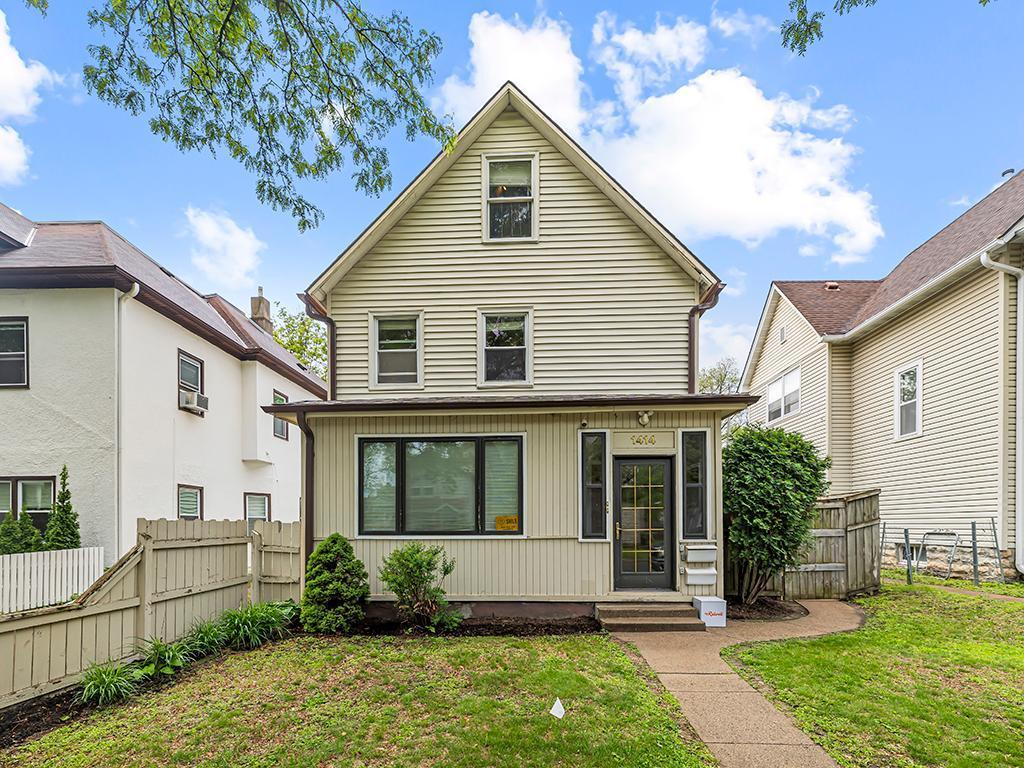
Active
$475,000
6
bds
|
3
ba
|
3,203
sqft
|
built
1900
1414 Grand St NE, Minneapolis, MN 55413
$-841
Cash flow
-9.2%
Cash-on-Cash Return
4.2%
Cap rate
0.7%
Rent to Value Ratio
Active
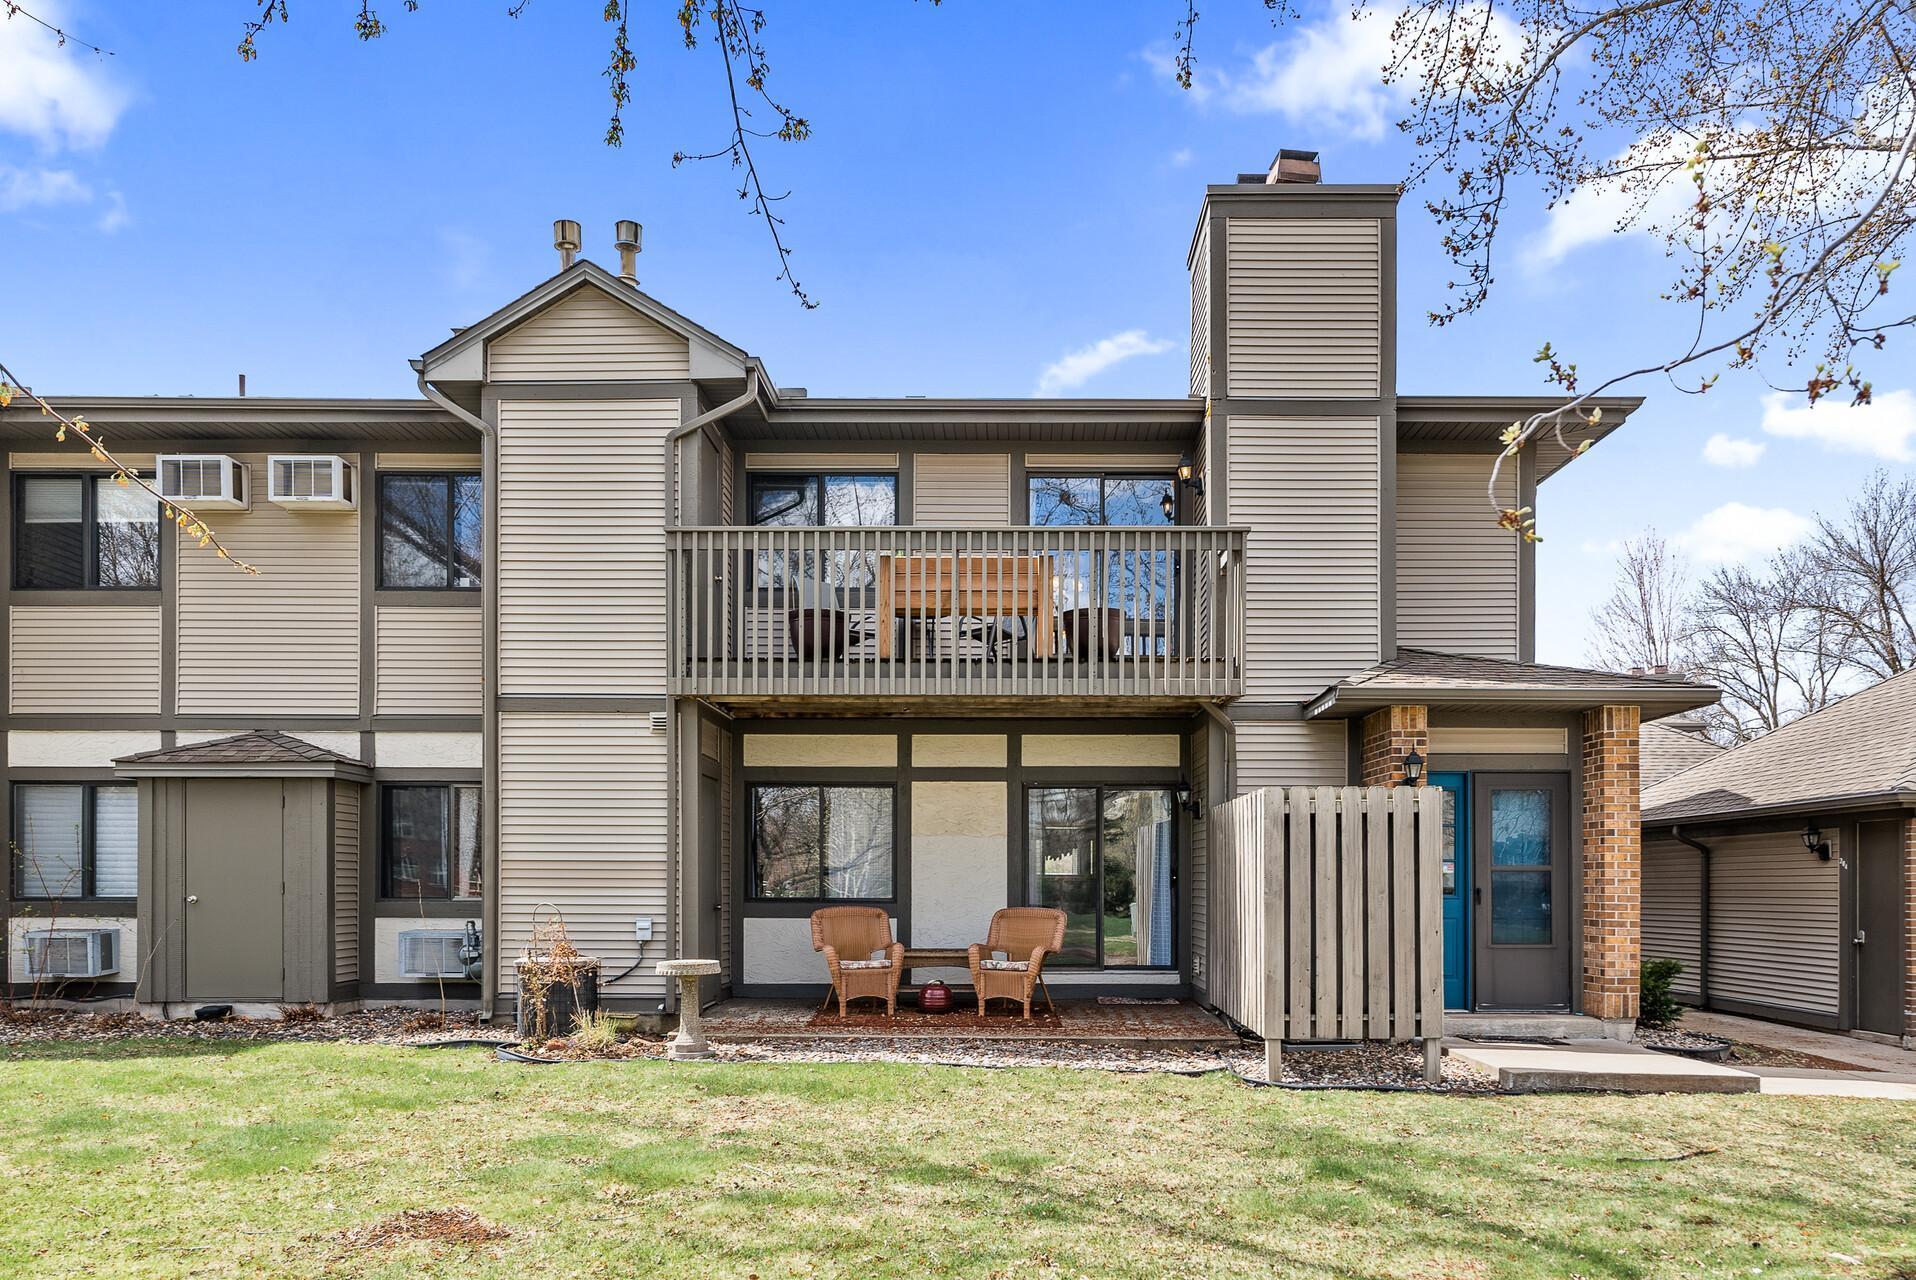
$260,000
2
bds
|
2
ba
|
1,248
sqft
|
built
1977
4441 Cedar Lake Rd S, Minneapolis, MN 55416
$-716
Cash flow
-14.4%
Cash-on-Cash Return
3.0%
Cap rate
0.8%
Rent to Value Ratio

Active
$320,000
4
bds
|
2
ba
|
1,960
sqft
|
built
1900
2909 13th Ave S, Minneapolis, MN 55407
$-1,018
Cash flow
-16.6%
Cash-on-Cash Return
2.5%
Cap rate
0.6%
Rent to Value Ratio
Active
$850,000
3
bds
|
4
ba
|
2,178
sqft
|
built
2000
13 4th Ave N, Minneapolis, MN 55401
$-3,569
Cash flow
-21.9%
Cash-on-Cash Return
1.3%
Cap rate
0.4%
Rent to Value Ratio
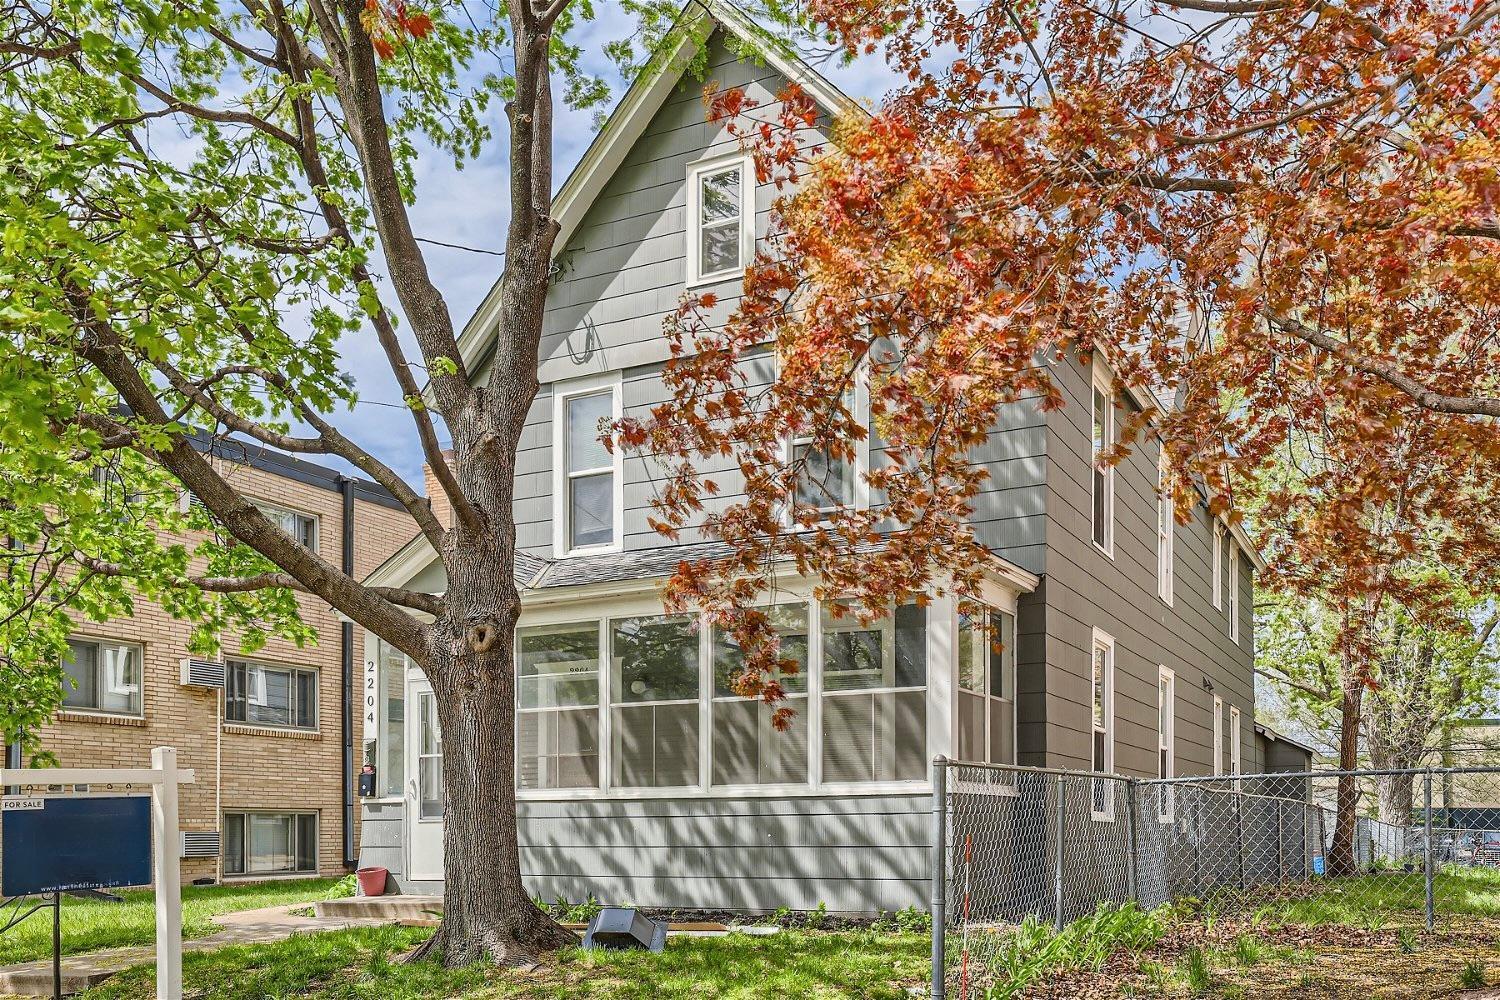
Active
$435,000
5
bds
|
2
ba
|
2,164
sqft
|
built
1900
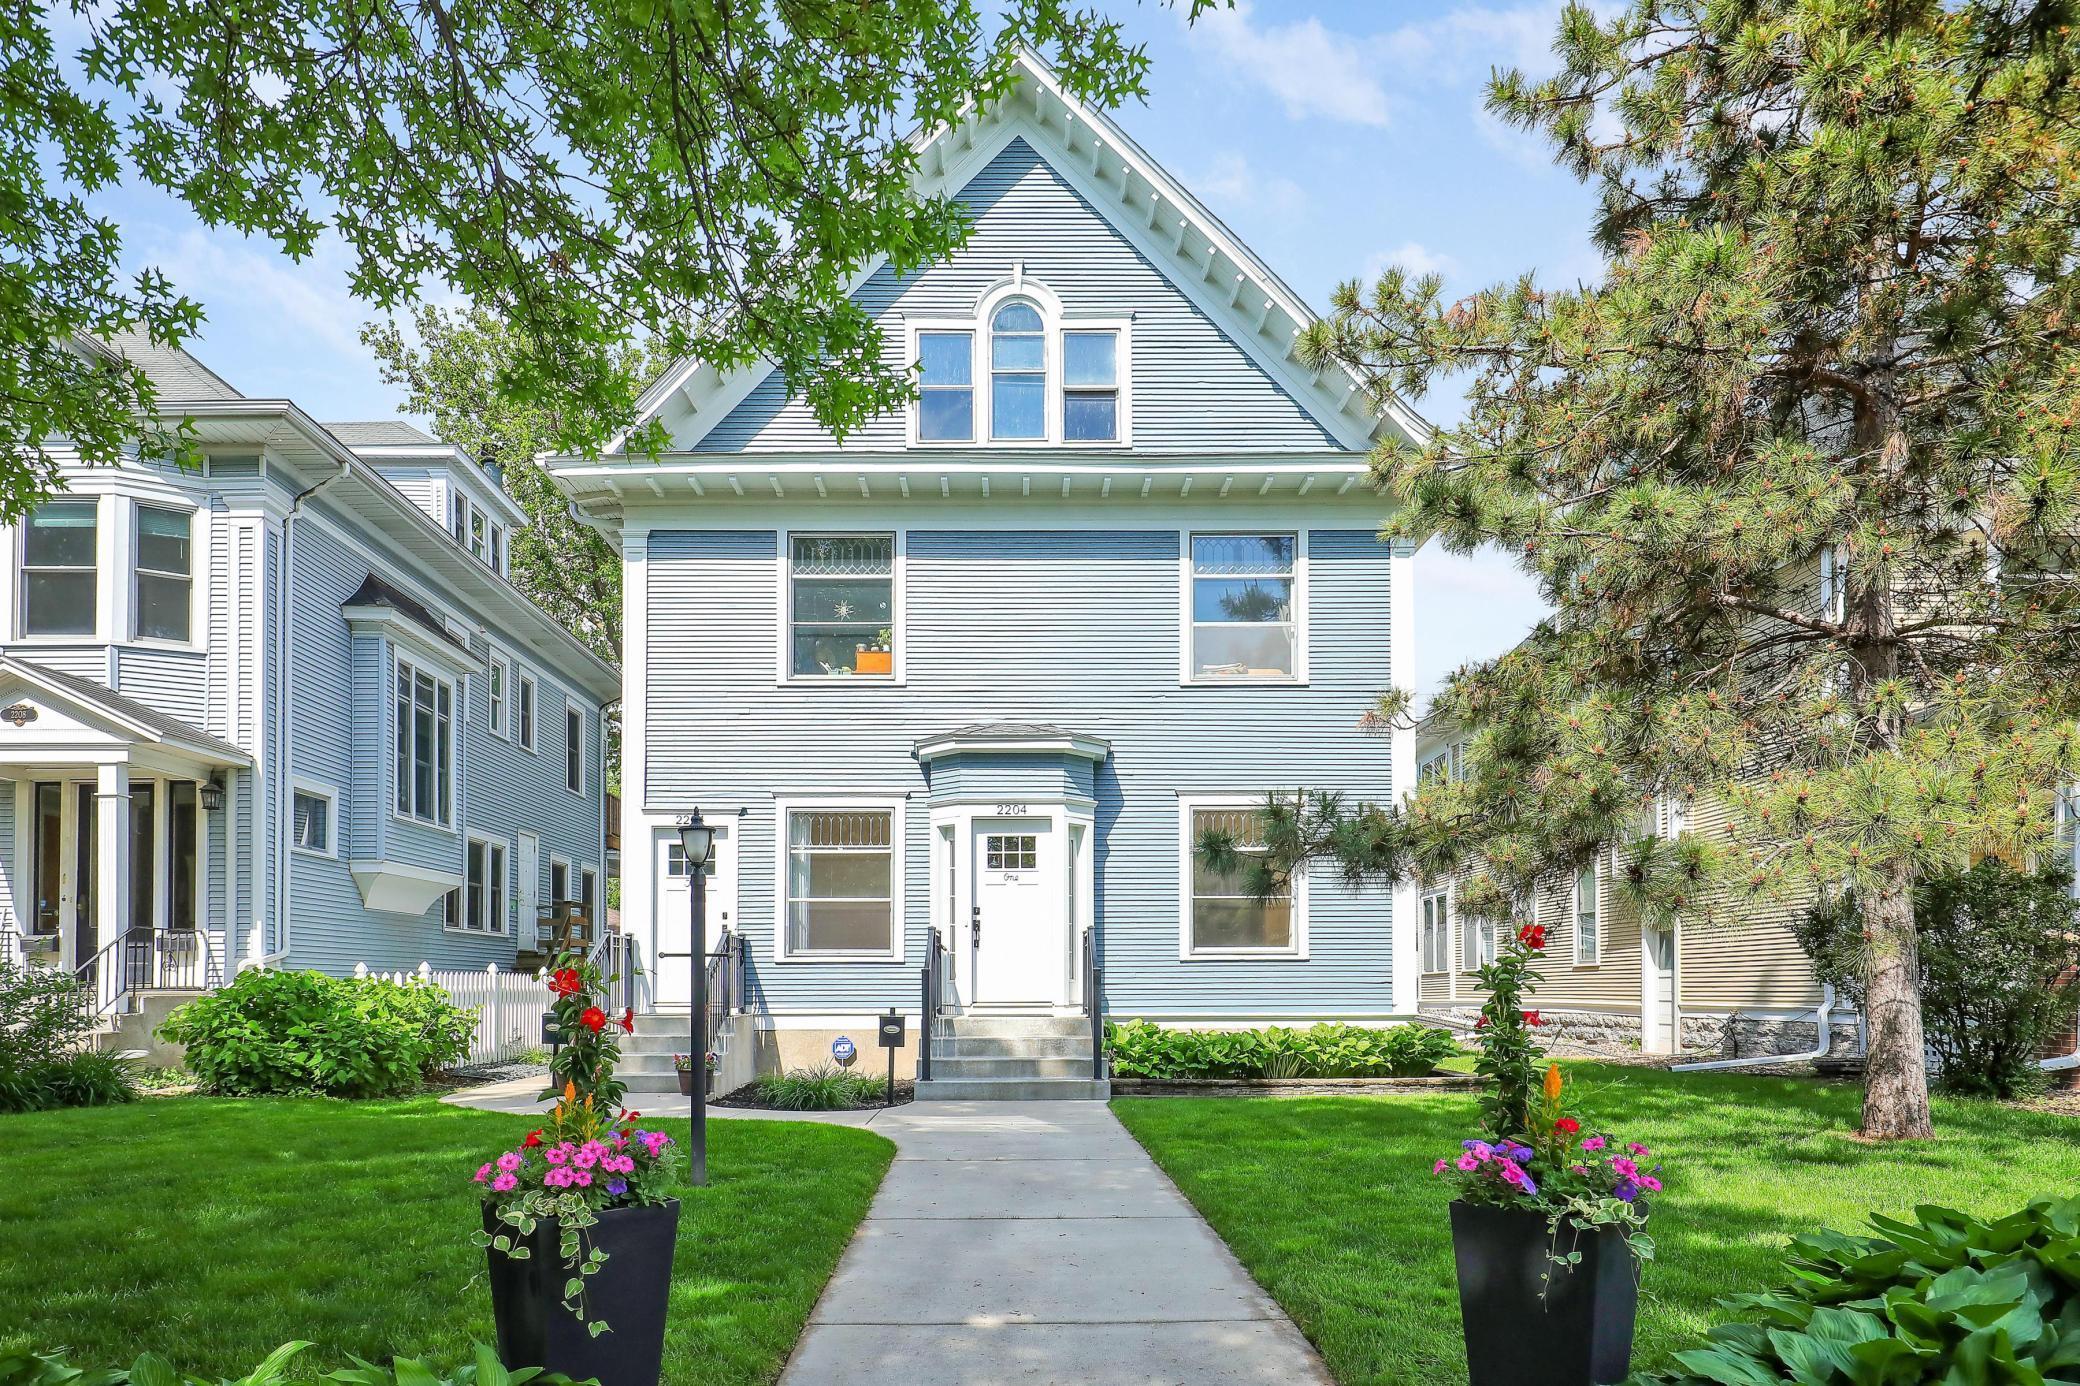
2204 2nd St NE, Minneapolis, MN 55418
$-1,121
Cash flow
-13.4%
Cash-on-Cash Return
3.2%
Cap rate
0.6%
Rent to Value Ratio
Active
$439,900
4
bds
|
2
ba
|
1,980
sqft
|
built
1936
5044 Bloomington Ave, Minneapolis, MN 55417
$-1,174
Cash flow
-13.9%
Cash-on-Cash Return
3.1%
Cap rate
0.6%
Rent to Value Ratio
Active
$259,900
2
bds
|
3
ba
|
1,992
sqft
|
built
1996
10946 Johnson St NE, Minneapolis, MN 55434
$-420
Cash flow
-8.4%
Cash-on-Cash Return
4.4%
Cap rate
0.8%
Rent to Value Ratio
Active
$629,900
12
bds
|
4
ba
|
3,932
sqft
|
built
1919
3129 Garfield Ave, Minneapolis, MN 55408
$-2,796
Cash flow
-23.2%
Cash-on-Cash Return
1.0%
Cap rate
0.3%
Rent to Value Ratio
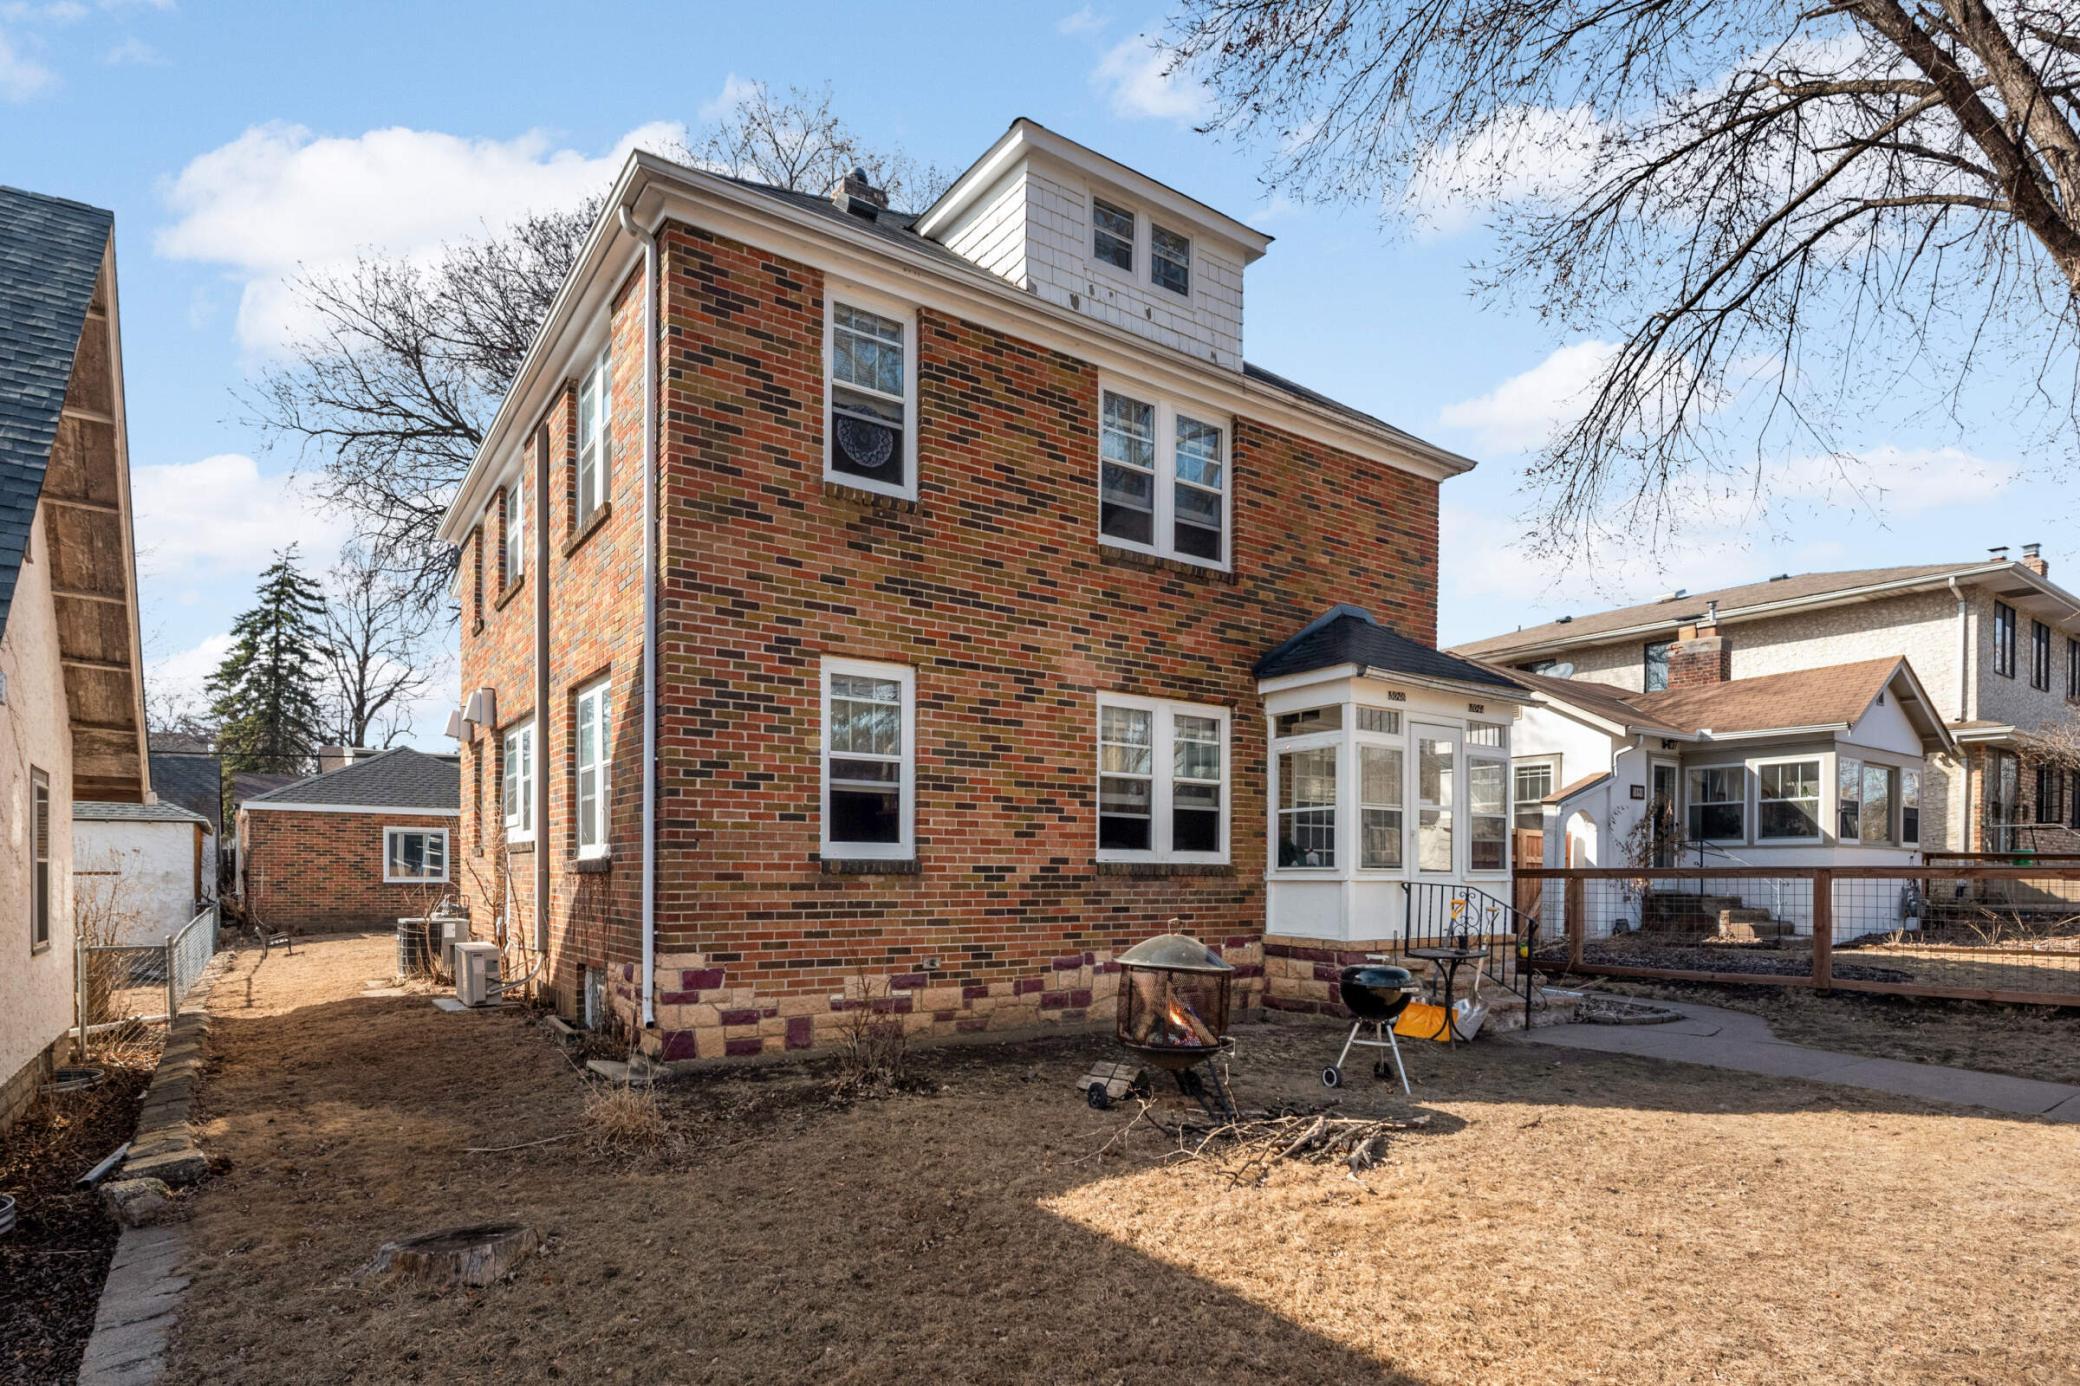
Active
$625,000
4
bds
|
2
ba
|
2,698
sqft
|
built
1905
2204 Girard Ave S, Minneapolis, MN 55405
$-2,399
Cash flow
-20.0%
Cash-on-Cash Return
1.7%
Cap rate
0.4%
Rent to Value Ratio
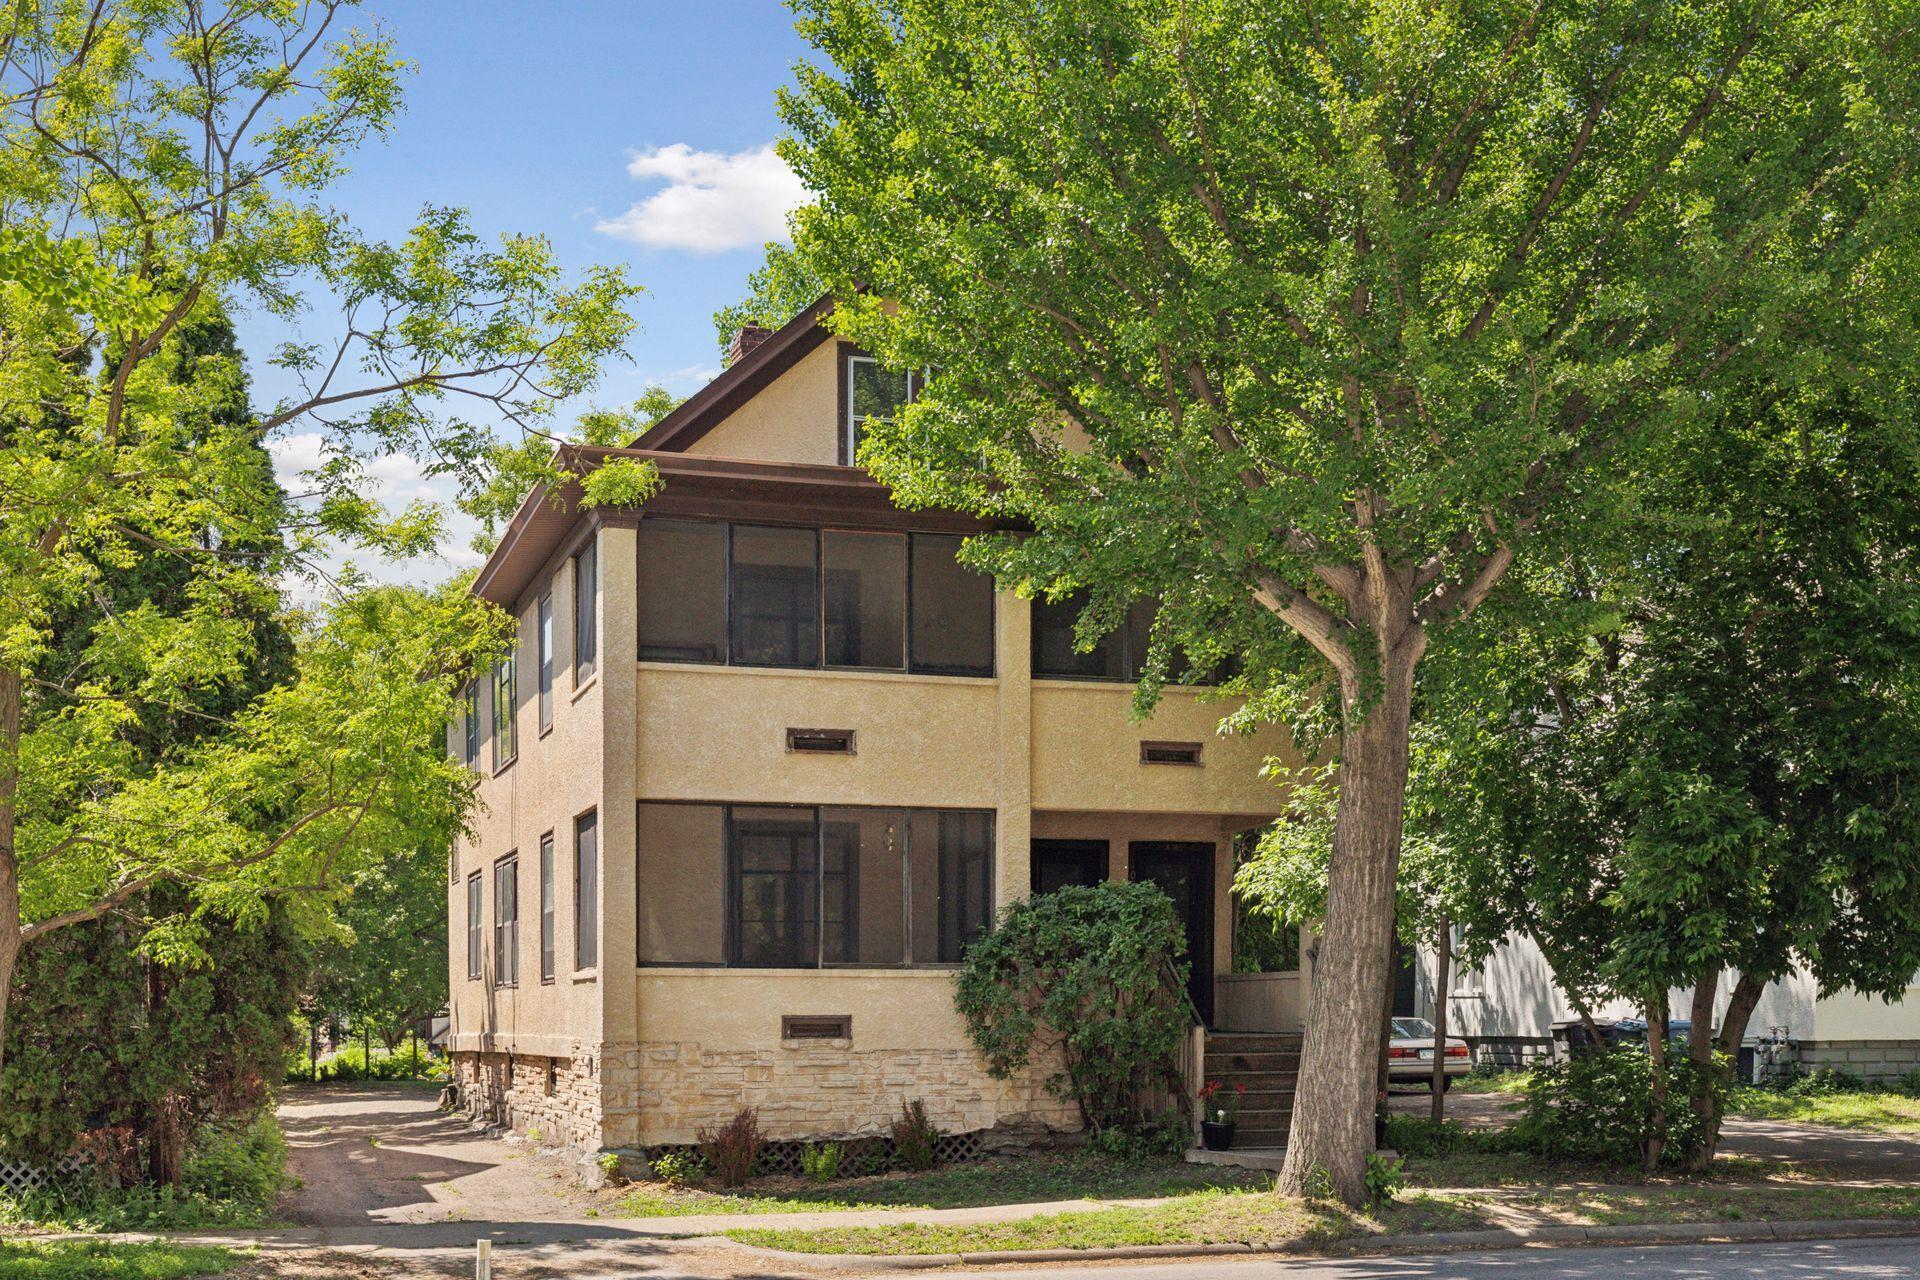
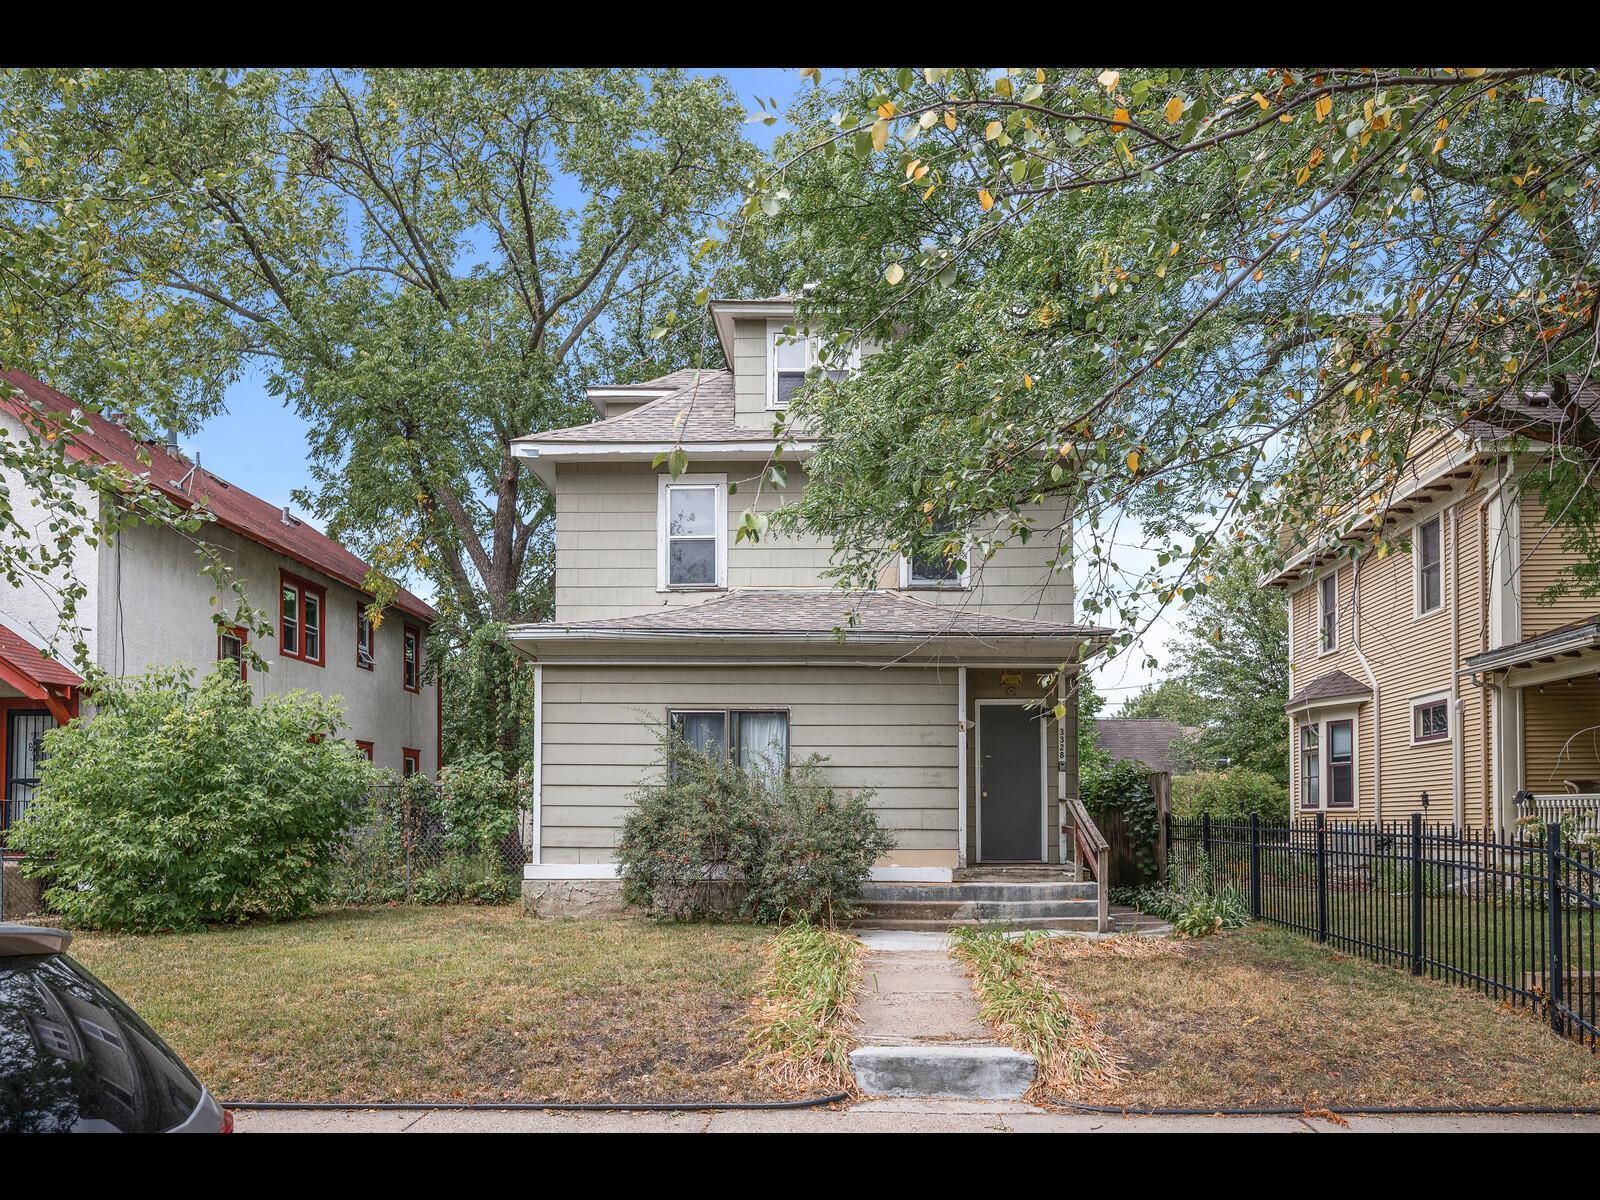
Active
$275,000
4
bds
|
2
ba
|
2,084
sqft
|
built
1920
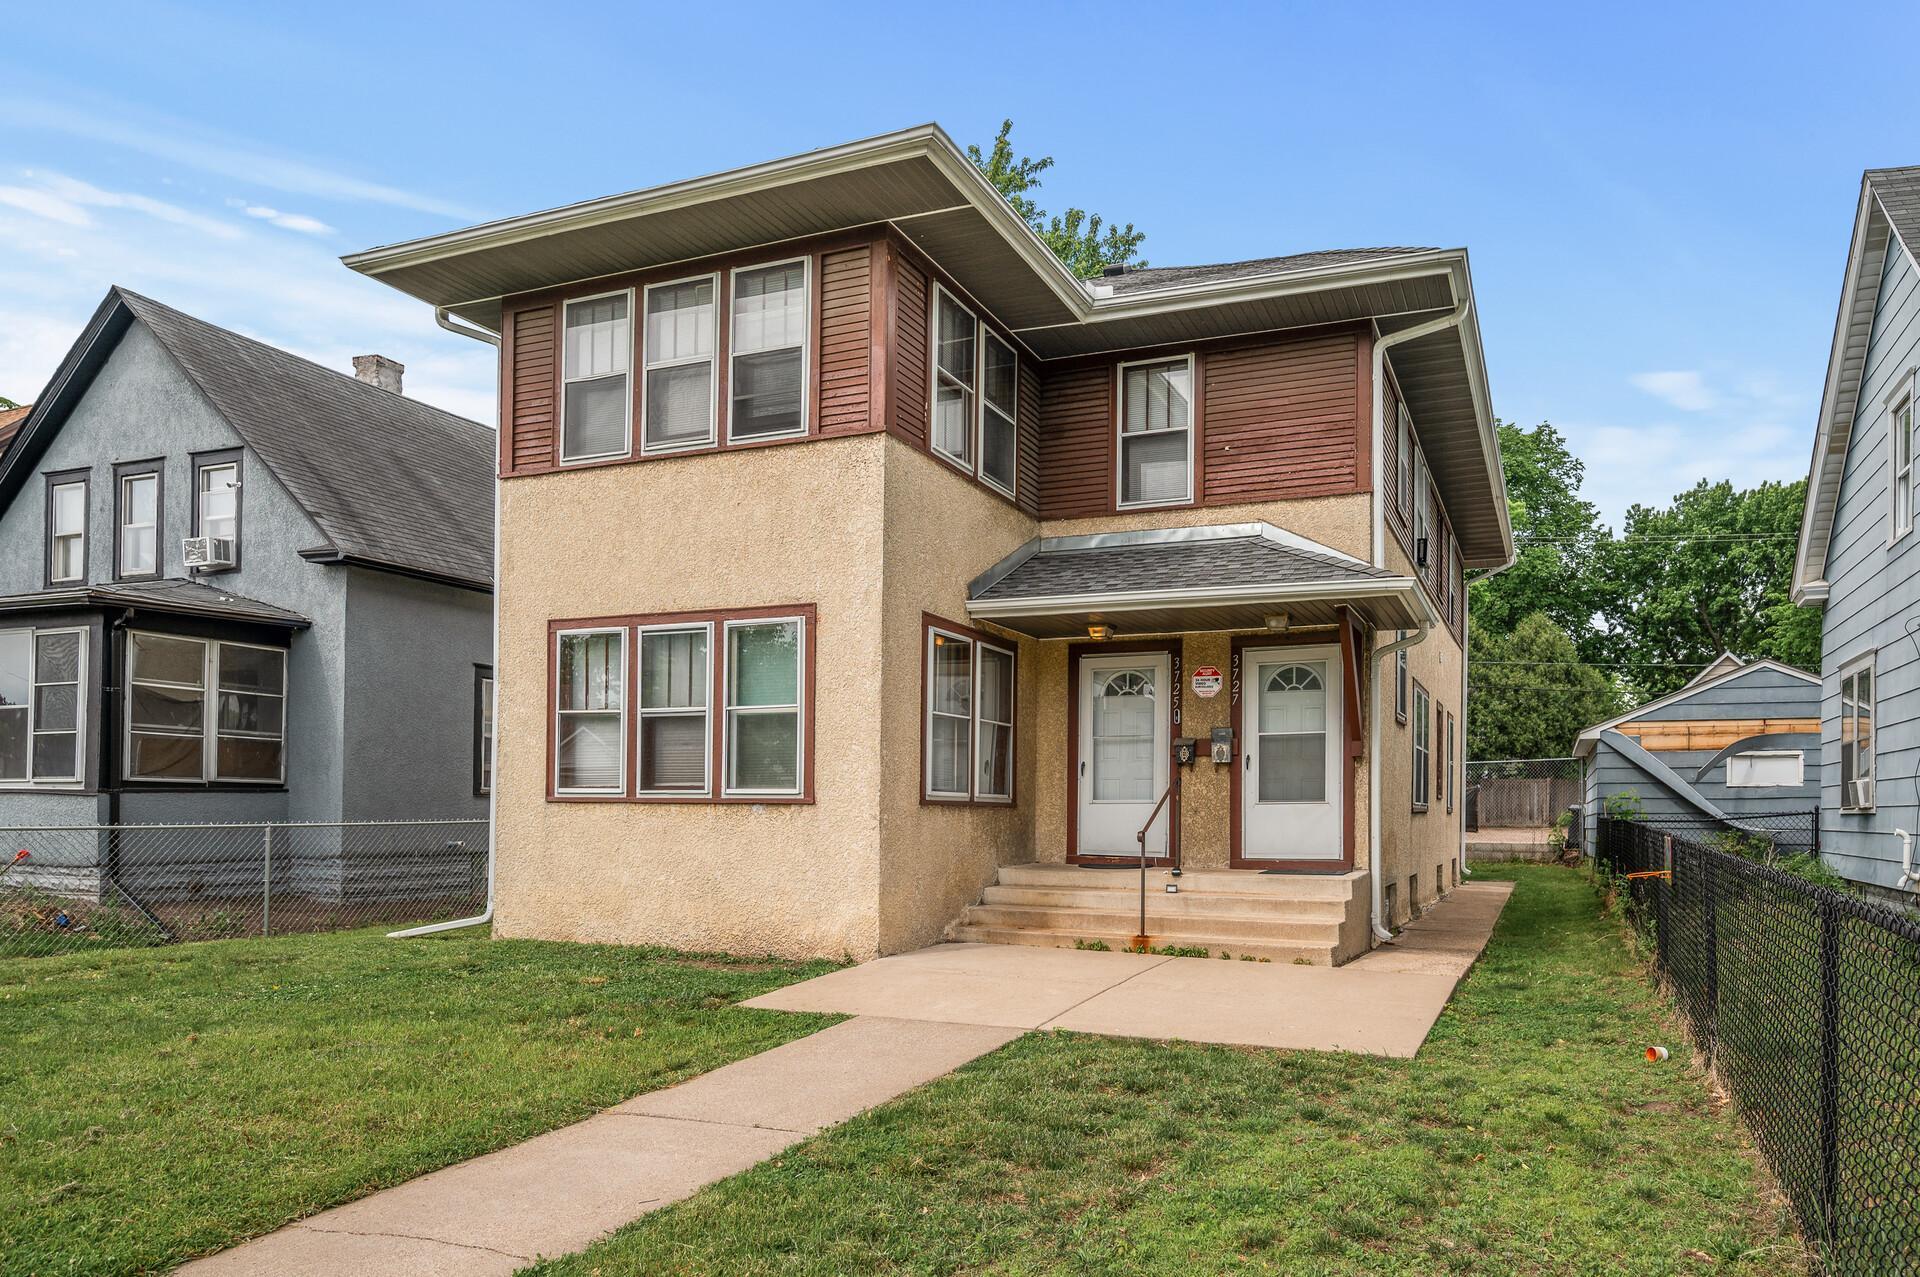
3725 Fremont Ave N, Minneapolis, MN 55412
$-479
Cash flow
-9.1%
Cash-on-Cash Return
4.2%
Cap rate
0.7%
Rent to Value Ratio
Active
$389,900
5
bds
|
2
ba
|
2,480
sqft
|
built
1913
1722 James Ave N, Minneapolis, MN 55411
$-1,010
Cash flow
-13.5%
Cash-on-Cash Return
3.2%
Cap rate
0.5%
Rent to Value Ratio
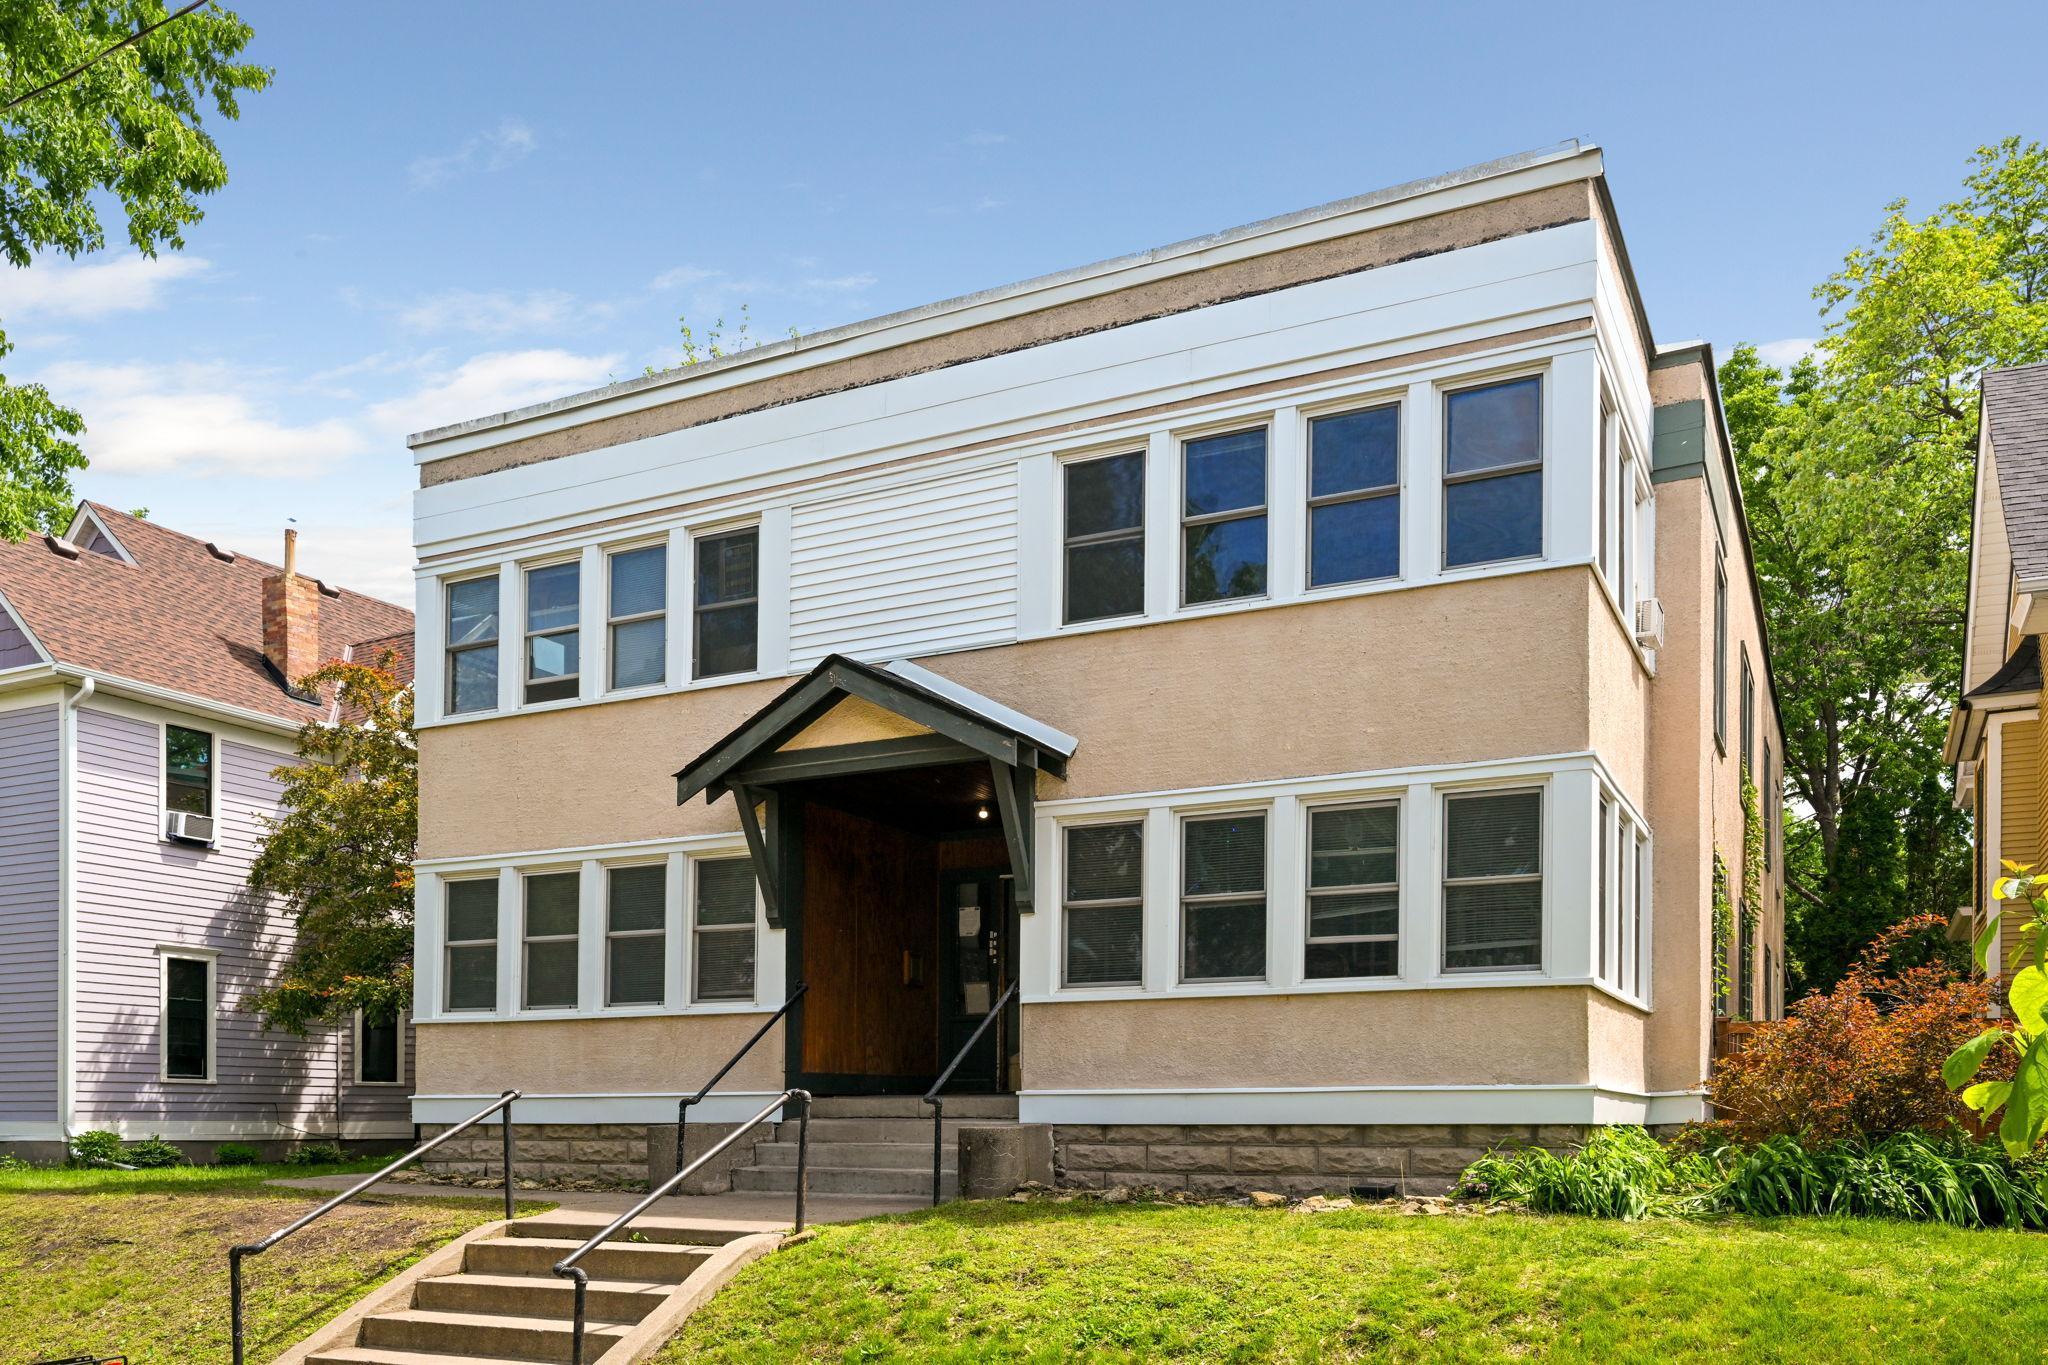
Active
$1,495,000
8
bds
|
5
ba
|
6,599
sqft
|
built
1922
1625 W 25th St, Minneapolis, MN 55405
$-6,749
Cash flow
-23.6%
Cash-on-Cash Return
0.9%
Cap rate
0.3%
Rent to Value Ratio
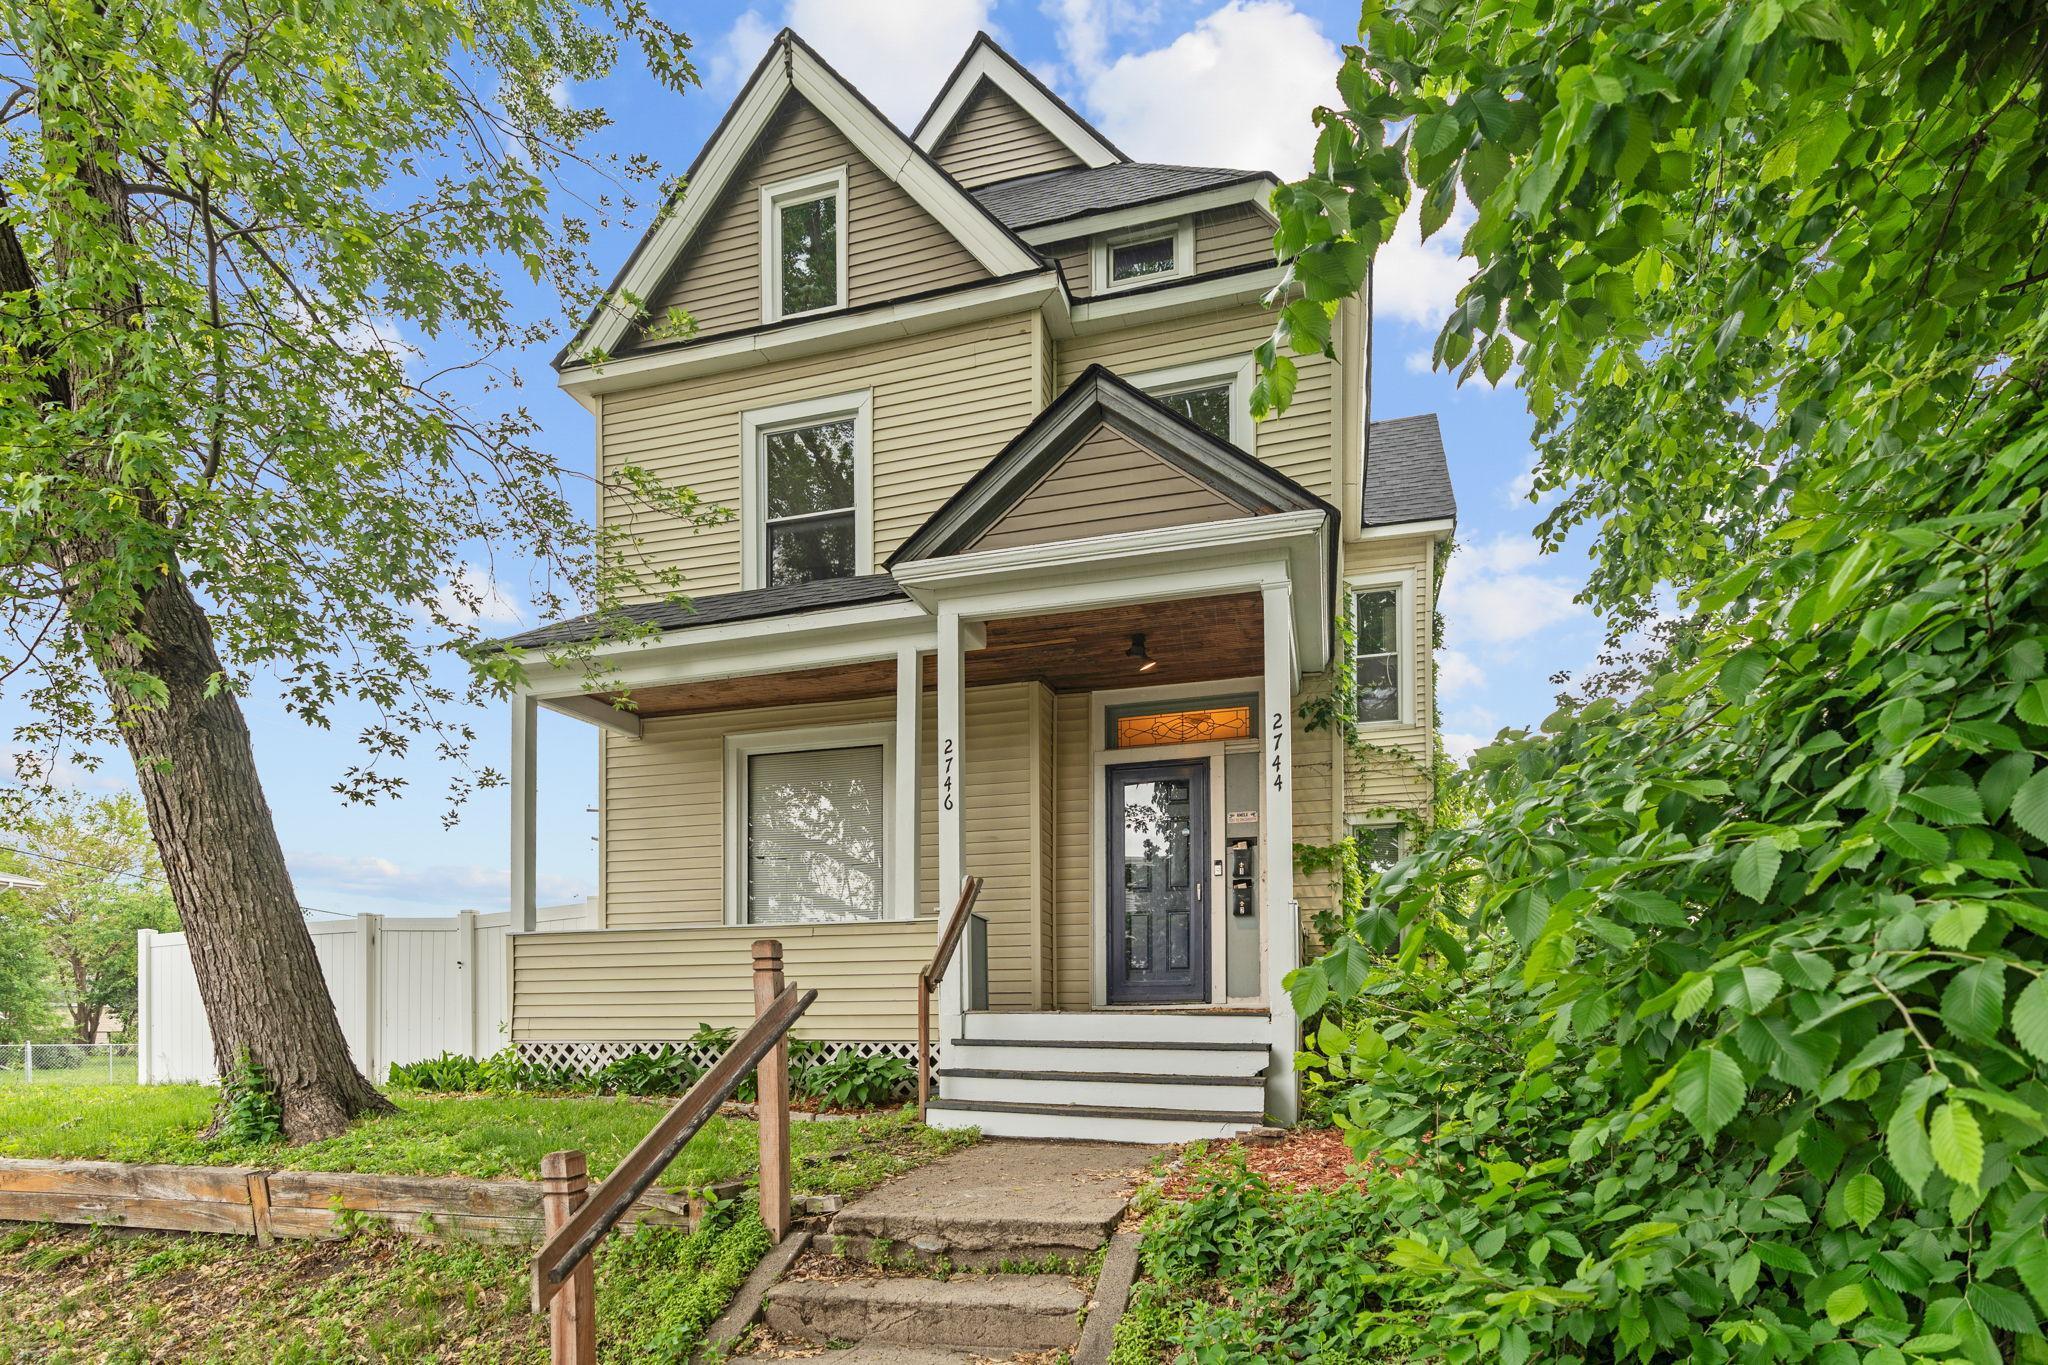
Active
$514,900
6
bds
|
4
ba
|
3,100
sqft
|
built
1900
2744 Stevens Ave, Minneapolis, MN 55408
$-1,640
Cash flow
-16.6%
Cash-on-Cash Return
2.5%
Cap rate
0.5%
Rent to Value Ratio
Active
$289,000
4
bds
|
2
ba
|
3,464
sqft
|
built
1966
3653 Dupont Ave N, Minneapolis, MN 55412
$-1,283
Cash flow
-23.2%
Cash-on-Cash Return
1.0%
Cap rate
0.7%
Rent to Value Ratio
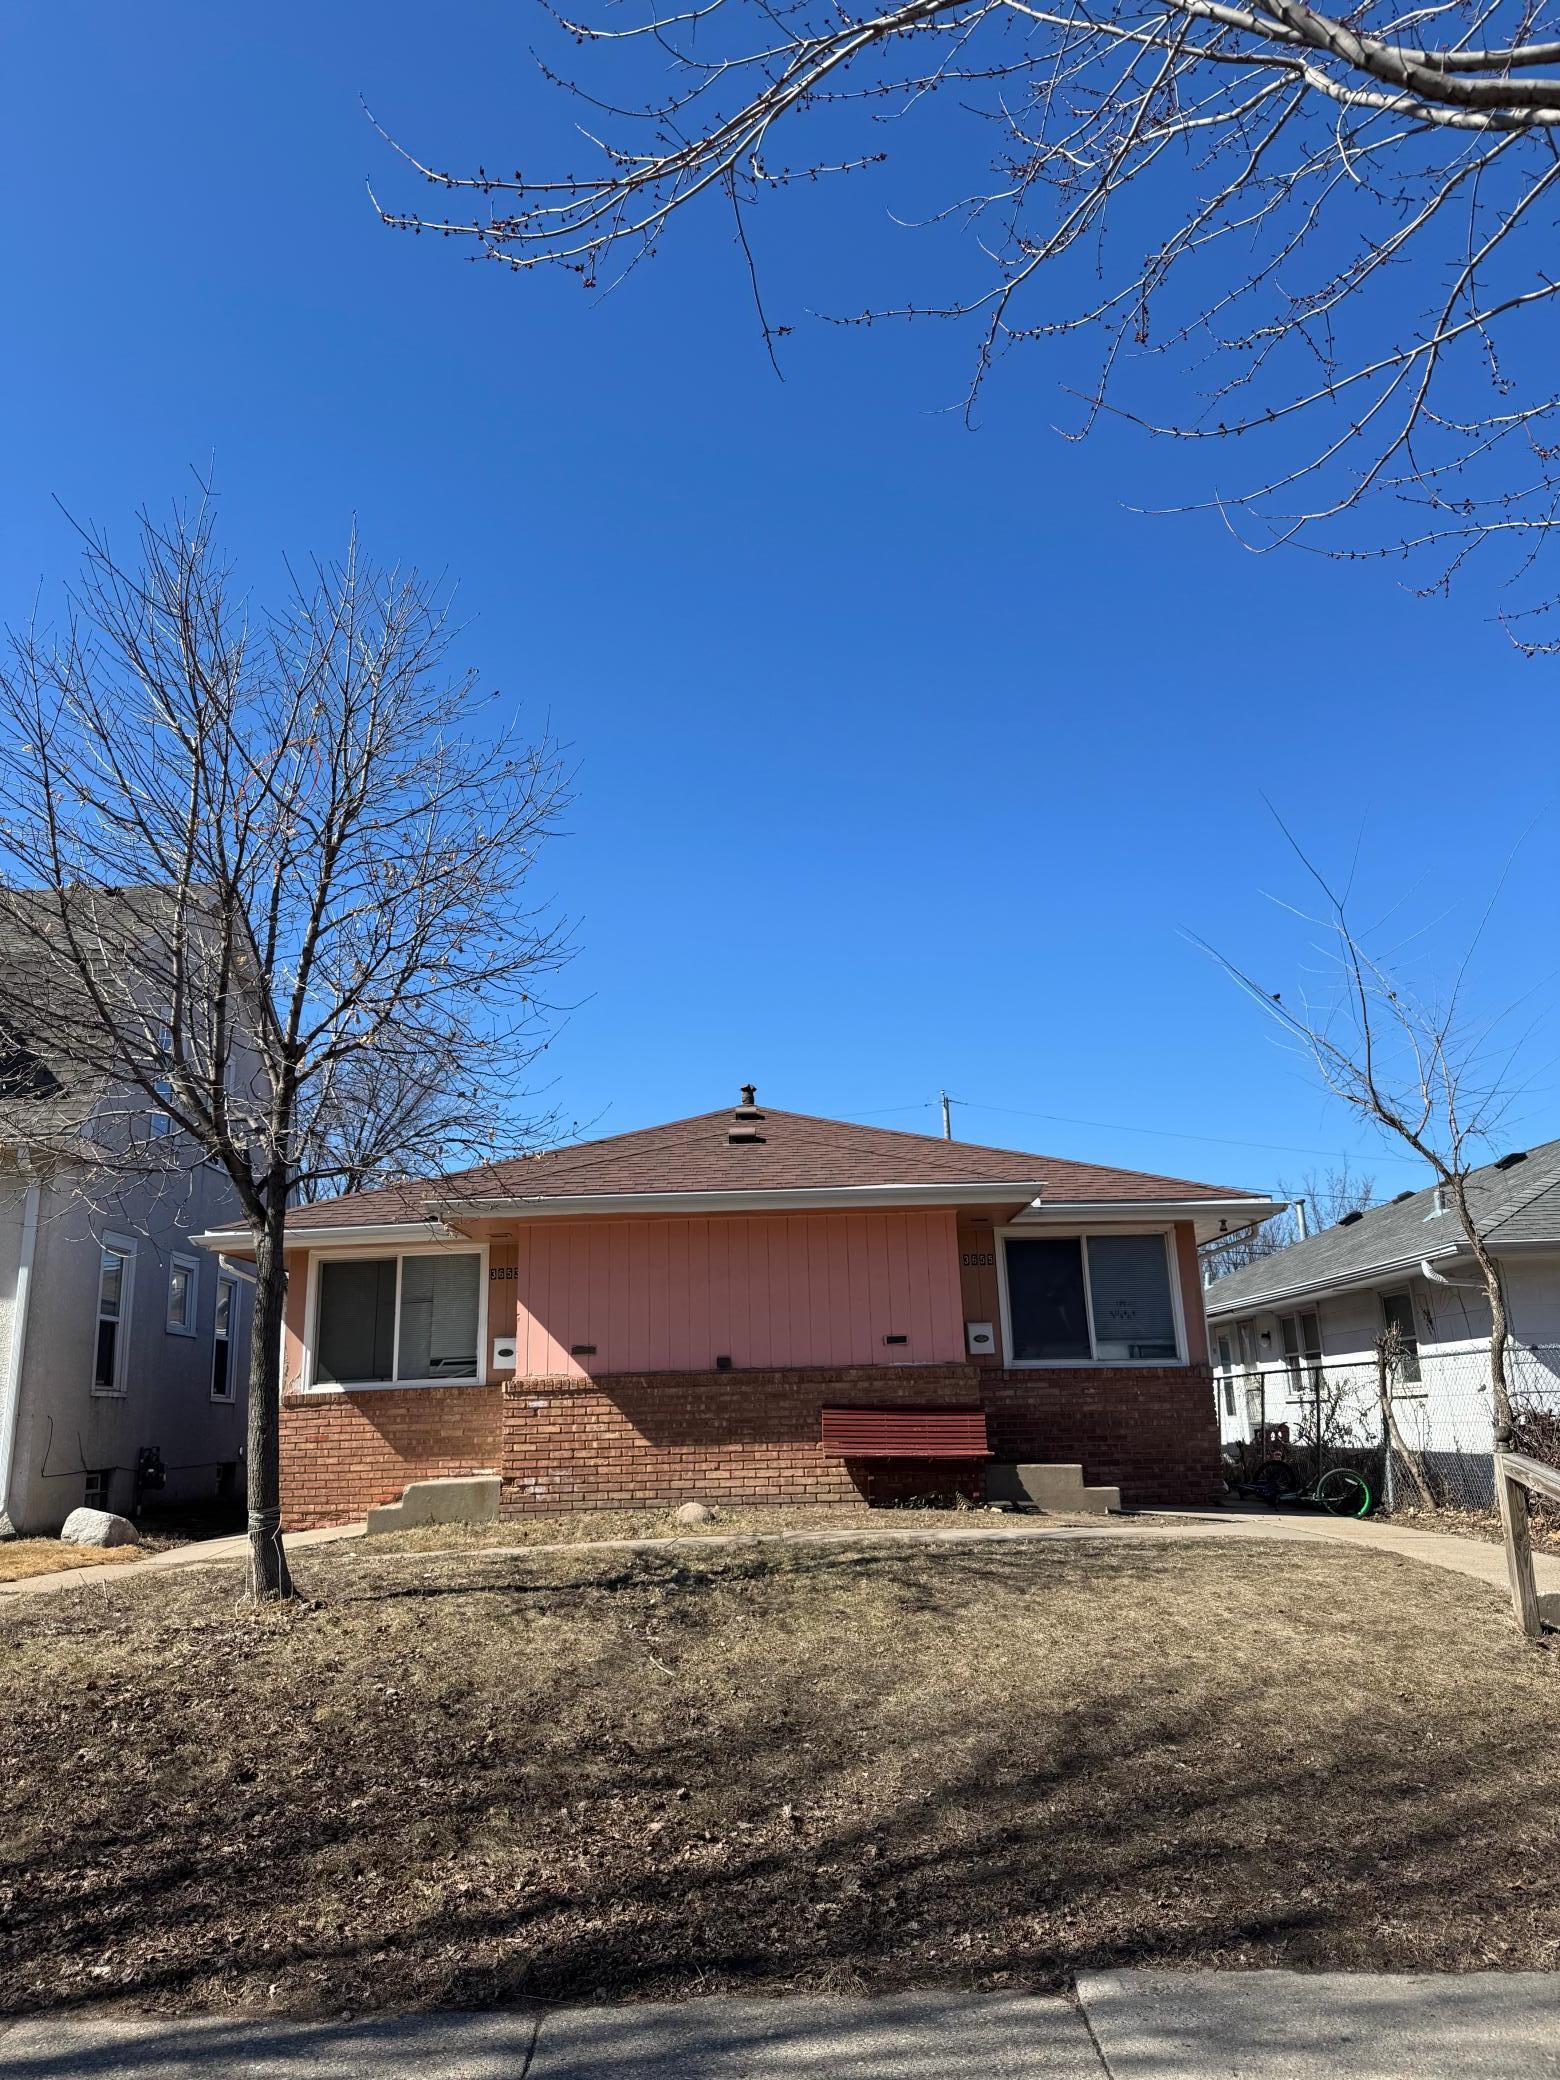
Active
$275,000
5
bds
|
3
ba
|
1,988
sqft
|
built
1906
3328 5th Ave S, Minneapolis, MN 55408
$-425
Cash flow
-8.1%
Cash-on-Cash Return
4.5%
Cap rate
0.7%
Rent to Value Ratio
Active
$699,500
8
bds
|
5
ba
|
4,360
sqft
|
built
1931
4429 Portland Ave, Minneapolis, MN 55407
$-2,826
Cash flow
-21.1%
Cash-on-Cash Return
1.5%
Cap rate
0.3%
Rent to Value Ratio
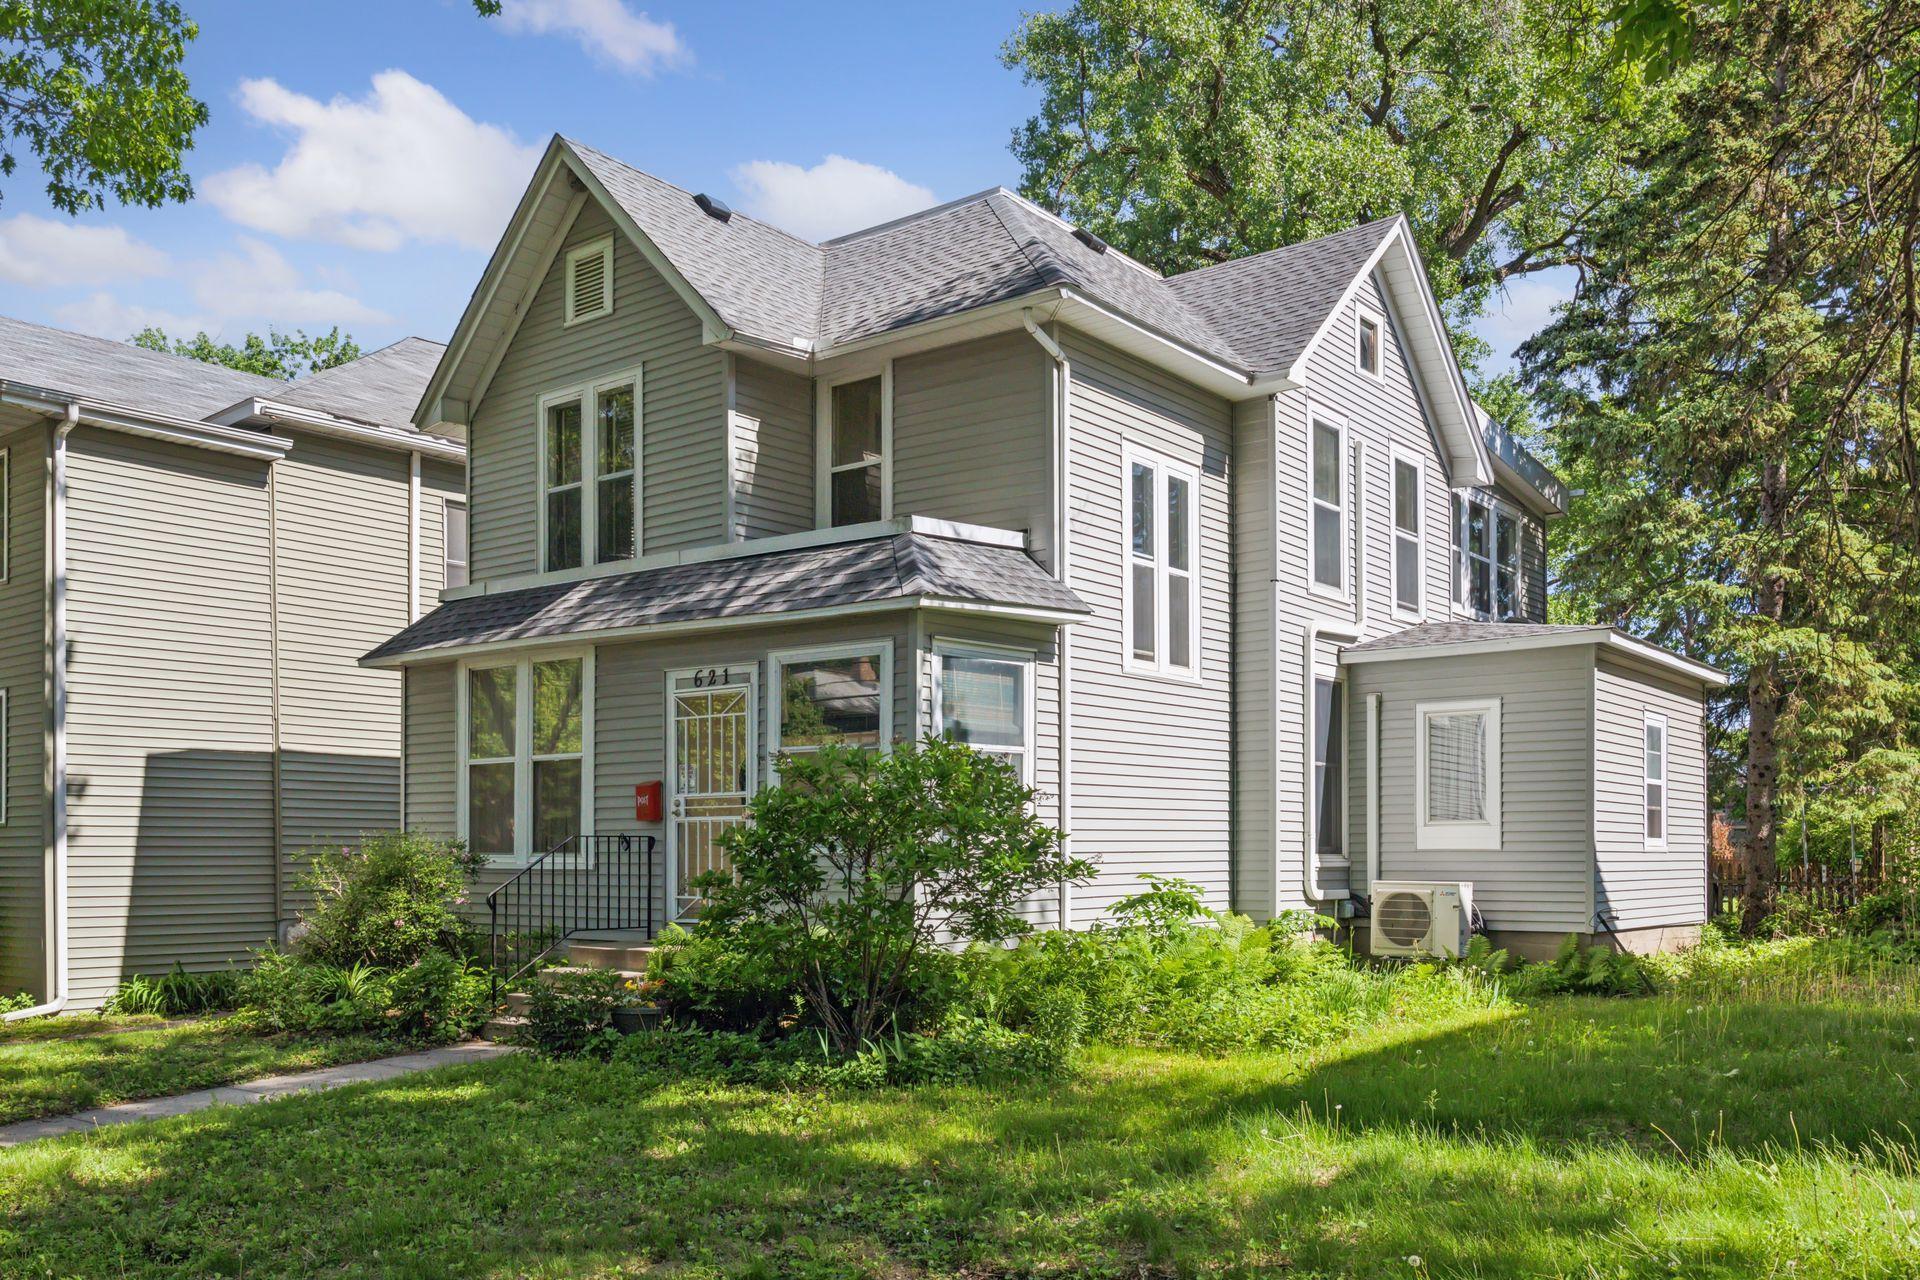
Active
$399,900
3
bds
|
2
ba
|
1,808
sqft
|
built
1939
621 6th St SE, Minneapolis, MN 55414
$-982
Cash flow
-12.8%
Cash-on-Cash Return
3.4%
Cap rate
0.6%
Rent to Value Ratio

Active
$599,999
5
bds
|
4
ba
|
2,088
sqft
|
built
1950
4707 France Ave S, Minneapolis, MN 55410
$-2,030
Cash flow
-17.7%
Cash-on-Cash Return
2.3%
Cap rate
0.4%
Rent to Value Ratio
Active
$649,000
9
bds
|
4
ba
|
3,840
sqft
|
built
1963
1733 37th Ave NE, Minneapolis, MN 55421
$-1,598
Cash flow
-12.8%
Cash-on-Cash Return
3.4%
Cap rate
0.5%
Rent to Value Ratio
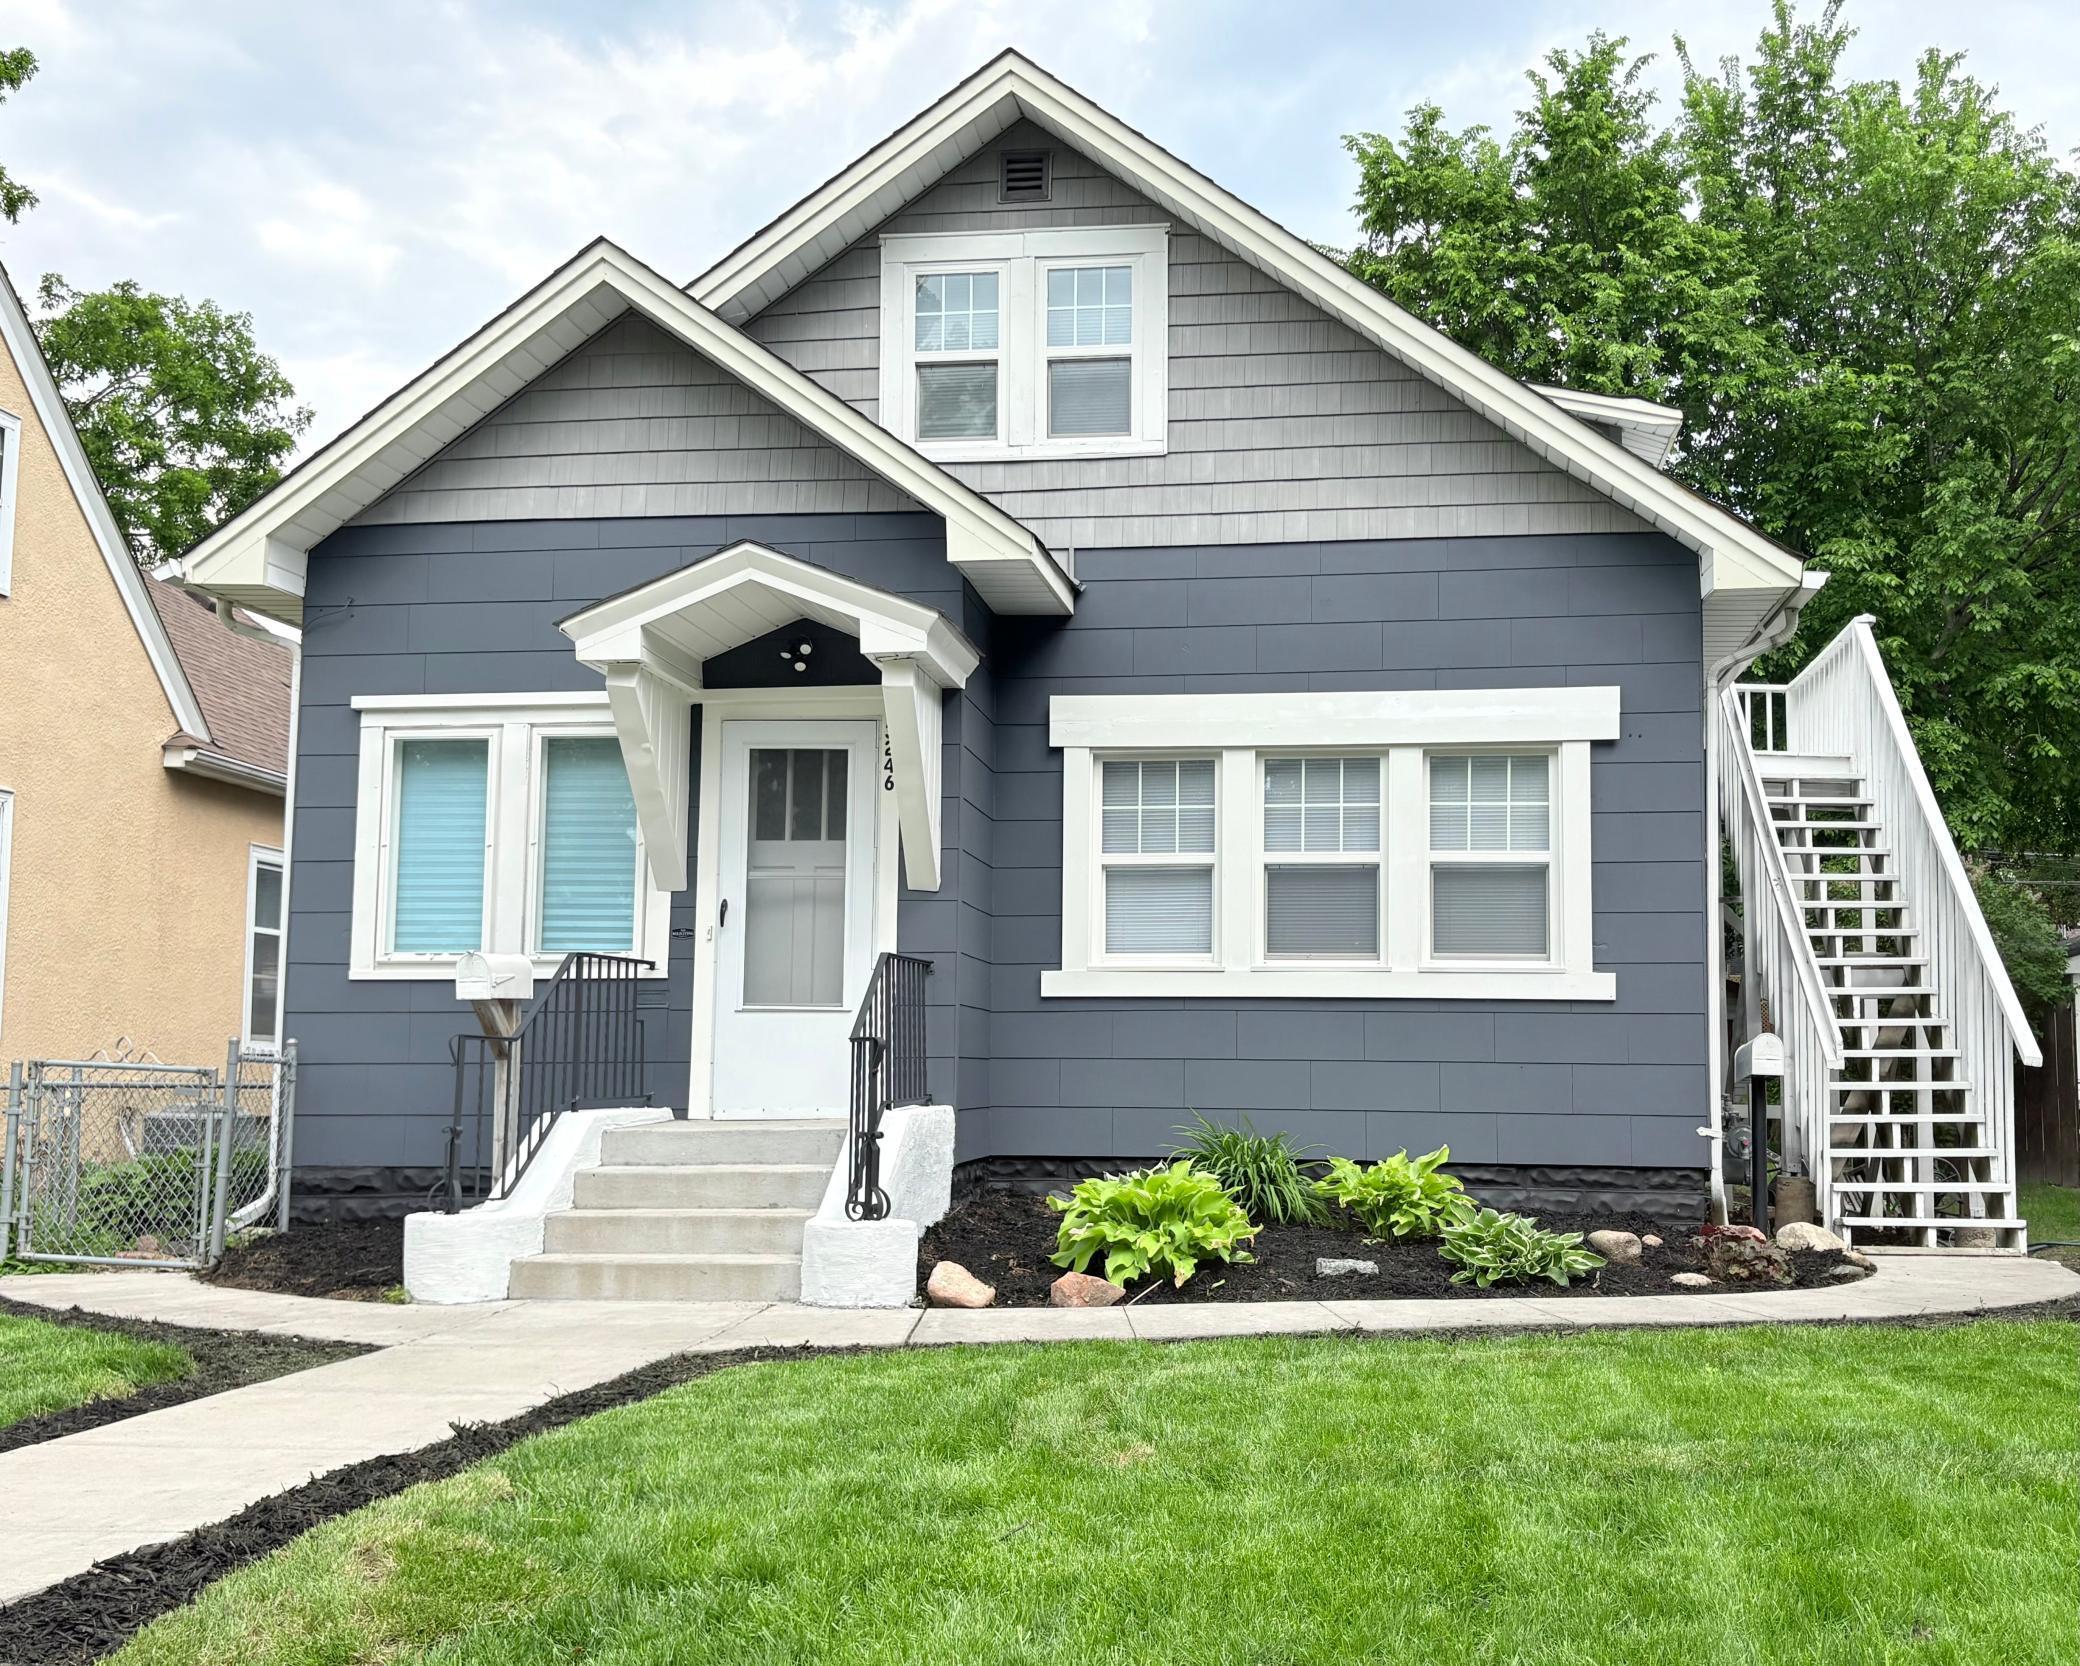
Active
$380,000
3
bds
|
2
ba
|
1,313
sqft
|
built
1926
3246 Washburn Ave N, Minneapolis, MN 55412
$-984
Cash flow
-13.5%
Cash-on-Cash Return
3.2%
Cap rate
0.5%
Rent to Value Ratio
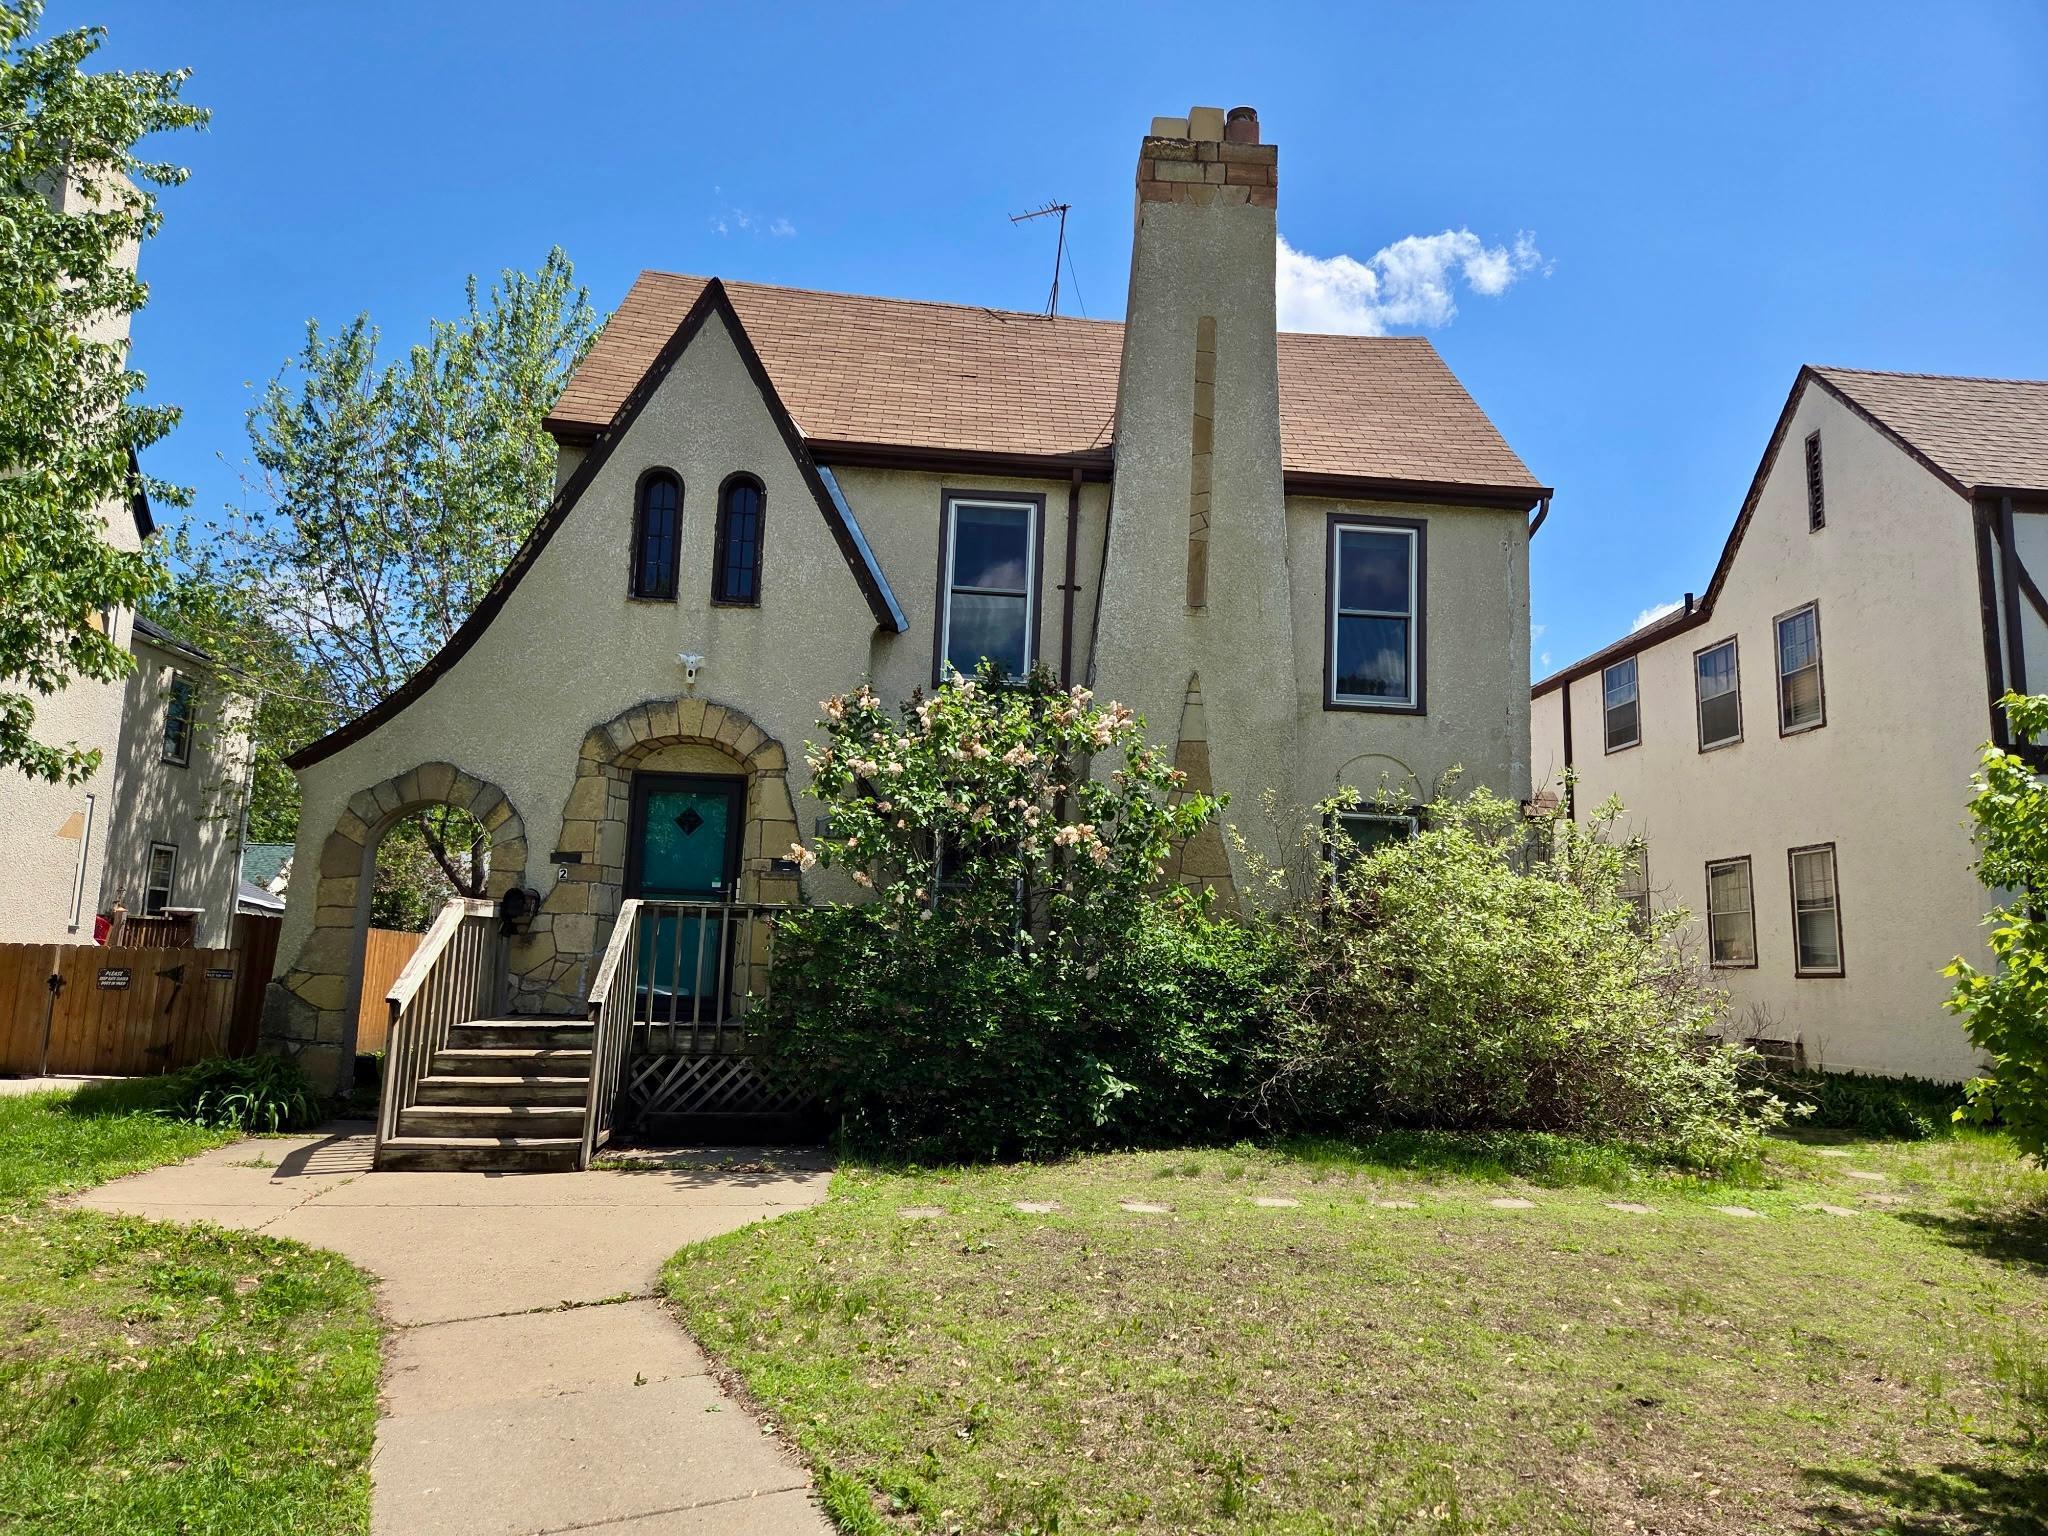
Active
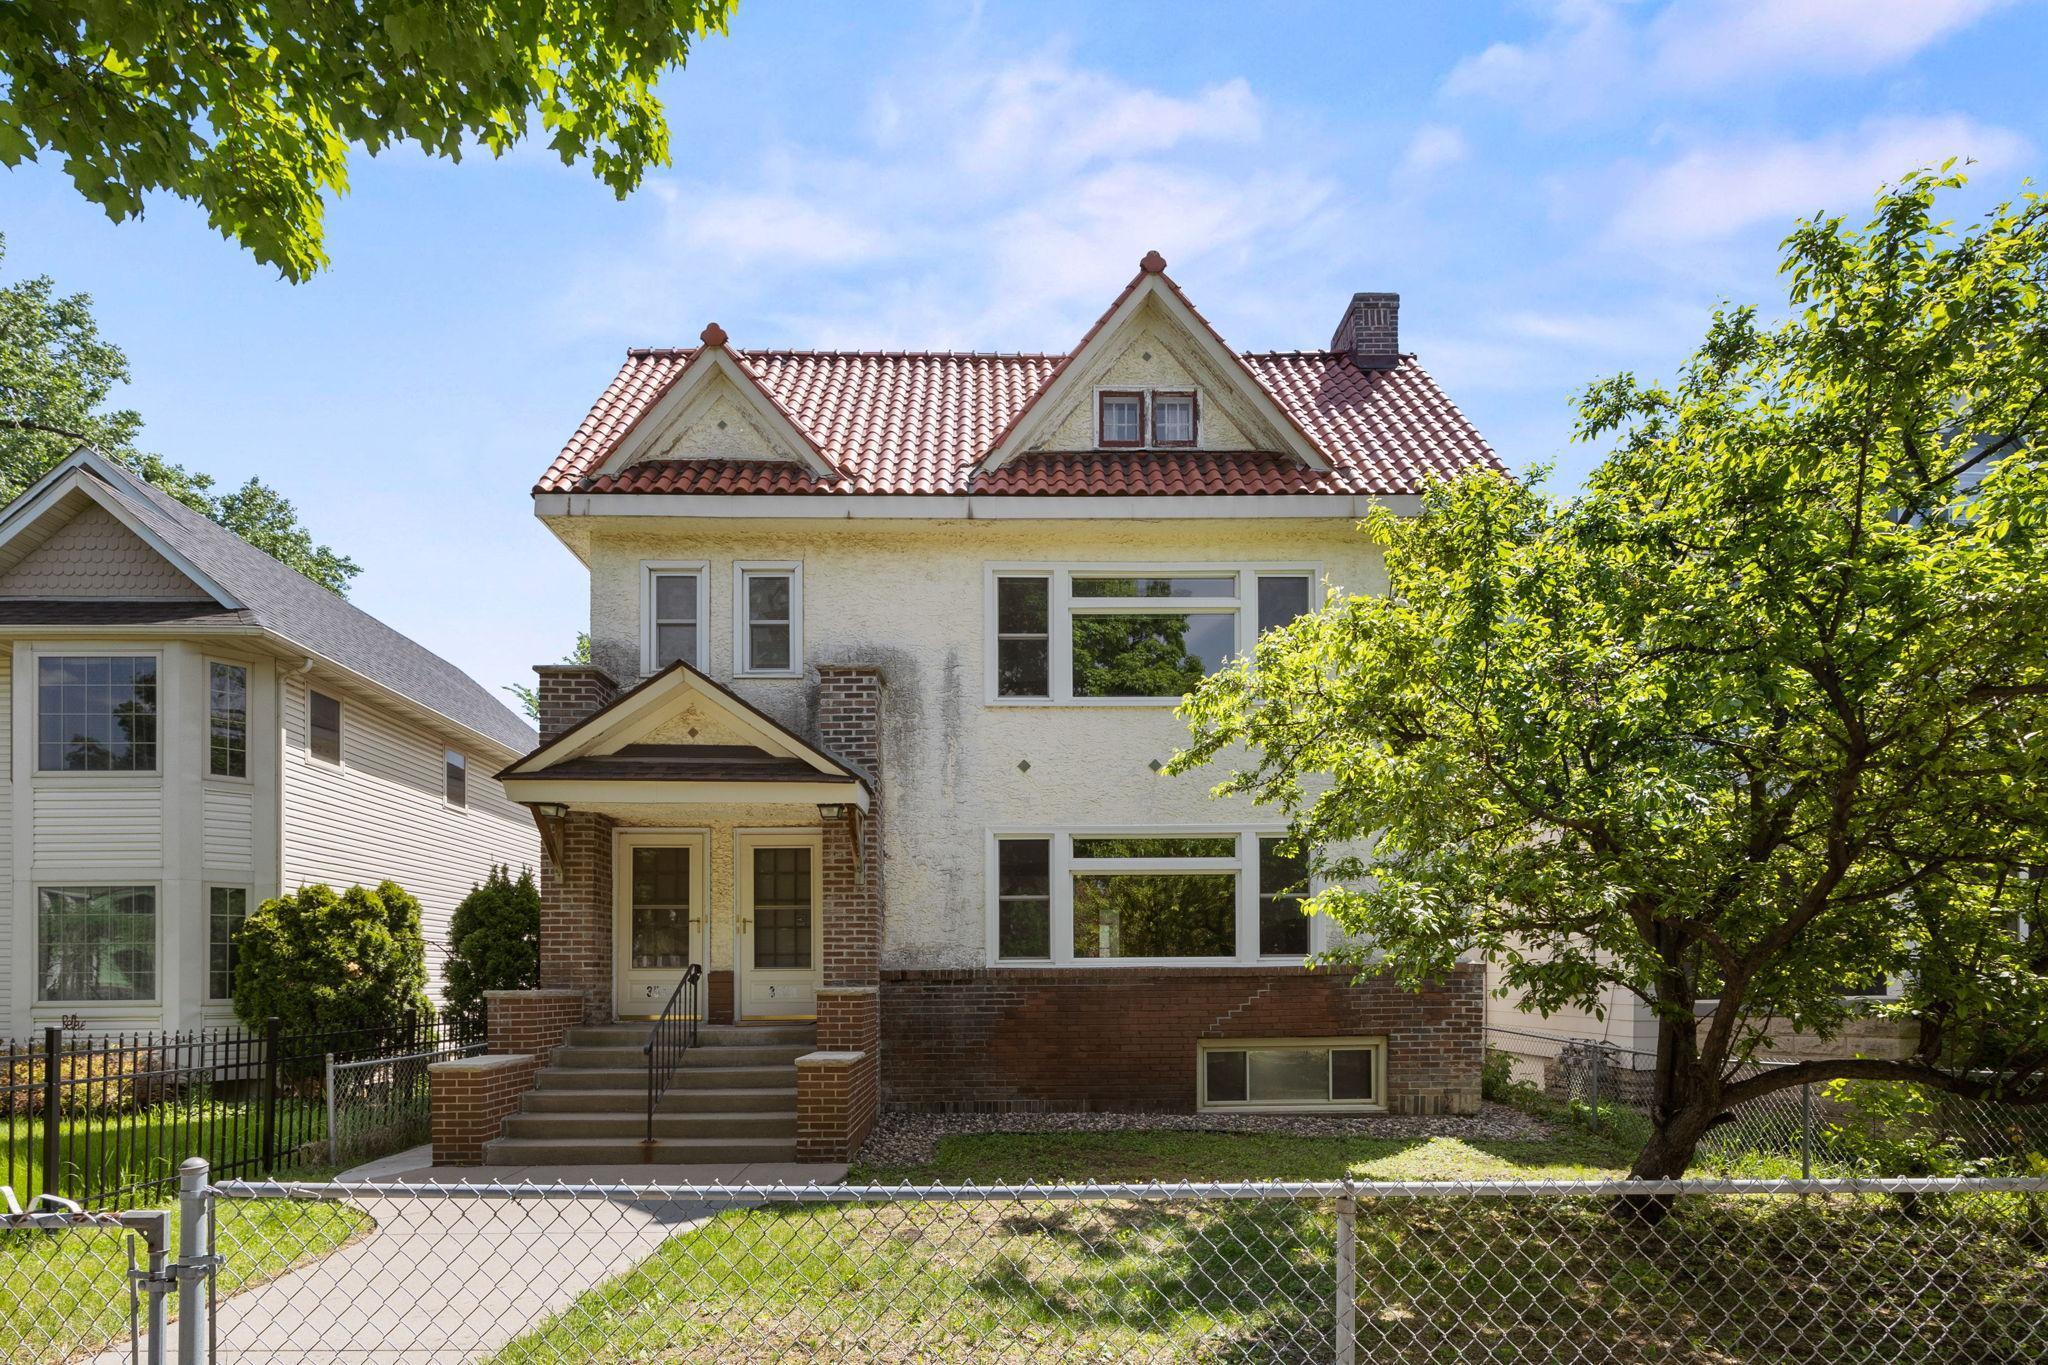
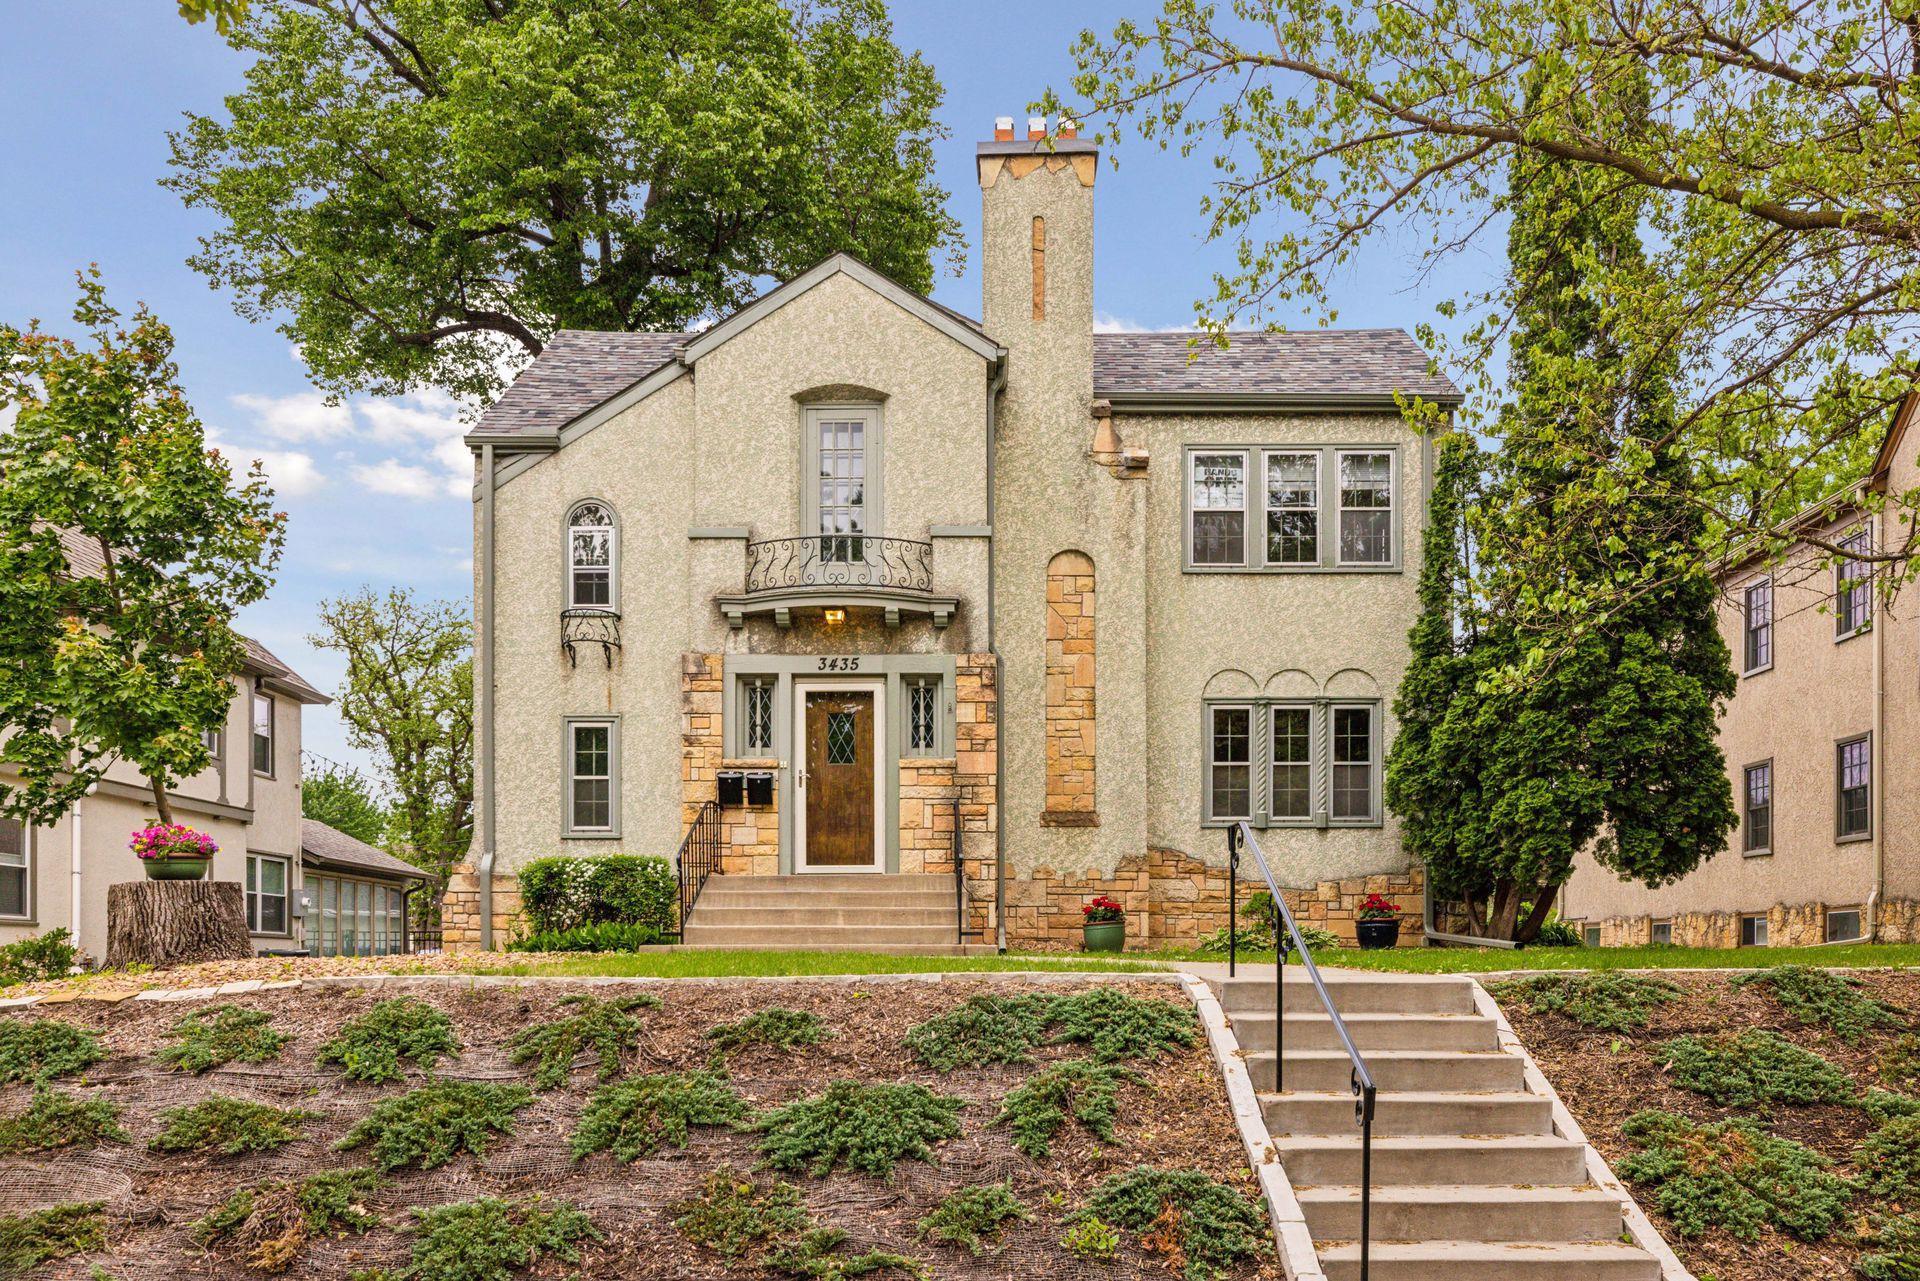
$474,900
4
bds
|
2
ba
|
2,113
sqft
|
built
1893
3435 Blaisdell Ave, Minneapolis, MN 55408
$-1,415
Cash flow
-15.5%
Cash-on-Cash Return
2.7%
Cap rate
0.5%
Rent to Value Ratio
Active
$525,000
7
bds
|
3
ba
|
3,615
sqft
|
built
1925
3549 Portland Ave, Minneapolis, MN 55407
$-1,934
Cash flow
-19.2%
Cash-on-Cash Return
1.9%
Cap rate
0.4%
Rent to Value Ratio

Active
$299,900
3
bds
|
2
ba
|
1,934
sqft
|
built
1917
4043 Penn Ave N, Minneapolis, MN 55412
$-473
Cash flow
-8.2%
Cash-on-Cash Return
4.4%
Cap rate
0.7%
Rent to Value Ratio
Active
$324,900
4
bds
|
3
ba
|
1,827
sqft
|
built
1900
2450 13th Ave S, Minneapolis, MN 55404
$-330
Cash flow
-5.3%
Cash-on-Cash Return
5.1%
Cap rate
0.6%
Rent to Value Ratio
Active
$850,000
6
bds
|
5
ba
|
4,079
sqft
|
built
1932
3435 Holmes Ave S, Minneapolis, MN 55408
$-3,824
Cash flow
-23.5%
Cash-on-Cash Return
0.9%
Cap rate
0.3%
Rent to Value Ratio
Active
$200,000
2
bds
|
1
ba
|
1,000
sqft
|
built
1983
445 Shelard Pkwy, Minneapolis, MN 55426
$-424
Cash flow
-11.1%
Cash-on-Cash Return
3.8%
Cap rate
0.9%
Rent to Value Ratio
Active
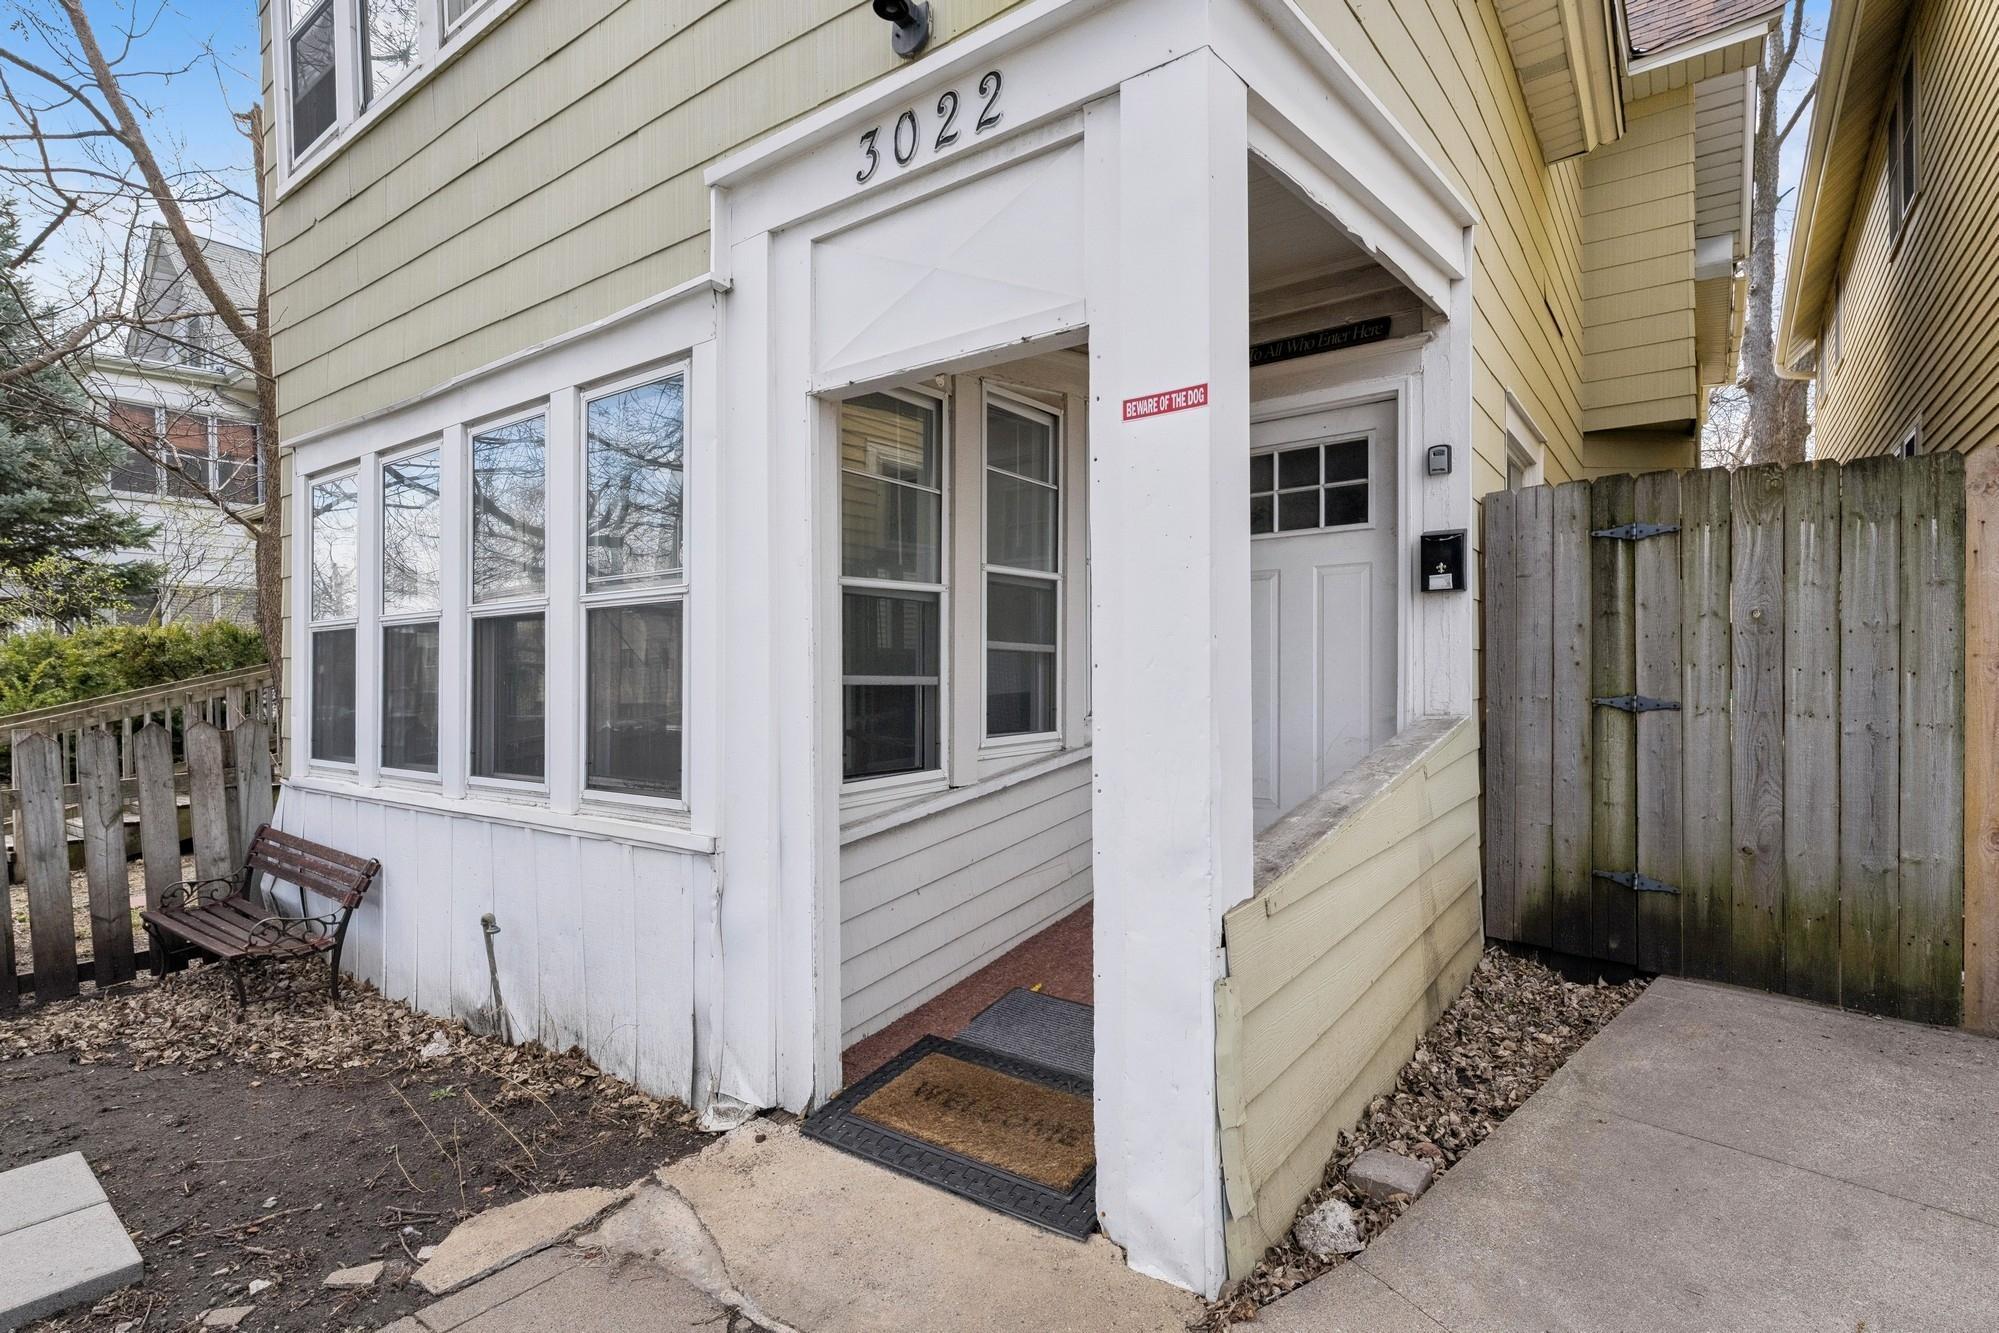
$347,500
4
bds
|
2
ba
|
2,024
sqft
|
built
1884
3022 Grand Ave S, Minneapolis, MN 55408
$-753
Cash flow
-11.3%
Cash-on-Cash Return
3.7%
Cap rate
0.6%
Rent to Value Ratio