Hennepin County Investment Properties for Sale
Browse homes for sale and investment properties in Hennepin County. Refine your search by price, property type, or more.
Best cash flowing properties in Hennepin County

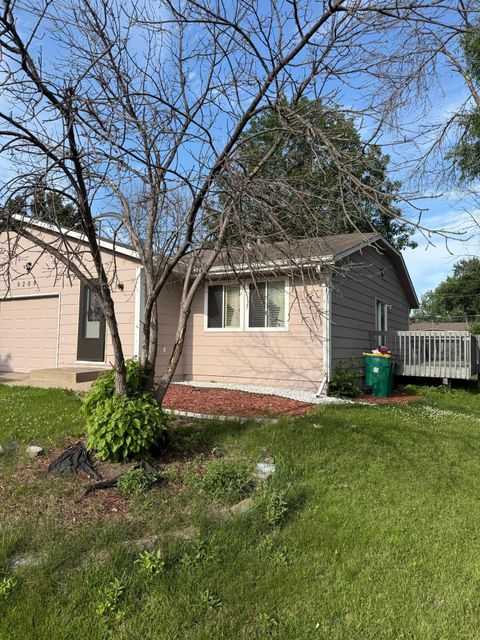
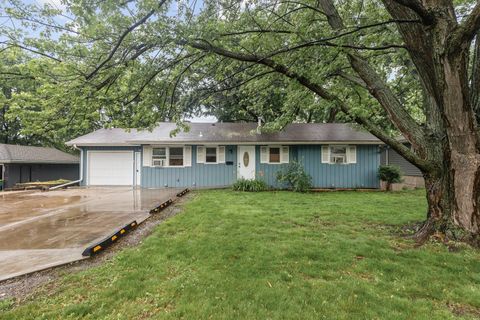
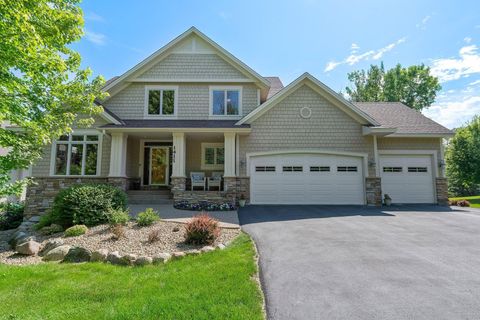
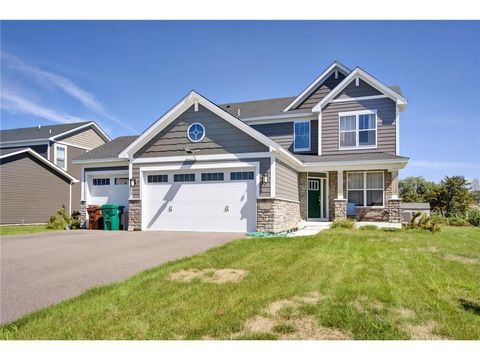
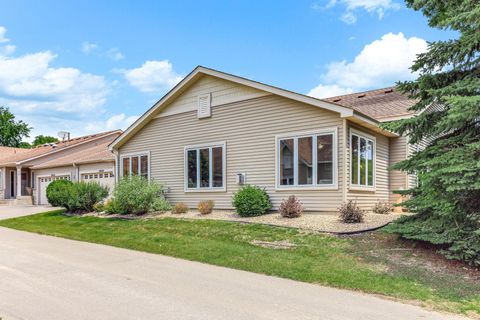
Active
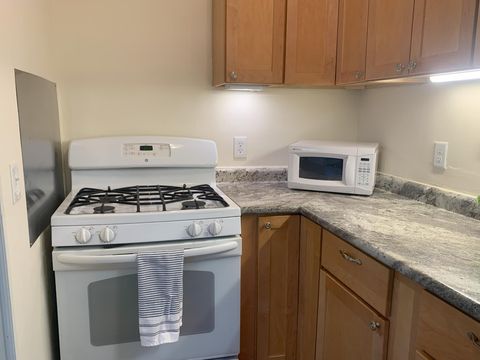
$74,900
bds
|
1
ba
|
400
sqft
|
built
1919
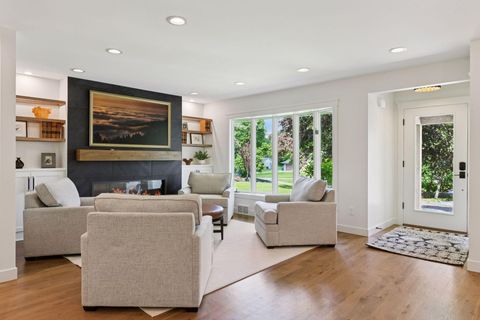
1901 Stevens Ave, Minneapolis, MN 55403
$278
Cash flow
4.3%
Cash-on-Cash Return
4.5%
Cap rate
1.3%
Rent to Value Ratio
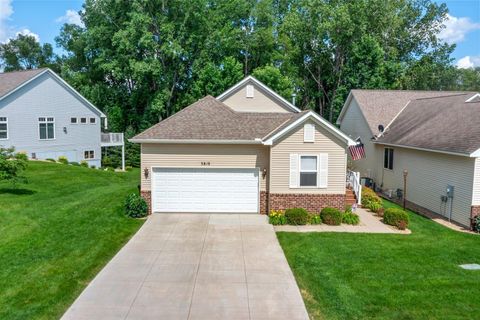
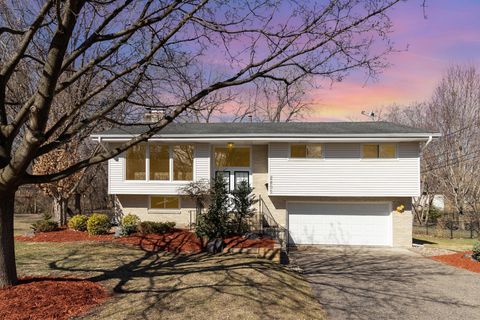
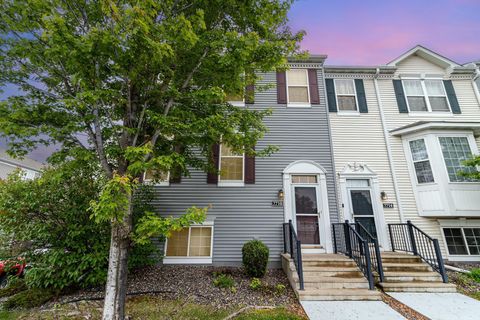
Active
$254,900
3
bds
|
2
ba
|
1,600
sqft
|
built
1977
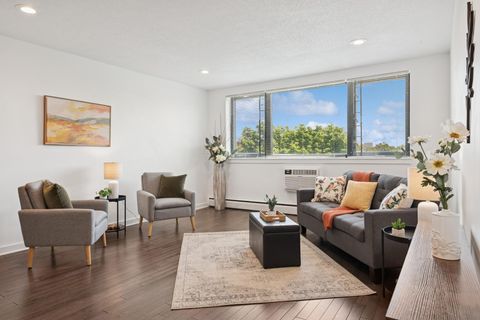
8208 Halifax Ct N, Brooklyn Park, MN 55443
$-28
Cash flow
-0.6%
Cash-on-Cash Return
5.5%
Cap rate
0.8%
Rent to Value Ratio
801 out of 1,188 properties for sale in Hennepin County
Limited Results Shown
Create a free account, or log in to reveal all property listings and enjoy the complete experience.
Active
$425,000
3
bds
|
3
ba
|
2,181
sqft
|
built
2002
3819 Meadowview Way, Saint Bonifacius, MN 55375
$-877
Cash flow
-10.8%
Cash-on-Cash Return
3.2%
Cap rate
0.6%
Rent to Value Ratio
Active
$290,000
5
bds
|
2
ba
|
1,799
sqft
|
built
1971
4209 81st Ave N, Brooklyn Park, MN 55443
$-73
Cash flow
-1.3%
Cash-on-Cash Return
5.4%
Cap rate
0.9%
Rent to Value Ratio

Active
$774,000
5
bds
|
5
ba
|
4,258
sqft
|
built
1995
8017 Lismore Cir, Eden Prairie, MN 55347
$-1,670
Cash flow
-11.3%
Cash-on-Cash Return
3.1%
Cap rate
0.5%
Rent to Value Ratio
Active
$264,900
1
bds
|
1
ba
|
675
sqft
|
built
1920
700 Washington Ave N, Minneapolis, MN 55401
$-633
Cash flow
-12.5%
Cash-on-Cash Return
2.8%
Cap rate
0.8%
Rent to Value Ratio
Active
$350,000
5
bds
|
2
ba
|
2,663
sqft
|
built
1961
3108 Virginia Ave N, Crystal, MN 55427
$-158
Cash flow
-2.4%
Cash-on-Cash Return
5.1%
Cap rate
0.8%
Rent to Value Ratio
Active
$314,900
2
bds
|
1
ba
|
801
sqft
|
built
1900
400 N 1st St, Minneapolis, MN 55401
$-963
Cash flow
-16.0%
Cash-on-Cash Return
2.0%
Cap rate
0.6%
Rent to Value Ratio

Active
$12,500,000
5
bds
|
7
ba
|
9,926
sqft
|
built
1928
20100 Lakeview Ave, Excelsior, MN 55331
$-61,917
Cash flow
-25.8%
Cash-on-Cash Return
-0.3%
Cap rate
0.0%
Rent to Value Ratio
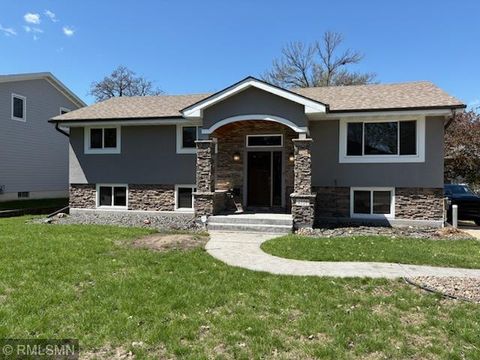
Active
$430,000
4
bds
|
2
ba
|
2,328
sqft
|
built
1965
4521 Orchard Ave N, Robbinsdale, MN 55422
$-495
Cash flow
-6.0%
Cash-on-Cash Return
4.3%
Cap rate
0.7%
Rent to Value Ratio
Active
$480,000
3
bds
|
3
ba
|
2,769
sqft
|
built
1964
2805 Regent Ave N, Golden Valley, MN 55422
$-889
Cash flow
-9.7%
Cash-on-Cash Return
3.5%
Cap rate
0.6%
Rent to Value Ratio
Active
$1,000,000
5
bds
|
4
ba
|
3,582
sqft
|
built
2004
1411 Archwood Rd, Minnetonka, MN 55305
$-2,587
Cash flow
-13.5%
Cash-on-Cash Return
2.6%
Cap rate
0.4%
Rent to Value Ratio
Active
$282,900
3
bds
|
2
ba
|
1,468
sqft
|
built
1926
3736 Park Ave, Minneapolis, MN 55407
$-176
Cash flow
-3.2%
Cash-on-Cash Return
4.9%
Cap rate
0.8%
Rent to Value Ratio

Active
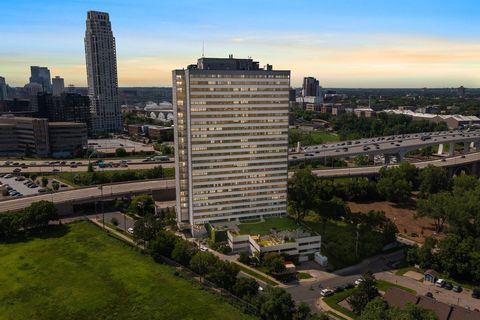
$3,695,000
2
bds
|
3
ba
|
2,677
sqft
|
built
2022
1111 W River Pkwy, Minneapolis, MN 55415
$-19,797
Cash flow
-28.0%
Cash-on-Cash Return
-0.8%
Cap rate
0.1%
Rent to Value Ratio
Active
$650,000
8
bds
|
4
ba
|
4,436
sqft
|
built
1986
5701 34th Ave S, Minneapolis, MN 55417
$-2,494
Cash flow
-20.0%
Cash-on-Cash Return
1.1%
Cap rate
0.3%
Rent to Value Ratio
Active
$650,000
8
bds
|
4
ba
|
4,436
sqft
|
built
1987
5649 34th Ave S, Minneapolis, MN 55417
$-2,512
Cash flow
-20.2%
Cash-on-Cash Return
1.0%
Cap rate
0.3%
Rent to Value Ratio
Active
$574,900
4
bds
|
3
ba
|
2,962
sqft
|
built
1950
4590 Merrywood Ln, Excelsior, MN 55331
$-843
Cash flow
-7.7%
Cash-on-Cash Return
3.9%
Cap rate
0.6%
Rent to Value Ratio
Active
$254,900
3
bds
|
2
ba
|
1,928
sqft
|
built
1900
2705 17th Ave S, Minneapolis, MN 55407
$-97
Cash flow
-2.0%
Cash-on-Cash Return
5.2%
Cap rate
0.8%
Rent to Value Ratio
Active
$661,415
4
bds
|
3
ba
|
2,915
sqft
|
built
2025
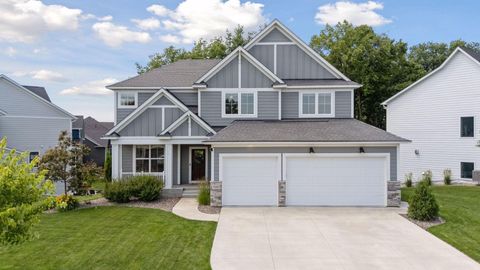
14706 146th Ave N, Dayton, MN 55327
$-1,040
Cash flow
-8.2%
Cash-on-Cash Return
3.8%
Cap rate
0.5%
Rent to Value Ratio

Active
$429,900
3
bds
|
3
ba
|
1,761
sqft
|
built
1977
7080 Quail Cir, Eden Prairie, MN 55346
$-566
Cash flow
-6.9%
Cash-on-Cash Return
4.1%
Cap rate
0.6%
Rent to Value Ratio
Active
$2,495,000
5
bds
|
5
ba
|
5,164
sqft
|
built
2016
2890 Ella Ln, Minnetonka, MN 55305
$-9,923
Cash flow
-20.8%
Cash-on-Cash Return
0.9%
Cap rate
0.2%
Rent to Value Ratio
Active
$1,095,000
3
bds
|
3
ba
|
2,708
sqft
|
built
1950
3930 Cottage Ln, Minnetonka, MN 55305
$-3,653
Cash flow
-17.4%
Cash-on-Cash Return
1.7%
Cap rate
0.3%
Rent to Value Ratio
Active
$82,000
1
bds
|
1
ba
|
686
sqft
|
built
1959
2500 Blaisdell Ave, Minneapolis, MN 55404
$-485
Cash flow
-30.9%
Cash-on-Cash Return
-1.4%
Cap rate
1.3%
Rent to Value Ratio
Active
$965,000
5
bds
|
5
ba
|
4,055
sqft
|
built
2020
5989 Xanthus Ln N, Plymouth, MN 55446
$-2,454
Cash flow
-13.3%
Cash-on-Cash Return
2.6%
Cap rate
0.5%
Rent to Value Ratio
Active
$600,000
7
bds
|
4
ba
|
3,528
sqft
|
built
1964
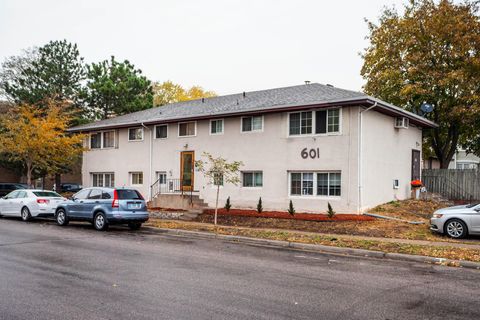
601 Jackson St NE, Minneapolis, MN 55413
$-2,314
Cash flow
-20.1%
Cash-on-Cash Return
1.1%
Cap rate
0.3%
Rent to Value Ratio

Active
$549,900
2
bds
|
2
ba
|
1,599
sqft
|
built
2016
740 Portland Ave, Minneapolis, MN 55415
$-1,382
Cash flow
-13.1%
Cash-on-Cash Return
2.7%
Cap rate
0.7%
Rent to Value Ratio
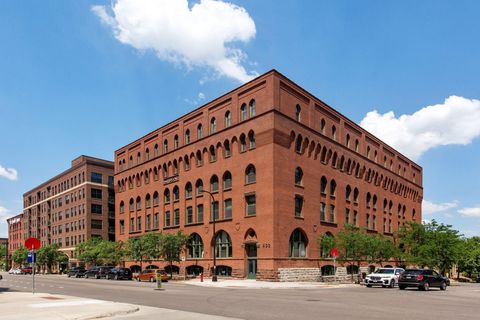
Active
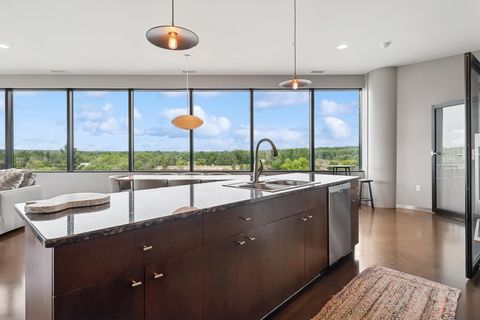
$1,129,900
2
bds
|
2
ba
|
2,100
sqft
|
built
2007
222 2nd St SE, Minneapolis, MN 55414
$-5,165
Cash flow
-23.8%
Cash-on-Cash Return
0.2%
Cap rate
0.5%
Rent to Value Ratio
Active
$515,000
6
bds
|
4
ba
|
3,520
sqft
|
built
1969
510 Shadyside Cir, Hopkins, MN 55343
$-1,288
Cash flow
-13.0%
Cash-on-Cash Return
2.7%
Cap rate
0.5%
Rent to Value Ratio
Active
$160,000
1
bds
|
1
ba
|
706
sqft
|
built
1964
6423 Colony Way, Edina, MN 55435
$-201
Cash flow
-6.6%
Cash-on-Cash Return
4.2%
Cap rate
1.0%
Rent to Value Ratio
Active
$309,900
2
bds
|
2
ba
|
0
sqft
|
built
2006
929 Portland Ave, Minneapolis, MN 55404
$-833
Cash flow
-14.0%
Cash-on-Cash Return
2.5%
Cap rate
0.8%
Rent to Value Ratio
Active
$119,000
1
bds
|
1
ba
|
0
sqft
|
built
1923
2739 Girard Ave S, Minneapolis, MN 55408
$-303
Cash flow
-13.3%
Cash-on-Cash Return
2.6%
Cap rate
0.9%
Rent to Value Ratio
Active
$110,000
1
bds
|
1
ba
|
650
sqft
|
built
1973
1920 S 1st St, Minneapolis, MN 55454
$-444
Cash flow
-21.1%
Cash-on-Cash Return
0.8%
Cap rate
1.3%
Rent to Value Ratio
Active
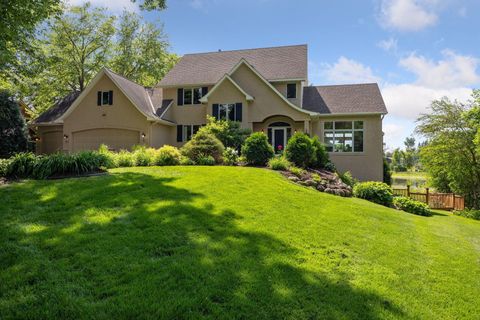
$950,000
4
bds
|
4
ba
|
3,700
sqft
|
built
1996
180 Ranchview Ln S, Wayzata, MN 55391
$-1,772
Cash flow
-9.7%
Cash-on-Cash Return
3.4%
Cap rate
0.6%
Rent to Value Ratio
Active
$368,000
2
bds
|
2
ba
|
1,633
sqft
|
built
1986
5601 Smetana Dr, Hopkins, MN 55343
$-1,217
Cash flow
-17.3%
Cash-on-Cash Return
1.7%
Cap rate
0.8%
Rent to Value Ratio
Active
$530,000
5
bds
|
4
ba
|
3,653
sqft
|
built
2021
14385 Annapolis Ln N, Dayton, MN 55327
$-534
Cash flow
-5.3%
Cash-on-Cash Return
4.5%
Cap rate
0.7%
Rent to Value Ratio
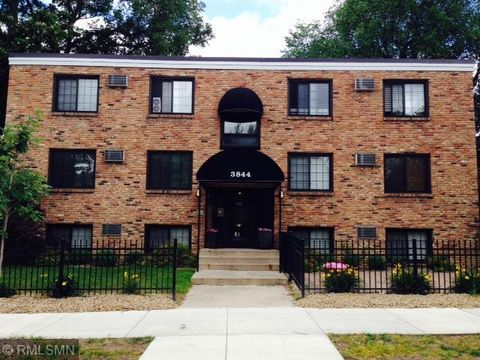
Active
$129,900
1
bds
|
1
ba
|
510
sqft
|
built
1965
3844 Nicollet Ave, Minneapolis, MN 55409
$-241
Cash flow
-9.7%
Cash-on-Cash Return
3.5%
Cap rate
1.1%
Rent to Value Ratio
Active
$619,900
4
bds
|
2
ba
|
2,276
sqft
|
built
1923
4536 Grand Ave S, Minneapolis, MN 55419
$-1,845
Cash flow
-15.5%
Cash-on-Cash Return
2.1%
Cap rate
0.4%
Rent to Value Ratio
Active
$389,900
2
bds
|
2
ba
|
1,834
sqft
|
built
1980
8430 Pennsylvania Rd, Bloomington, MN 55438
$-1,439
Cash flow
-19.3%
Cash-on-Cash Return
1.2%
Cap rate
0.7%
Rent to Value Ratio
Active
$375,000
2
bds
|
2
ba
|
1,704
sqft
|
built
1999
10630 57th Pl N, Plymouth, MN 55442
$-935
Cash flow
-13.0%
Cash-on-Cash Return
2.7%
Cap rate
0.7%
Rent to Value Ratio
Active
$279,000
3
bds
|
3
ba
|
1,938
sqft
|
built
2004
7710 Elm Grove Ct, New Hope, MN 55428
$-409
Cash flow
-7.6%
Cash-on-Cash Return
3.9%
Cap rate
0.9%
Rent to Value Ratio