Hennepin County Investment Properties for Sale
Browse homes for sale and investment properties in Hennepin County. Refine your search by price, property type, or more.
Best cash flowing properties in Hennepin County
Active
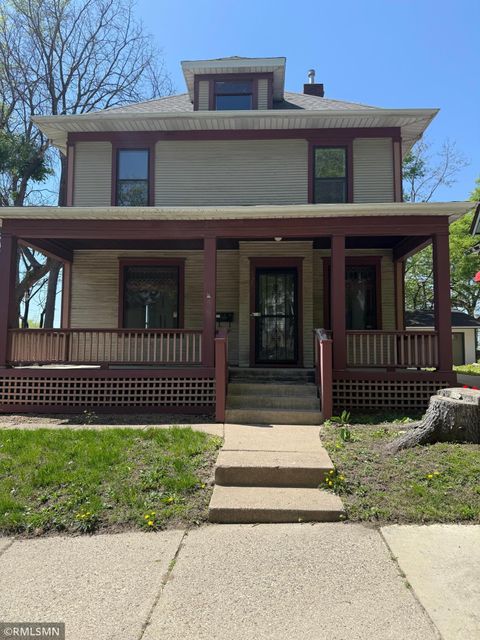
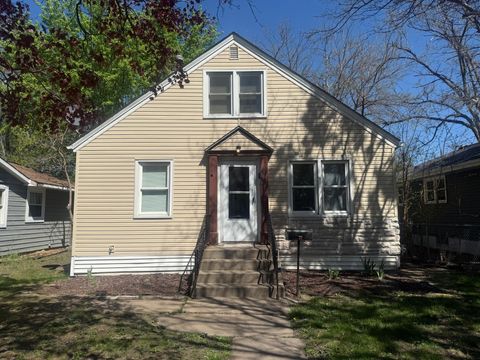
$199,900
4
bds
|
2
ba
|
1,692
sqft
|
built
1909
1525 Hillside Ave N, Minneapolis, MN 55411
$489
Cash flow
12.8%
Cash-on-Cash Return
8.6%
Cap rate
1.3%
Rent to Value Ratio
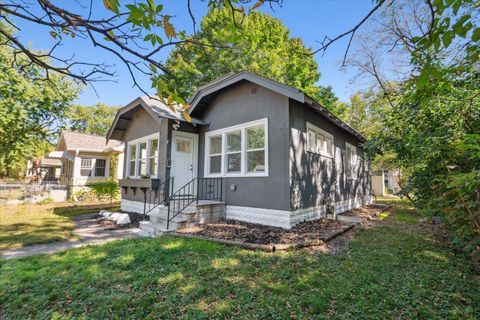
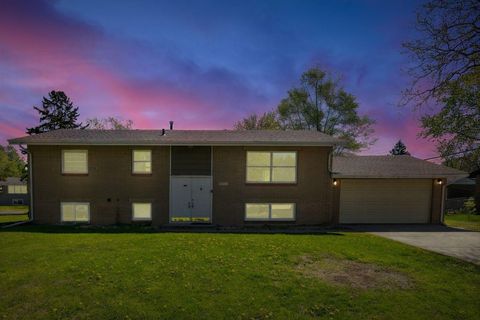
Active
$310,000
4
bds
|
2
ba
|
2,246
sqft
|
built
1924
3410 Russell Ave N, Minneapolis, MN 55412
$55
Cash flow
0.9%
Cash-on-Cash Return
5.9%
Cap rate
0.8%
Rent to Value Ratio
801 out of 1,188 properties for sale in Hennepin County
Limited Results Shown
Create a free account, or log in to reveal all property listings and enjoy the complete experience.
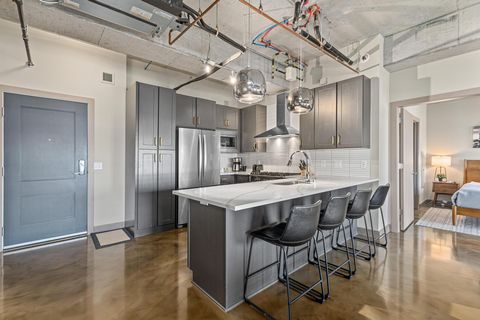
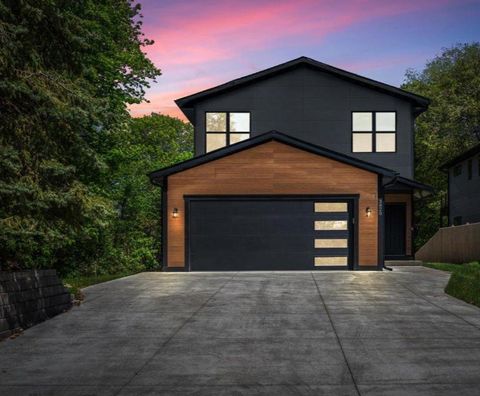
Active
$700,000
2
bds
|
2
ba
|
978
sqft
|
built
2019
728 3rd St N, Minneapolis, MN 55401
$-2,184
Cash flow
-16.3%
Cash-on-Cash Return
1.9%
Cap rate
0.5%
Rent to Value Ratio
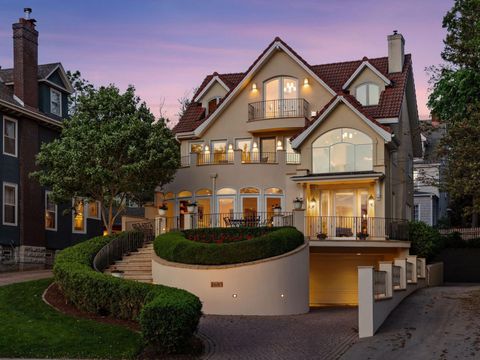
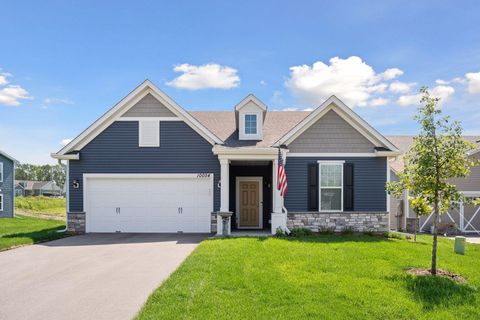
Active
$2,375,000
3
bds
|
3
ba
|
4,033
sqft
|
built
1907
2683 E Lake Of The Isles Pkwy, Minneapolis, MN 55408
$-10,312
Cash flow
-22.7%
Cash-on-Cash Return
0.5%
Cap rate
0.2%
Rent to Value Ratio
Active
$789,000
2
bds
|
2
ba
|
1,799
sqft
|
built
1877
8 Grove St, Minneapolis, MN 55401
$-1,939
Cash flow
-12.8%
Cash-on-Cash Return
2.7%
Cap rate
0.6%
Rent to Value Ratio
Active
$629,777
3
bds
|
5
ba
|
2,551
sqft
|
built
1993
5541 W 70th St, Edina, MN 55439
$-1,879
Cash flow
-15.6%
Cash-on-Cash Return
2.1%
Cap rate
0.6%
Rent to Value Ratio

Active
$695,000
5
bds
|
4
ba
|
4,167
sqft
|
built
2006
10543 Noble Cir N, Brooklyn Park, MN 55443
$-1,208
Cash flow
-9.1%
Cash-on-Cash Return
3.6%
Cap rate
0.6%
Rent to Value Ratio

Active
$699,900
3
bds
|
4
ba
|
2,259
sqft
|
built
1947
5920 Colfax Ave S, Minneapolis, MN 55419
$-1,537
Cash flow
-11.5%
Cash-on-Cash Return
3.0%
Cap rate
0.5%
Rent to Value Ratio

Active
$208,000
1
bds
|
1
ba
|
792
sqft
|
built
2004
1800 Clinton Ave, Minneapolis, MN 55404
$-436
Cash flow
-10.9%
Cash-on-Cash Return
3.2%
Cap rate
0.8%
Rent to Value Ratio
Active
$329,900
3
bds
|
2
ba
|
1,579
sqft
|
built
1942
3509 Perry Ave N, Crystal, MN 55422
$-235
Cash flow
-3.7%
Cash-on-Cash Return
4.8%
Cap rate
0.7%
Rent to Value Ratio
Active
$395,000
3
bds
|
2
ba
|
1,489
sqft
|
built
1976
1940 Dupont Ave S, Minneapolis, MN 55403
$-1,357
Cash flow
-17.9%
Cash-on-Cash Return
1.6%
Cap rate
0.6%
Rent to Value Ratio

Active
$97,600
1
bds
|
1
ba
|
531
sqft
|
built
1925
1820 1st Ave S, Minneapolis, MN 55403
$-56
Cash flow
-3.0%
Cash-on-Cash Return
5.0%
Cap rate
1.3%
Rent to Value Ratio
Active
$2,900,000
4
bds
|
5
ba
|
6,049
sqft
|
built
1987
9002 Riley Lake Rd, Eden Prairie, MN 55347
$-13,306
Cash flow
-23.9%
Cash-on-Cash Return
0.2%
Cap rate
0.2%
Rent to Value Ratio
Active
$749,900
2
bds
|
2
ba
|
2,194
sqft
|
built
2024
5742 Shady Oak Rd S, Minnetonka, MN 55343
$-2,082
Cash flow
-14.5%
Cash-on-Cash Return
2.3%
Cap rate
0.6%
Rent to Value Ratio
Active
$309,900
1
bds
|
1
ba
|
810
sqft
|
built
2004
700 Washington Ave N, Minneapolis, MN 55401
$-1,178
Cash flow
-19.8%
Cash-on-Cash Return
1.1%
Cap rate
0.6%
Rent to Value Ratio
Active
$300,000
1
bds
|
1
ba
|
491
sqft
|
built
2019
728 3rd St N, Minneapolis, MN 55401
$-762
Cash flow
-13.3%
Cash-on-Cash Return
2.6%
Cap rate
0.8%
Rent to Value Ratio
Active
$2,650,000
4
bds
|
4
ba
|
4,448
sqft
|
built
2007
4540 Upton Ave S, Minneapolis, MN 55410
$-8,904
Cash flow
-17.5%
Cash-on-Cash Return
1.6%
Cap rate
0.3%
Rent to Value Ratio

Active
$569,900
4
bds
|
4
ba
|
2,900
sqft
|
built
1965
1720 Ithaca Ln N, Minneapolis, MN 55447
$-289
Cash flow
-2.6%
Cash-on-Cash Return
5.1%
Cap rate
0.8%
Rent to Value Ratio
Active
$699,000
5
bds
|
3
ba
|
3,168
sqft
|
built
1974
12209 Woodbine Rd, Minnetonka, MN 55305
$-1,844
Cash flow
-13.8%
Cash-on-Cash Return
2.5%
Cap rate
0.4%
Rent to Value Ratio
Active
$730,000
4
bds
|
4
ba
|
4,017
sqft
|
built
1999
865 Bayside Ln, Mound, MN 55364
$-1,178
Cash flow
-8.4%
Cash-on-Cash Return
3.7%
Cap rate
0.5%
Rent to Value Ratio
Active
$599,900
4
bds
|
3
ba
|
3,775
sqft
|
built
1951
6200 Virginia Ave S, Edina, MN 55424
$-720
Cash flow
-6.3%
Cash-on-Cash Return
4.2%
Cap rate
0.7%
Rent to Value Ratio
Active
$171,500
1
bds
|
1
ba
|
820
sqft
|
built
2003
13560 Technology Dr, Eden Prairie, MN 55344
$-156
Cash flow
-4.7%
Cash-on-Cash Return
4.6%
Cap rate
1.0%
Rent to Value Ratio

Active
$274,900
1
bds
|
1
ba
|
960
sqft
|
built
1910
250 Park Ave, Minneapolis, MN 55415
$-718
Cash flow
-13.6%
Cash-on-Cash Return
2.5%
Cap rate
0.9%
Rent to Value Ratio
Active
$510,000
5
bds
|
3
ba
|
3,208
sqft
|
built
1980
7783 Kingsview Ln N, Osseo, MN 55311
$-535
Cash flow
-5.5%
Cash-on-Cash Return
4.4%
Cap rate
0.7%
Rent to Value Ratio
Active
$285,000
3
bds
|
1
ba
|
1,429
sqft
|
built
1946
4230 Zane Ave N, Crystal, MN 55422
$-164
Cash flow
-3.0%
Cash-on-Cash Return
5.0%
Cap rate
0.8%
Rent to Value Ratio
Active
$315,000
4
bds
|
3
ba
|
2,088
sqft
|
built
1967
8040 Xenia Ave N, Minneapolis, MN 55443
$-15
Cash flow
-0.2%
Cash-on-Cash Return
5.6%
Cap rate
0.8%
Rent to Value Ratio

Active
$299,900
2
bds
|
2
ba
|
943
sqft
|
built
2005
619 8th St SE, Minneapolis, MN 55414
$-705
Cash flow
-12.3%
Cash-on-Cash Return
2.9%
Cap rate
0.7%
Rent to Value Ratio
Active
$850,000
4
bds
|
4
ba
|
2,880
sqft
|
built
2022
3822 Northern Ave, Spring Park, MN 55384
$-1,109
Cash flow
-6.8%
Cash-on-Cash Return
4.1%
Cap rate
0.5%
Rent to Value Ratio
Active
$599,900
2
bds
|
2
ba
|
1,936
sqft
|
built
2024
10054 Mulberry Ln, Rogers, MN 55374
$-417
Cash flow
-3.6%
Cash-on-Cash Return
4.8%
Cap rate
0.7%
Rent to Value Ratio

Active
$1,300,000
3
bds
|
4
ba
|
4,366
sqft
|
built
1995
16865 Terrey Pine Dr, Eden Prairie, MN 55347
$-3,744
Cash flow
-15.0%
Cash-on-Cash Return
2.2%
Cap rate
0.4%
Rent to Value Ratio
Active
$575,000
4
bds
|
4
ba
|
3,696
sqft
|
built
1988
15088 65th Pl N, Osseo, MN 55311
$-828
Cash flow
-7.5%
Cash-on-Cash Return
4.0%
Cap rate
0.6%
Rent to Value Ratio

Active
$259,000
2
bds
|
2
ba
|
1,416
sqft
|
built
1946
5123 Chicago Ave, Minneapolis, MN 55417
$-90
Cash flow
-1.8%
Cash-on-Cash Return
5.3%
Cap rate
0.8%
Rent to Value Ratio

Active
$5,250,000
6
bds
|
9
ba
|
11,851
sqft
|
built
2008
3408 Zenith Ave S, Minneapolis, MN 55416
$-26,289
Cash flow
-26.1%
Cash-on-Cash Return
-0.3%
Cap rate
0.1%
Rent to Value Ratio
Active
$1,499,000
6
bds
|
7
ba
|
7,567
sqft
|
built
2013
16302 Sohm Ct, Eden Prairie, MN 55347
$-3,626
Cash flow
-12.6%
Cash-on-Cash Return
2.8%
Cap rate
0.5%
Rent to Value Ratio

Active
$3,399,000
2
bds
|
3
ba
|
4,362
sqft
|
built
1914
700 S 2nd St, Minneapolis, MN 55401
$-21,957
Cash flow
-33.7%
Cash-on-Cash Return
-2.1%
Cap rate
0.2%
Rent to Value Ratio

Active
$765,000
8
bds
|
4
ba
|
3,553
sqft
|
built
1885
909 22nd Ave NE, Minneapolis, MN 55418
$-2,493
Cash flow
-17.0%
Cash-on-Cash Return
1.8%
Cap rate
0.4%
Rent to Value Ratio
Active
$350,000
2
bds
|
2
ba
|
1,425
sqft
|
built
2005
100 Clydesdale Trl, Hamel, MN 55340
$-786
Cash flow
-11.7%
Cash-on-Cash Return
3.0%
Cap rate
0.7%
Rent to Value Ratio
Active
$48,000
1
bds
|
1
ba
|
609
sqft
|
built
1983
7600 Golden Valley Rd, Golden Valley, MN 55427
$-125
Cash flow
-3.0%
Cash-on-Cash Return
-3.1%
Cap rate
2.3%
Rent to Value Ratio
Active
$409,900
2
bds
|
3
ba
|
1,432
sqft
|
built
2002
545 N 1st St, Minneapolis, MN 55401
$-1,314
Cash flow
-16.7%
Cash-on-Cash Return
1.8%
Cap rate
0.7%
Rent to Value Ratio

Active
$2,750,000
4
bds
|
4
ba
|
4,825
sqft
|
built
2007
4756 Kildare Rd, Mound, MN 55364
$-8,479
Cash flow
-16.1%
Cash-on-Cash Return
2.0%
Cap rate
0.3%
Rent to Value Ratio