Hennepin County Investment Properties for Sale
Browse homes for sale and investment properties in Hennepin County. Refine your search by price, property type, or more.
Best cash flowing properties in Hennepin County
Active
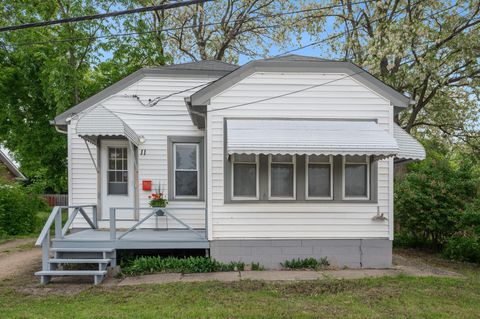
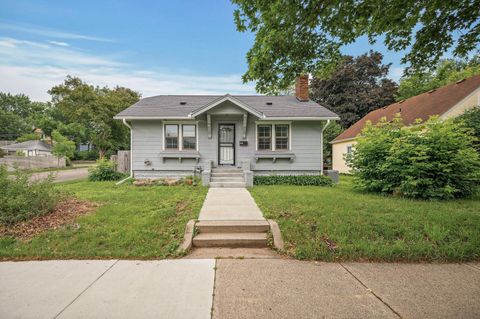
$249,900
2
bds
|
1
ba
|
1,043
sqft
|
built
1930
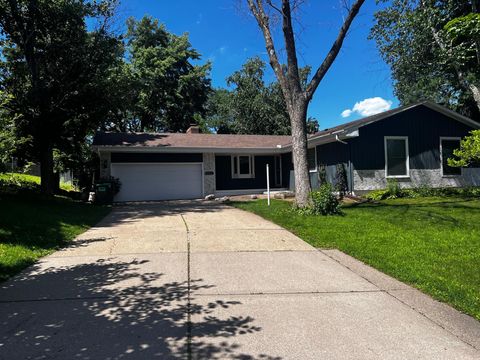
11 Blake Rd S, Hopkins, MN 55343
$146
Cash flow
3.0%
Cash-on-Cash Return
6.4%
Cap rate
0.9%
Rent to Value Ratio
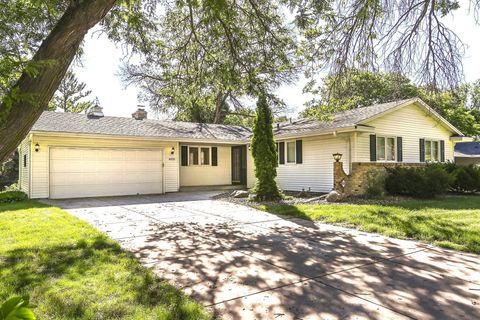
Active
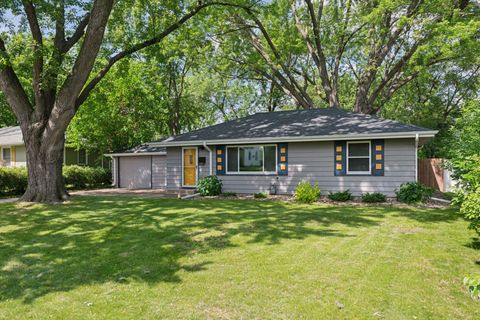
$369,900
4
bds
|
2
ba
|
1,674
sqft
|
built
1953
8204 Harriet Ave S, Bloomington, MN 55420
$-101
Cash flow
-1.4%
Cash-on-Cash Return
5.3%
Cap rate
0.8%
Rent to Value Ratio
1,774 out of 2,251 properties for sale in Hennepin County
Limited Results Shown
Create a free account, or log in to reveal all property listings and enjoy the complete experience.
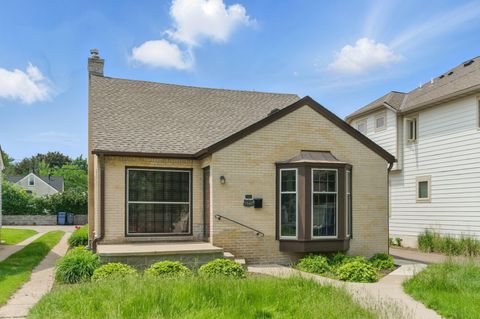
Active
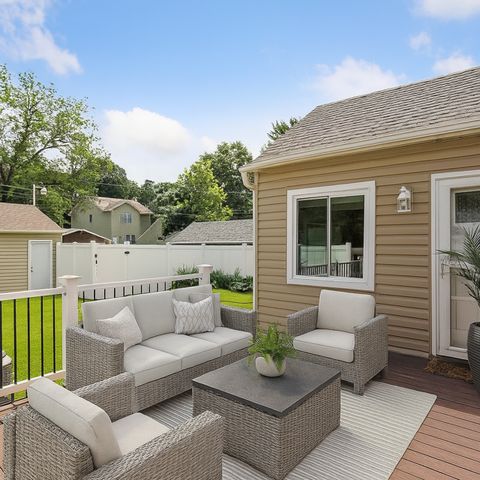
$429,900
4
bds
|
2
ba
|
1,958
sqft
|
built
1946
3137 Hampshire Ave S, Saint Louis Park, MN 55426
$-501
Cash flow
-6.1%
Cash-on-Cash Return
4.3%
Cap rate
0.7%
Rent to Value Ratio
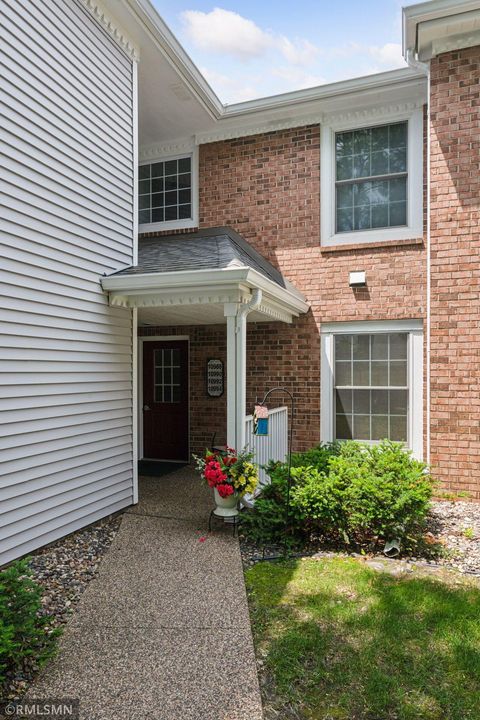
Active
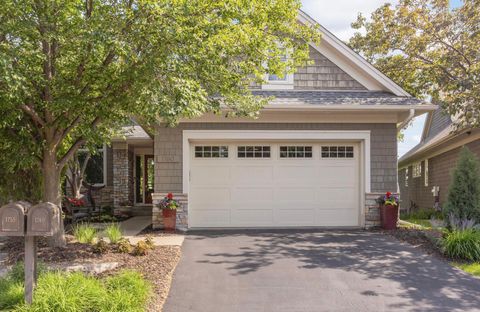
$899,900
3
bds
|
4
ba
|
3,894
sqft
|
built
2000
1760 Waterford Ct, Golden Valley, MN 55422
$-2,640
Cash flow
-15.3%
Cash-on-Cash Return
2.2%
Cap rate
0.6%
Rent to Value Ratio
Active
$699,900
4
bds
|
4
ba
|
3,841
sqft
|
built
1989
6281 Ginger Dr, Eden Prairie, MN 55346
$-1,410
Cash flow
-10.5%
Cash-on-Cash Return
3.3%
Cap rate
0.5%
Rent to Value Ratio
Active
$475,000
4
bds
|
2
ba
|
2,100
sqft
|
built
1972
2710 Garden Ln, Mound, MN 55364
$-332
Cash flow
-3.6%
Cash-on-Cash Return
4.8%
Cap rate
0.7%
Rent to Value Ratio
Active
$1,299,000
4
bds
|
4
ba
|
4,137
sqft
|
built
1955
5504 Merritt Cir, Edina, MN 55436
$-4,078
Cash flow
-16.4%
Cash-on-Cash Return
1.9%
Cap rate
0.3%
Rent to Value Ratio
Active
$424,900
3
bds
|
3
ba
|
2,438
sqft
|
built
2003
11228 W River Rd, Champlin, MN 55316
$-443
Cash flow
-5.4%
Cash-on-Cash Return
4.4%
Cap rate
0.7%
Rent to Value Ratio
Active
$340,000
2
bds
|
3
ba
|
1,808
sqft
|
built
1988
3666 Towndale Dr, Bloomington, MN 55431
$-543
Cash flow
-8.3%
Cash-on-Cash Return
3.8%
Cap rate
0.8%
Rent to Value Ratio
Active
$949,900
4
bds
|
4
ba
|
3,180
sqft
|
built
2015
312 Barry Ave N, Wayzata, MN 55391
$-2,062
Cash flow
-11.3%
Cash-on-Cash Return
3.1%
Cap rate
0.5%
Rent to Value Ratio
Active
$492,000
5
bds
|
2
ba
|
1,840
sqft
|
built
1947
4109 W 84th St, Bloomington, MN 55437
$-945
Cash flow
-10.0%
Cash-on-Cash Return
3.4%
Cap rate
0.5%
Rent to Value Ratio
Active
$650,000
3
bds
|
2
ba
|
1,775
sqft
|
built
1909
4709 Colfax Ave S, Minneapolis, MN 55419
$-1,533
Cash flow
-12.3%
Cash-on-Cash Return
2.8%
Cap rate
0.5%
Rent to Value Ratio
Active
$424,900
4
bds
|
3
ba
|
2,885
sqft
|
built
1967
4608 W 99th St, Bloomington, MN 55437
$-313
Cash flow
-3.8%
Cash-on-Cash Return
4.8%
Cap rate
0.7%
Rent to Value Ratio

Active
$220,000
2
bds
|
3
ba
|
1,200
sqft
|
built
1973
1252 Trailwood S, Hopkins, MN 55343
$-175
Cash flow
-4.2%
Cash-on-Cash Return
4.7%
Cap rate
1.0%
Rent to Value Ratio
Active
$459,900
4
bds
|
2
ba
|
2,306
sqft
|
built
1974
607 Adams St NE, Minneapolis, MN 55413
$-546
Cash flow
-6.2%
Cash-on-Cash Return
4.3%
Cap rate
0.7%
Rent to Value Ratio
Active
$2,395,000
4
bds
|
4
ba
|
4,080
sqft
|
built
1959
4113 Monterey Ave, Minneapolis, MN 55416
$-9,732
Cash flow
-21.2%
Cash-on-Cash Return
0.8%
Cap rate
0.1%
Rent to Value Ratio
Active
$194,900
2
bds
|
1
ba
|
1,272
sqft
|
built
1973
5707 80th Ave N, Brooklyn Park, MN 55443
$-256
Cash flow
-6.9%
Cash-on-Cash Return
4.1%
Cap rate
0.9%
Rent to Value Ratio
Active
$624,900
5
bds
|
4
ba
|
3,376
sqft
|
built
1986
12005 27th Ave N, Plymouth, MN 55441
$-969
Cash flow
-8.1%
Cash-on-Cash Return
3.8%
Cap rate
0.6%
Rent to Value Ratio
Active
$380,000
4
bds
|
3
ba
|
1,710
sqft
|
built
1915
4015 Queen Ave N, Minneapolis, MN 55412
$-394
Cash flow
-5.4%
Cash-on-Cash Return
4.4%
Cap rate
0.7%
Rent to Value Ratio
Active
$1,295,000
3
bds
|
4
ba
|
4,273
sqft
|
built
2012
14515 4th Ave N, Plymouth, MN 55447
$-2,679
Cash flow
-10.8%
Cash-on-Cash Return
3.2%
Cap rate
0.6%
Rent to Value Ratio
Active
$1,549,000
5
bds
|
5
ba
|
4,297
sqft
|
built
2021
4233 Halstead Bay Alcove, Excelsior, MN 55331
$-5,348
Cash flow
-18.0%
Cash-on-Cash Return
1.5%
Cap rate
0.3%
Rent to Value Ratio
Active
$269,900
3
bds
|
1
ba
|
1,539
sqft
|
built
1978
304 Lakeview Ave, Long Lake, MN 55356
$-367
Cash flow
-7.1%
Cash-on-Cash Return
4.0%
Cap rate
0.9%
Rent to Value Ratio
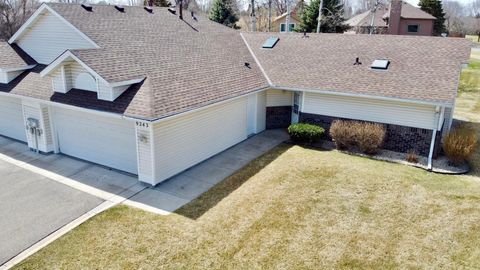
Active
$290,000
2
bds
|
2
ba
|
1,414
sqft
|
built
1991
9243 Yorkshire Ln, Brooklyn Park, MN 55443
$-405
Cash flow
-7.3%
Cash-on-Cash Return
4.0%
Cap rate
0.8%
Rent to Value Ratio
Active
$799,000
3
bds
|
2
ba
|
2,009
sqft
|
built
1987
1701 Baywood Ln, Mound, MN 55364
$-2,026
Cash flow
-13.2%
Cash-on-Cash Return
2.6%
Cap rate
0.5%
Rent to Value Ratio
Active
$530,000
4
bds
|
3
ba
|
2,309
sqft
|
built
1992
8798 Fountain Ln N, Osseo, MN 55311
$-606
Cash flow
-6.0%
Cash-on-Cash Return
4.3%
Cap rate
0.7%
Rent to Value Ratio
Active
$3,295,000
5
bds
|
5
ba
|
6,052
sqft
|
built
2006
5115 Minneapolis Ave, Minnetrista, MN 55364
$-13,454
Cash flow
-21.3%
Cash-on-Cash Return
0.8%
Cap rate
0.2%
Rent to Value Ratio
Active
$1,297,000
4
bds
|
5
ba
|
3,730
sqft
|
built
2013
6232 Virginia Ave S, Minneapolis, MN 55424
$-4,175
Cash flow
-16.8%
Cash-on-Cash Return
1.8%
Cap rate
0.4%
Rent to Value Ratio
Active
$549,900
4
bds
|
4
ba
|
3,411
sqft
|
built
1969
9610 28th Ave N, Minneapolis, MN 55441
$-732
Cash flow
-6.9%
Cash-on-Cash Return
4.1%
Cap rate
0.6%
Rent to Value Ratio
Active
$279,900
4
bds
|
2
ba
|
2,040
sqft
|
built
1922
1634 Upton Ave N, Minneapolis, MN 55411
$-326
Cash flow
-6.1%
Cash-on-Cash Return
4.3%
Cap rate
0.7%
Rent to Value Ratio
Active
$345,000
3
bds
|
2
ba
|
1,503
sqft
|
built
1924
4301 Columbus Ave, Minneapolis, MN 55407
$-589
Cash flow
-8.9%
Cash-on-Cash Return
3.6%
Cap rate
0.6%
Rent to Value Ratio
Active
$450,000
4
bds
|
3
ba
|
2,271
sqft
|
built
1966
4020 Orleans Ln N, Plymouth, MN 55441
$-714
Cash flow
-8.3%
Cash-on-Cash Return
3.8%
Cap rate
0.6%
Rent to Value Ratio
Active
$449,900
3
bds
|
2
ba
|
1,562
sqft
|
built
1941
5540 Aldrich Ave S, Minneapolis, MN 55419
$-861
Cash flow
-10.0%
Cash-on-Cash Return
3.9%
Cap rate
0.6%
Rent to Value Ratio
Active
$219,000
2
bds
|
2
ba
|
1,344
sqft
|
built
1984
10992 Quebec Ave S, Minneapolis, MN 55438
$-380
Cash flow
-9.1%
Cash-on-Cash Return
3.6%
Cap rate
0.9%
Rent to Value Ratio
Active
$289,000
1
bds
|
1
ba
|
875
sqft
|
built
2007
201 S 11th St, Minneapolis, MN 55403
$-903
Cash flow
-16.3%
Cash-on-Cash Return
2.5%
Cap rate
1.0%
Rent to Value Ratio
Active
$950,000
4
bds
|
3
ba
|
4,157
sqft
|
built
2000
13209 Holasek Ln, Eden Prairie, MN 55346
$-2,743
Cash flow
-15.1%
Cash-on-Cash Return
2.8%
Cap rate
0.5%
Rent to Value Ratio
Active
$359,000
3
bds
|
2
ba
|
1,258
sqft
|
built
1909
850 22nd Ave SE, Minneapolis, MN 55414
$-1,142
Cash flow
-16.6%
Cash-on-Cash Return
2.4%
Cap rate
0.5%
Rent to Value Ratio
Active
$1,800,000
4
bds
|
4
ba
|
3,039
sqft
|
built
2019
5721 Abbott Ave S, Edina, MN 55410
$-6,256
Cash flow
-18.1%
Cash-on-Cash Return
1.5%
Cap rate
0.3%
Rent to Value Ratio
Active
$175,000
1
bds
|
1
ba
|
771
sqft
|
built
1981
121 Washington Ave S, Minneapolis, MN 55401
$-512
Cash flow
-15.3%
Cash-on-Cash Return
2.2%
Cap rate
0.9%
Rent to Value Ratio
Active
$850,000
4
bds
|
3
ba
|
2,351
sqft
|
built
1961
4116 W 62nd St, Edina, MN 55424
$-2,160
Cash flow
-13.3%
Cash-on-Cash Return
2.6%
Cap rate
0.5%
Rent to Value Ratio
Active
$745,000
5
bds
|
4
ba
|
3,914
sqft
|
built
1992
655 Trails End Rd, Mound, MN 55364
$-1,203
Cash flow
-8.4%
Cash-on-Cash Return
3.7%
Cap rate
0.6%
Rent to Value Ratio