Hennepin County Investment Properties for Sale
Browse homes for sale and investment properties in Hennepin County. Refine your search by price, property type, or more.
Best cash flowing properties in Hennepin County

Active
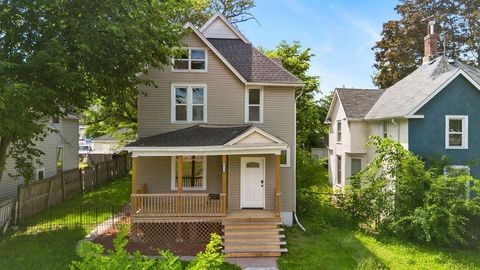
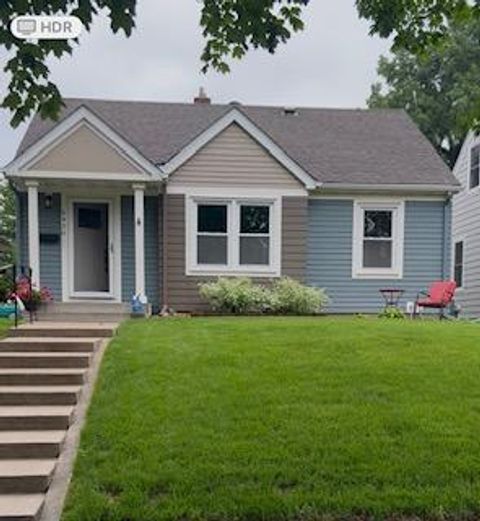
$164,900
1
bds
|
1
ba
|
611
sqft
|
built
1923
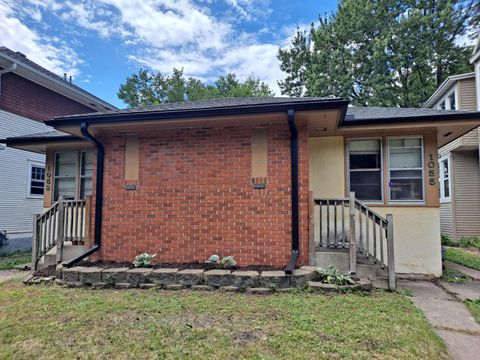
3700 Russell Ave N, Minneapolis, MN 55412
$32
Cash flow
1.0%
Cash-on-Cash Return
5.9%
Cap rate
0.9%
Rent to Value Ratio
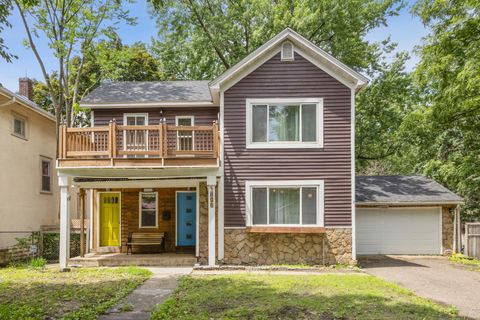
Active
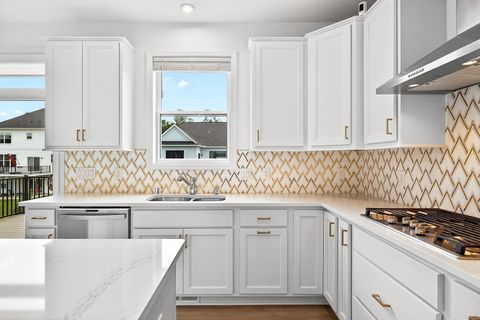
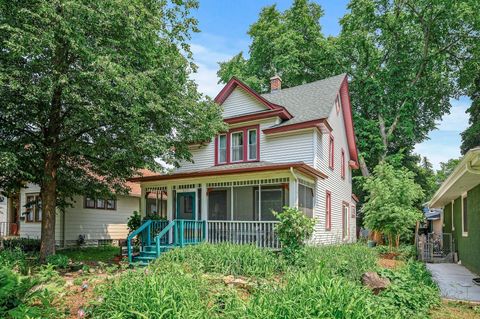
$290,000
4
bds
|
2
ba
|
1,416
sqft
|
built
1900
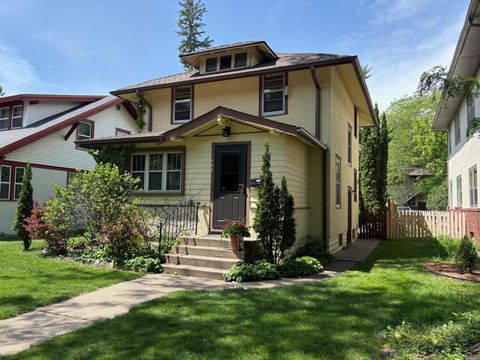
2815 Girard Ave N, Minneapolis, MN 55411
$-85
Cash flow
-1.5%
Cash-on-Cash Return
5.3%
Cap rate
0.8%
Rent to Value Ratio
1,898 out of 3,276 properties for sale in Hennepin County
Limited Results Shown
Create a free account, or log in to reveal all property listings and enjoy the complete experience.
Active
$164,900
1
bds
|
1
ba
|
611
sqft
|
built
1923
3700 Russell Ave N, Minneapolis, MN 55412
$32
Cash flow
1.0%
Cash-on-Cash Return
5.9%
Cap rate
0.9%
Rent to Value Ratio
Active
$650,000
4
bds
|
4
ba
|
2,931
sqft
|
built
2020
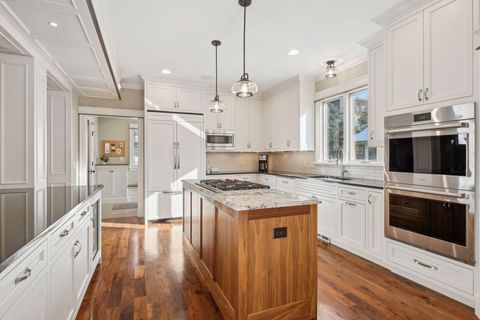
4316 Woodland Cove Pkwy, Excelsior, MN 55331
$-519
Cash flow
-4.2%
Cash-on-Cash Return
4.7%
Cap rate
0.7%
Rent to Value Ratio
Active
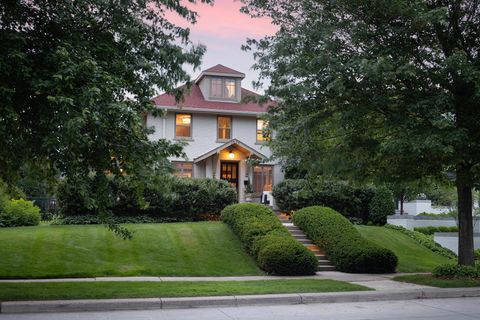
$1,895,000
4
bds
|
4
ba
|
3,836
sqft
|
built
1915
2554 W Lake Of The Isles Pkwy, Minneapolis, MN 55405
$-9,366
Cash flow
-25.8%
Cash-on-Cash Return
0.3%
Cap rate
0.2%
Rent to Value Ratio
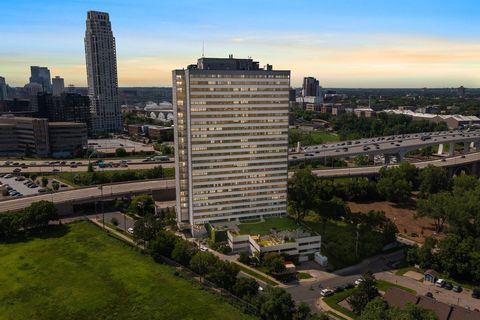
Active
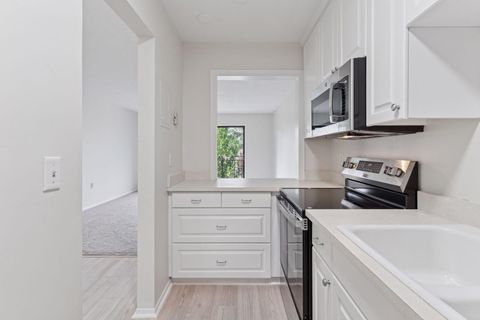
$109,900
1
bds
|
1
ba
|
764
sqft
|
built
1970
4100 Parklawn Ave, Edina, MN 55435
$-207
Cash flow
-9.8%
Cash-on-Cash Return
3.4%
Cap rate
1.4%
Rent to Value Ratio

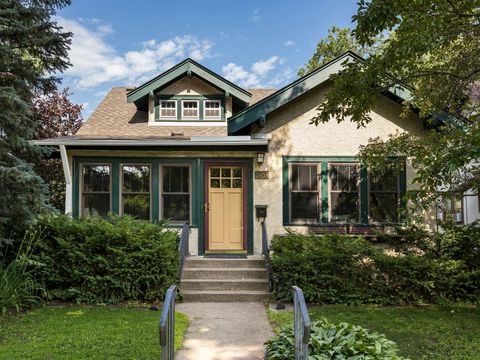
Active
$349,000
2
bds
|
1
ba
|
1,141
sqft
|
built
1908
3937 14th Ave S, Minneapolis, MN 55407
$-277
Cash flow
-4.1%
Cash-on-Cash Return
4.7%
Cap rate
0.7%
Rent to Value Ratio
Active
$1,129,900
2
bds
|
2
ba
|
2,100
sqft
|
built
2007
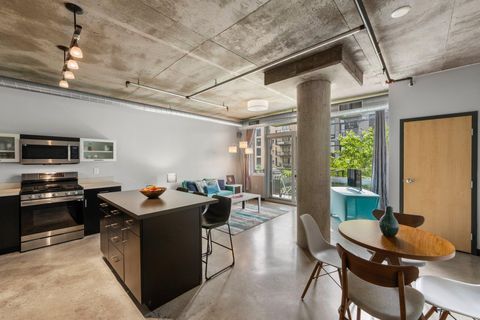
222 2nd St SE, Minneapolis, MN 55414
$-5,165
Cash flow
-23.8%
Cash-on-Cash Return
0.2%
Cap rate
0.5%
Rent to Value Ratio
Active
$469,900
3
bds
|
3
ba
|
2,250
sqft
|
built
1928
3660 45th Ave S, Minneapolis, MN 55406
$-792
Cash flow
-8.8%
Cash-on-Cash Return
3.7%
Cap rate
0.6%
Rent to Value Ratio
Active
$550,000
4
bds
|
3
ba
|
2,533
sqft
|
built
1910
2227 Grand St NE, Minneapolis, MN 55418
$-770
Cash flow
-7.3%
Cash-on-Cash Return
4.0%
Cap rate
0.6%
Rent to Value Ratio
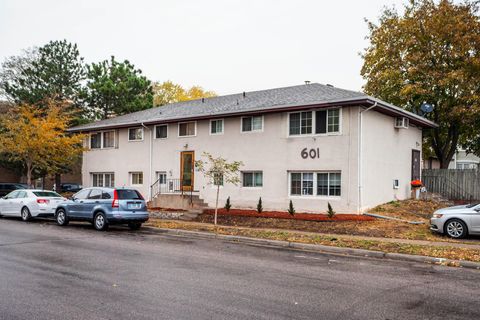
Active
$635,000
7
bds
|
4
ba
|
3,528
sqft
|
built
1964
601 Jackson St NE, Minneapolis, MN 55413
$-2,480
Cash flow
-20.4%
Cash-on-Cash Return
1.0%
Cap rate
0.3%
Rent to Value Ratio
Active
$475,000
4
bds
|
2
ba
|
1,785
sqft
|
built
1947
5450 Washburn Ave S, Minneapolis, MN 55410
$-789
Cash flow
-8.7%
Cash-on-Cash Return
3.7%
Cap rate
0.6%
Rent to Value Ratio
Active
$389,900
3
bds
|
2
ba
|
1,562
sqft
|
built
1908
3231 41st Ave S, Minneapolis, MN 55406
$-455
Cash flow
-6.1%
Cash-on-Cash Return
4.3%
Cap rate
0.6%
Rent to Value Ratio
Active
$300,000
2
bds
|
2
ba
|
1,399
sqft
|
built
1906
2535 11th Ave S, Minneapolis, MN 55404
$-444
Cash flow
-7.7%
Cash-on-Cash Return
3.9%
Cap rate
0.6%
Rent to Value Ratio
Active
$319,900
2
bds
|
2
ba
|
0
sqft
|
built
2006
929 Portland Ave, Minneapolis, MN 55404
$-880
Cash flow
-14.4%
Cash-on-Cash Return
2.4%
Cap rate
0.8%
Rent to Value Ratio
Active
$119,000
1
bds
|
1
ba
|
0
sqft
|
built
1923
2739 Girard Ave S, Minneapolis, MN 55408
$-303
Cash flow
-13.3%
Cash-on-Cash Return
2.6%
Cap rate
0.9%
Rent to Value Ratio
Active
$114,500
1
bds
|
1
ba
|
650
sqft
|
built
1973
1920 S 1st St, Minneapolis, MN 55454
$-465
Cash flow
-21.2%
Cash-on-Cash Return
0.8%
Cap rate
1.2%
Rent to Value Ratio
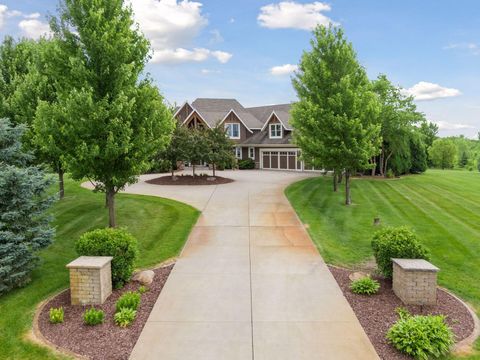
Active
$1,650,000
5
bds
|
6
ba
|
8,617
sqft
|
built
2009
7530 Quail Ridge Trl, Rockford, MN 55373
$-5,650
Cash flow
-17.9%
Cash-on-Cash Return
1.6%
Cap rate
0.3%
Rent to Value Ratio
Active
$399,900
3
bds
|
1
ba
|
1,383
sqft
|
built
1923
2433 33rd Ave S, Minneapolis, MN 55406
$-428
Cash flow
-5.6%
Cash-on-Cash Return
4.4%
Cap rate
0.7%
Rent to Value Ratio
Active
$449,000
3
bds
|
2
ba
|
1,112
sqft
|
built
1919
408 Sheridan Ave S, Minneapolis, MN 55405
$-988
Cash flow
-11.5%
Cash-on-Cash Return
3.0%
Cap rate
0.5%
Rent to Value Ratio
Active
$1,700,000
5
bds
|
5
ba
|
4,856
sqft
|
built
2013
4243 Vincent Ave S, Minneapolis, MN 55410
$-7,506
Cash flow
-23.0%
Cash-on-Cash Return
0.4%
Cap rate
0.2%
Rent to Value Ratio
Active
$359,900
4
bds
|
2
ba
|
2,506
sqft
|
built
1962
1053 12th Ave SE, Minneapolis, MN 55414
$-604
Cash flow
-8.8%
Cash-on-Cash Return
3.7%
Cap rate
0.6%
Rent to Value Ratio
Active
$295,000
1
bds
|
1
ba
|
835
sqft
|
built
2007
730 N 4th St, Minneapolis, MN 55401
$-756
Cash flow
-13.4%
Cash-on-Cash Return
2.6%
Cap rate
0.7%
Rent to Value Ratio
Active
$825,000
4
bds
|
4
ba
|
3,452
sqft
|
built
2020
7904 Shadyview Ln N, Maple Grove, MN 55311
$-724
Cash flow
-4.6%
Cash-on-Cash Return
4.6%
Cap rate
0.7%
Rent to Value Ratio
Active
$290,000
4
bds
|
2
ba
|
1,416
sqft
|
built
1900
2815 Girard Ave N, Minneapolis, MN 55411
$-85
Cash flow
-1.5%
Cash-on-Cash Return
5.3%
Cap rate
0.8%
Rent to Value Ratio

Active
$2,199,900
5
bds
|
5
ba
|
4,204
sqft
|
built
2024
4023 Beard Ave S, Minneapolis, MN 55410
$-4,838
Cash flow
-11.5%
Cash-on-Cash Return
3.0%
Cap rate
0.4%
Rent to Value Ratio
Active
$625,000
5
bds
|
3
ba
|
2,889
sqft
|
built
1977
2915 Alvarado Ln N, Plymouth, MN 55447
$-845
Cash flow
-7.1%
Cash-on-Cash Return
4.1%
Cap rate
0.6%
Rent to Value Ratio
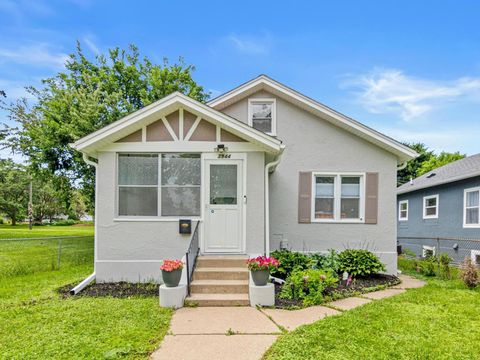
Active
$379,900
3
bds
|
2
ba
|
1,668
sqft
|
built
1927
3944 Clinton Ave, Minneapolis, MN 55409
$-463
Cash flow
-6.4%
Cash-on-Cash Return
4.2%
Cap rate
0.7%
Rent to Value Ratio
Active
$134,000
2
bds
|
1
ba
|
767
sqft
|
built
1965
4010 15th Ave S, Minneapolis, MN 55407
$-222
Cash flow
-8.6%
Cash-on-Cash Return
4.3%
Cap rate
1.2%
Rent to Value Ratio
Active
$1,200,000
5
bds
|
4
ba
|
4,780
sqft
|
built
2021
8530 Fir St, Rockford, MN 55373
$-2,632
Cash flow
-11.4%
Cash-on-Cash Return
3.0%
Cap rate
0.5%
Rent to Value Ratio

Active
$599,900
2
bds
|
2
ba
|
2,073
sqft
|
built
2001
408 N 1st St, Minneapolis, MN 55401
$-1,874
Cash flow
-16.3%
Cash-on-Cash Return
1.9%
Cap rate
0.6%
Rent to Value Ratio
Active
$890,000
4
bds
|
3
ba
|
2,854
sqft
|
built
1958
5317 Maddox Ln, Edina, MN 55436
$-2,431
Cash flow
-14.3%
Cash-on-Cash Return
2.4%
Cap rate
0.4%
Rent to Value Ratio
Active
$335,000
4
bds
|
2
ba
|
2,432
sqft
|
built
1900
1506 3rd St NE, Minneapolis, MN 55413
$-268
Cash flow
-4.2%
Cash-on-Cash Return
4.7%
Cap rate
0.9%
Rent to Value Ratio
Active
$799,900
2
bds
|
2
ba
|
1,610
sqft
|
built
2006
215 10th Ave S, Minneapolis, MN 55415
$-2,826
Cash flow
-18.4%
Cash-on-Cash Return
1.4%
Cap rate
0.5%
Rent to Value Ratio
Active
$359,900
5
bds
|
3
ba
|
2,694
sqft
|
built
1913
104 W 27th St, Minneapolis, MN 55408
$-810
Cash flow
-11.7%
Cash-on-Cash Return
3.0%
Cap rate
0.6%
Rent to Value Ratio
Active
$1,050,000
2
bds
|
4
ba
|
2,417
sqft
|
built
2019
5 Village Ln, Excelsior, MN 55331
$-2,165
Cash flow
-10.8%
Cash-on-Cash Return
3.2%
Cap rate
0.6%
Rent to Value Ratio
Active
$489,000
4
bds
|
2
ba
|
1,595
sqft
|
built
1951
4836 Bloomington Ave, Minneapolis, MN 55417
$-908
Cash flow
-9.7%
Cash-on-Cash Return
3.5%
Cap rate
0.5%
Rent to Value Ratio

Active
$319,000
1
bds
|
1
ba
|
860
sqft
|
built
1989
401 S 1st St, Minneapolis, MN 55401
$-1,057
Cash flow
-17.3%
Cash-on-Cash Return
1.7%
Cap rate
0.6%
Rent to Value Ratio

Active
$340,000
2
bds
|
2
ba
|
1,323
sqft
|
built
1909
3023 Garfield Ave, Minneapolis, MN 55408
$-493
Cash flow
-7.6%
Cash-on-Cash Return
4.5%
Cap rate
0.7%
Rent to Value Ratio
Active
$190,000
2
bds
|
1
ba
|
1,046
sqft
|
built
1982
2425 E Franklin Ave, Minneapolis, MN 55406
$-381
Cash flow
-10.5%
Cash-on-Cash Return
3.3%
Cap rate
0.8%
Rent to Value Ratio
Active
$345,000
2
bds
|
2
ba
|
1,490
sqft
|
built
2006
301 Oak Grove St, Minneapolis, MN 55403
$-917
Cash flow
-13.9%
Cash-on-Cash Return
2.5%
Cap rate
0.8%
Rent to Value Ratio
Active
$459,900
3
bds
|
3
ba
|
2,700
sqft
|
built
1986
4105 Terraceview Ln N, Plymouth, MN 55446
$-1,023
Cash flow
-11.6%
Cash-on-Cash Return
3.0%
Cap rate
0.6%
Rent to Value Ratio