Olmsted County Investment Properties for Sale
Browse homes for sale and investment properties in Olmsted County. Refine your search by price, property type, or more.
Best cash flowing properties in Olmsted County

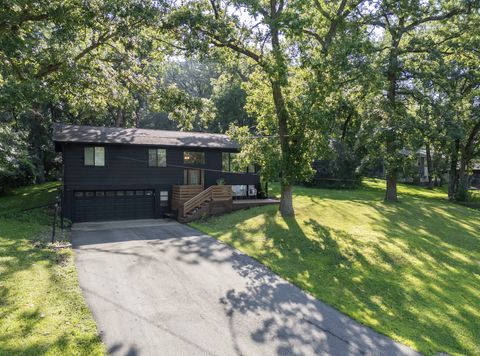
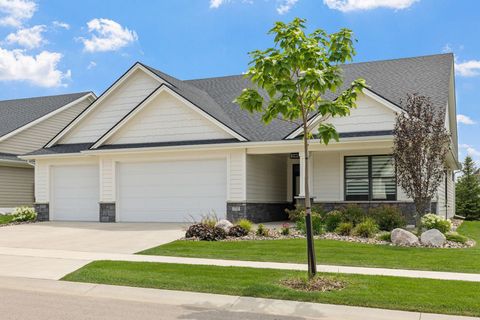
Active
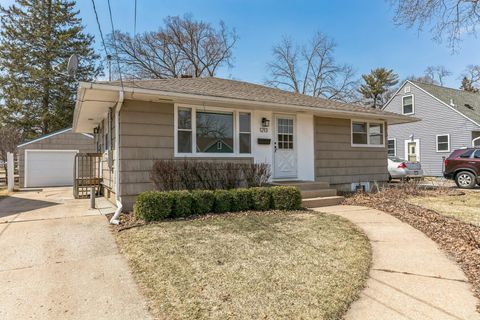
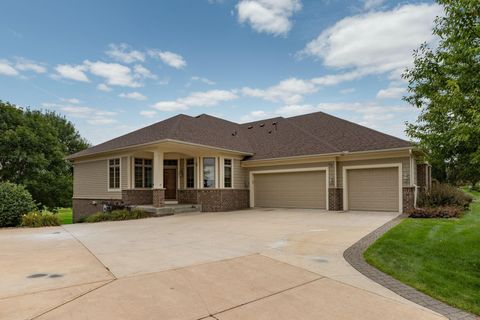
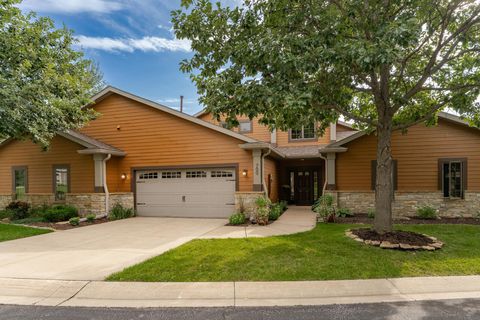
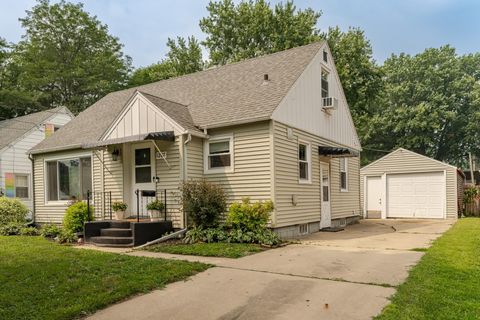
$200,000
3
bds
|
3
ba
|
2,476
sqft
|
built
1983
890 W Village Cir SE, Rochester, MN 55904
$318
Cash flow
8.3%
Cash-on-Cash Return
7.6%
Cap rate
1.1%
Rent to Value Ratio
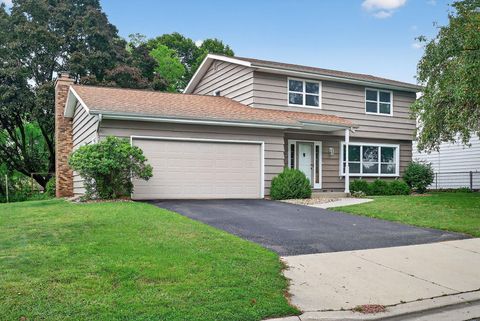
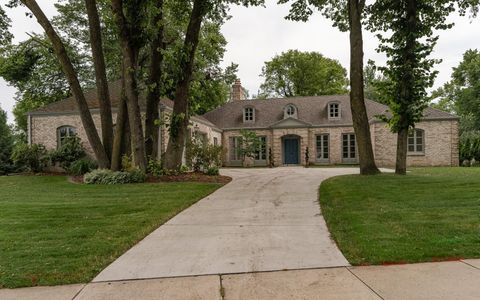
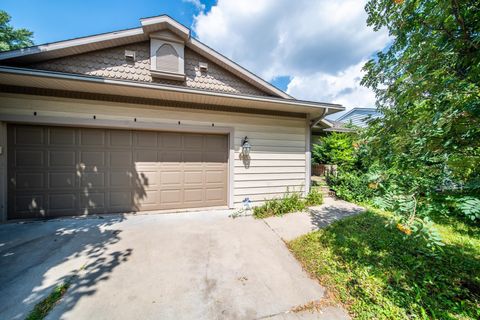
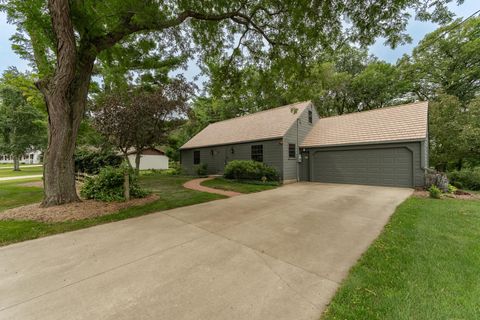
Active
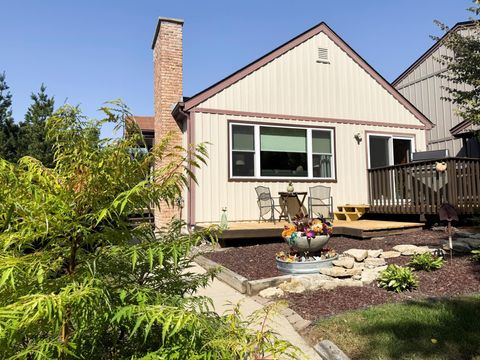
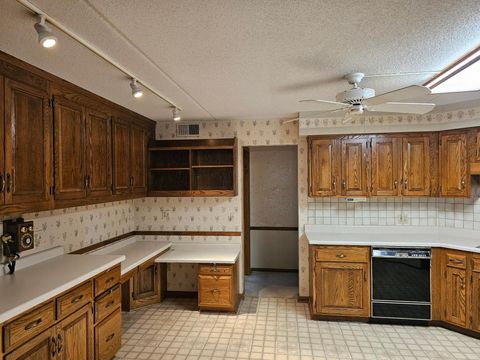
$289,000
4
bds
|
2
ba
|
1,750
sqft
|
built
1953
1213 8th Ave NW, Rochester, MN 55901
$159
Cash flow
2.9%
Cash-on-Cash Return
6.3%
Cap rate
0.9%
Rent to Value Ratio
117 out of 216 properties for sale in Olmsted County
Limited Results Shown
Create a free account, or log in to reveal all property listings and enjoy the complete experience.
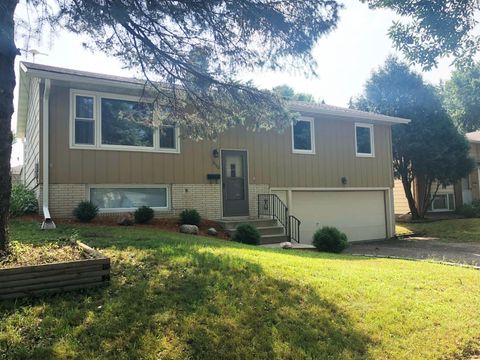
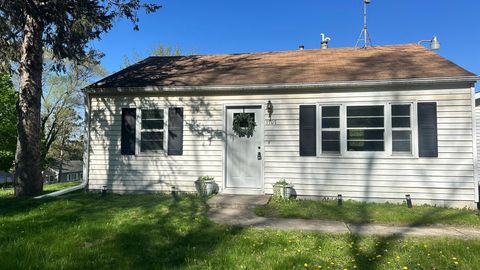
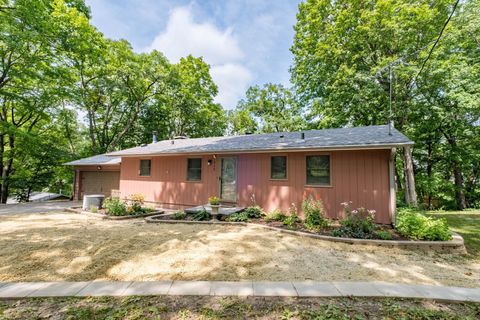
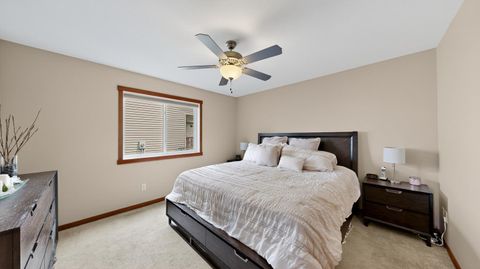
Active
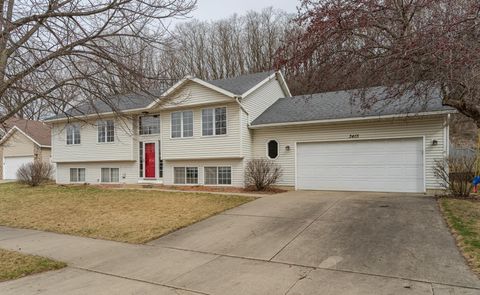
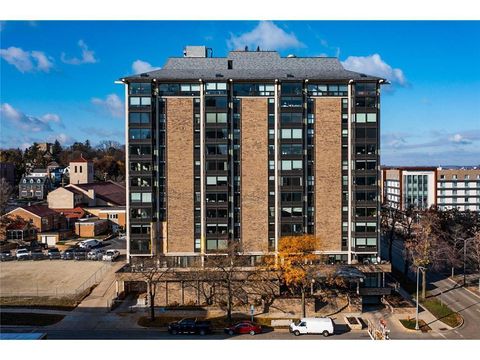
$239,900
2
bds
|
2
ba
|
1,080
sqft
|
built
1974
215 Elton Hills Dr NW, Rochester, MN 55901
$-116
Cash flow
-2.5%
Cash-on-Cash Return
5.1%
Cap rate
0.8%
Rent to Value Ratio
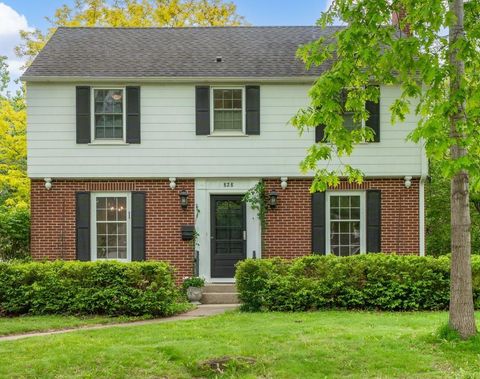
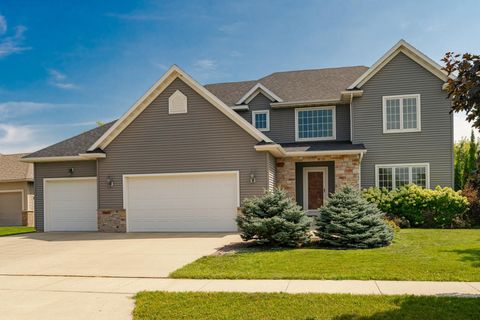
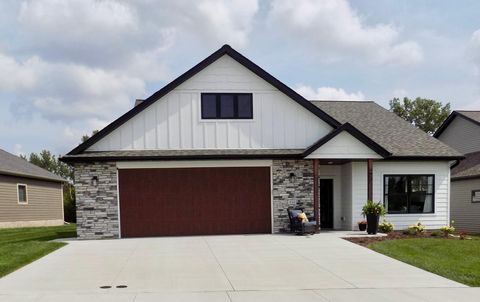
Active
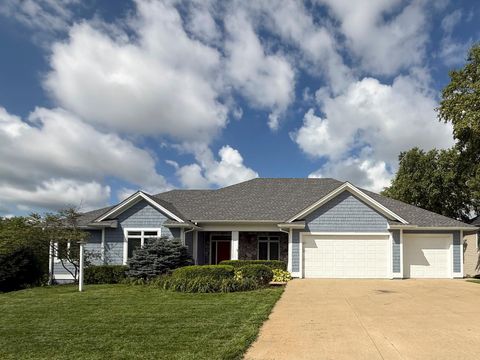
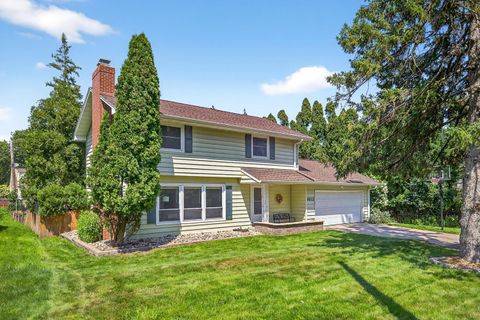
$430,000
5
bds
|
2
ba
|
2,295
sqft
|
built
1993
3415 Lake St NW, Rochester, MN 55901
$-480
Cash flow
-5.8%
Cash-on-Cash Return
4.3%
Cap rate
0.7%
Rent to Value Ratio
Active
$799,000
4
bds
|
4
ba
|
4,077
sqft
|
built
2001
2773 Clover Pl SW, Rochester, MN 55902
$-1,533
Cash flow
-10.0%
Cash-on-Cash Return
3.4%
Cap rate
0.6%
Rent to Value Ratio
Active
$579,900
2
bds
|
3
ba
|
3,069
sqft
|
built
2006
960 Somerby Pkwy NE, Byron, MN 55920
$-2,050
Cash flow
-18.4%
Cash-on-Cash Return
1.4%
Cap rate
0.5%
Rent to Value Ratio
Active
$409,900
4
bds
|
4
ba
|
2,385
sqft
|
built
1968
559 21st St NE, Rochester, MN 55906
$-532
Cash flow
-6.8%
Cash-on-Cash Return
4.1%
Cap rate
0.6%
Rent to Value Ratio
Active
$289,900
3
bds
|
2
ba
|
1,732
sqft
|
built
1965
3522 18th Ave NW, Rochester, MN 55901
$-55
Cash flow
-1.0%
Cash-on-Cash Return
5.5%
Cap rate
0.8%
Rent to Value Ratio
Active
$524,000
4
bds
|
3
ba
|
1,812
sqft
|
built
1949
828 11th St SW, Rochester, MN 55902
$-887
Cash flow
-8.8%
Cash-on-Cash Return
3.6%
Cap rate
0.6%
Rent to Value Ratio
Active
$579,000
3
bds
|
3
ba
|
3,532
sqft
|
built
1979
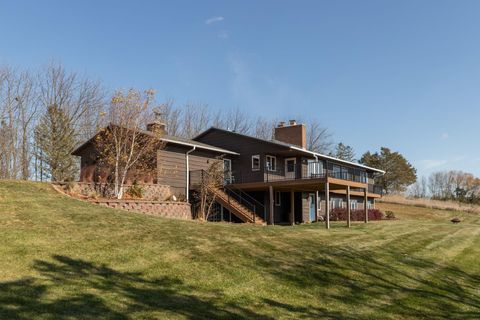
2700 115th St NW, Oronoco, MN 55960
$-942
Cash flow
-8.5%
Cash-on-Cash Return
3.7%
Cap rate
0.6%
Rent to Value Ratio
Active
$350,000
4
bds
|
3
ba
|
2,592
sqft
|
built
2006
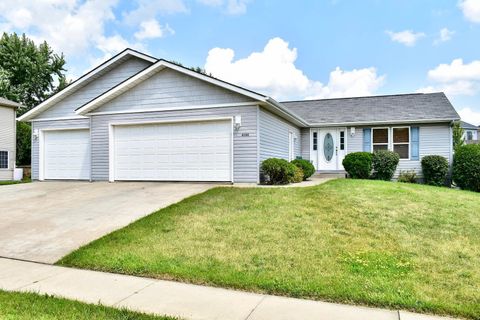
6266 Jonathan Dr NW, Rochester, MN 55901
$-319
Cash flow
-4.8%
Cash-on-Cash Return
4.6%
Cap rate
0.7%
Rent to Value Ratio
Active
$599,900
4
bds
|
3
ba
|
2,748
sqft
|
built
2002
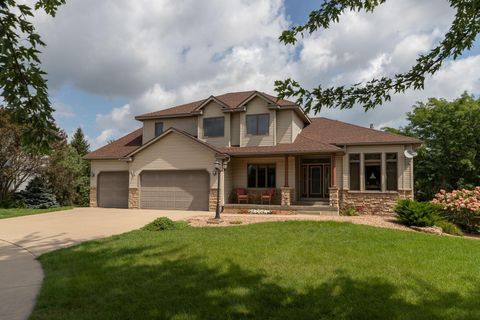
2447 Colleen Ln NE, Rochester, MN 55906
$-1,287
Cash flow
-11.2%
Cash-on-Cash Return
3.1%
Cap rate
0.5%
Rent to Value Ratio
Active
$899,900
5
bds
|
4
ba
|
5,079
sqft
|
built
2004
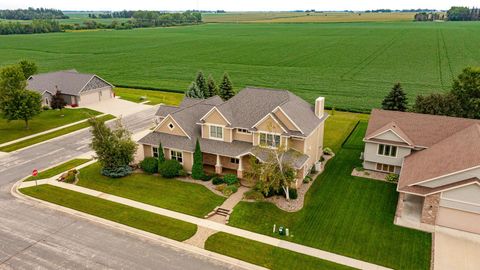
114 Prairie Stone Ct SE, Stewartville, MN 55976
$-2,713
Cash flow
-15.7%
Cash-on-Cash Return
2.1%
Cap rate
0.4%
Rent to Value Ratio
Active
$349,900
3
bds
|
2
ba
|
1,958
sqft
|
built
1966
2018 Edgewood Ct SW, Rochester, MN 55902
$-283
Cash flow
-4.2%
Cash-on-Cash Return
4.7%
Cap rate
0.7%
Rent to Value Ratio
Active
$1,150,000
5
bds
|
5
ba
|
5,650
sqft
|
built
1969
910 Folwell Dr SW, Rochester, MN 55902
$-2,120
Cash flow
-9.6%
Cash-on-Cash Return
3.5%
Cap rate
0.5%
Rent to Value Ratio
Active
$204,900
2
bds
|
1
ba
|
800
sqft
|
built
1956
1707 Hillview Ln SE, Rochester, MN 55904
$10
Cash flow
0.3%
Cash-on-Cash Return
5.7%
Cap rate
0.8%
Rent to Value Ratio
Active
$650,000
4
bds
|
3
ba
|
2,580
sqft
|
built
2008
3524 Jasper Ln NE, Rochester, MN 55906
$-1,433
Cash flow
-11.5%
Cash-on-Cash Return
3.0%
Cap rate
0.5%
Rent to Value Ratio
Active
$647,000
4
bds
|
4
ba
|
3,280
sqft
|
built
2005
700 Panorama Cir NW, Rochester, MN 55901
$-1,451
Cash flow
-11.7%
Cash-on-Cash Return
3.0%
Cap rate
0.6%
Rent to Value Ratio
Active
$360,000
4
bds
|
2
ba
|
2,246
sqft
|
built
1986
1005 21st St SE, Rochester, MN 55904
$-315
Cash flow
-4.6%
Cash-on-Cash Return
4.6%
Cap rate
0.7%
Rent to Value Ratio
Active
$499,900
3
bds
|
2
ba
|
1,716
sqft
|
built
1961
915 1st St NW, Oronoco, MN 55960
$-965
Cash flow
-10.1%
Cash-on-Cash Return
3.4%
Cap rate
0.5%
Rent to Value Ratio
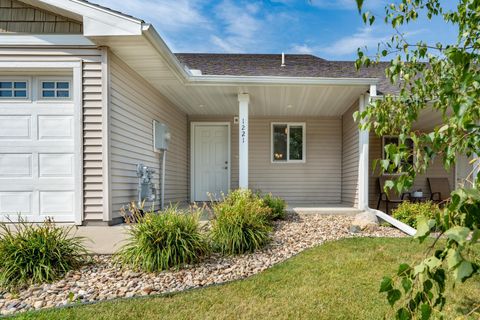
Active
$300,000
3
bds
|
3
ba
|
1,563
sqft
|
built
2017
1221 Sundance Ct NE, Byron, MN 55920
$-359
Cash flow
-6.2%
Cash-on-Cash Return
4.2%
Cap rate
0.7%
Rent to Value Ratio
Active
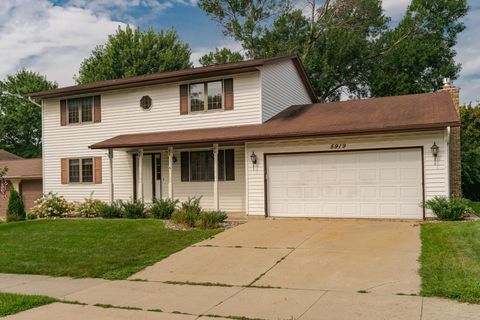
$380,000
4
bds
|
3
ba
|
2,568
sqft
|
built
1986
5919 24th Ave NW, Rochester, MN 55901
$-302
Cash flow
-4.1%
Cash-on-Cash Return
4.7%
Cap rate
0.7%
Rent to Value Ratio
Active
$644,900
4
bds
|
3
ba
|
2,494
sqft
|
built
2016
1882 Kerry Dr NE, Rochester, MN 55906
$-1,029
Cash flow
-8.3%
Cash-on-Cash Return
3.8%
Cap rate
0.6%
Rent to Value Ratio
Active
$739,900
4
bds
|
4
ba
|
3,667
sqft
|
built
1962
1103 Skyline Dr SW, Rochester, MN 55902
$-1,245
Cash flow
-8.8%
Cash-on-Cash Return
3.7%
Cap rate
0.5%
Rent to Value Ratio
Active
$579,000
6
bds
|
3
ba
|
2,731
sqft
|
built
1985
271 Sandy Point Ct NE, Rochester, MN 55906
$-884
Cash flow
-8.0%
Cash-on-Cash Return
3.8%
Cap rate
0.5%
Rent to Value Ratio
Active
$845,000
3
bds
|
2
ba
|
2,156
sqft
|
built
2021
2732 Bentley Dr SW, Rochester, MN 55902
$-1,656
Cash flow
-10.2%
Cash-on-Cash Return
3.3%
Cap rate
0.6%
Rent to Value Ratio

Active
$349,900
4
bds
|
2
ba
|
1,944
sqft
|
built
1924
919 1st St NW, Rochester, MN 55901
$-217
Cash flow
-3.2%
Cash-on-Cash Return
4.9%
Cap rate
0.7%
Rent to Value Ratio
Active
$600,000
4
bds
|
3
ba
|
2,563
sqft
|
built
1961
2645 Riverside Ln NE, Rochester, MN 55906
$-1,493
Cash flow
-13.0%
Cash-on-Cash Return
2.7%
Cap rate
0.4%
Rent to Value Ratio
Active
$399,000
4
bds
|
3
ba
|
2,065
sqft
|
built
2015
5817 Lloyd St NW, Rochester, MN 55901
$-367
Cash flow
-4.8%
Cash-on-Cash Return
4.6%
Cap rate
0.7%
Rent to Value Ratio
Active
$450,000
3
bds
|
2
ba
|
1,550
sqft
|
built
2023
510 Kodiak Dr NW, Stewartville, MN 55976
$-768
Cash flow
-8.9%
Cash-on-Cash Return
3.6%
Cap rate
0.6%
Rent to Value Ratio
Active
$459,000
4
bds
|
3
ba
|
2,683
sqft
|
built
2015
892 Brighton Dr NW, Rochester, MN 55901
$-618
Cash flow
-7.0%
Cash-on-Cash Return
4.1%
Cap rate
0.6%
Rent to Value Ratio
Active
$650,000
5
bds
|
4
ba
|
3,820
sqft
|
built
2004
5274 Southwood Dr SW, Rochester, MN 55902
$-1,560
Cash flow
-12.5%
Cash-on-Cash Return
2.8%
Cap rate
0.5%
Rent to Value Ratio
Active
$530,000
6
bds
|
3
ba
|
2,846
sqft
|
built
2005
2250 Galileo Pl SW, Rochester, MN 55902
$-644
Cash flow
-6.3%
Cash-on-Cash Return
4.2%
Cap rate
0.7%
Rent to Value Ratio
Active
$649,900
4
bds
|
5
ba
|
3,496
sqft
|
built
2006
4550 Summit Pointe Pl NW, Rochester, MN 55901
$-1,491
Cash flow
-12.0%
Cash-on-Cash Return
2.9%
Cap rate
0.5%
Rent to Value Ratio
Active
$410,000
3
bds
|
2
ba
|
1,092
sqft
|
built
1987
7320 90th St SE, Stewartville, MN 55976
$-441
Cash flow
-5.6%
Cash-on-Cash Return
4.4%
Cap rate
0.6%
Rent to Value Ratio
Active
$274,900
3
bds
|
1
ba
|
1,682
sqft
|
built
1947
1207 7th Ave NW, Rochester, MN 55901
$137
Cash flow
2.6%
Cash-on-Cash Return
6.3%
Cap rate
0.9%
Rent to Value Ratio
Active
$333,000
2
bds
|
2
ba
|
1,872
sqft
|
built
1979
600 4th St SW, Rochester, MN 55902
$-1,977
Cash flow
-31.0%
Cash-on-Cash Return
-1.4%
Cap rate
0.5%
Rent to Value Ratio
Active
$385,000
4
bds
|
3
ba
|
2,222
sqft
|
built
1966
1412 Skyline Dr SW, Rochester, MN 55902
$-230
Cash flow
-3.1%
Cash-on-Cash Return
5.0%
Cap rate
0.7%
Rent to Value Ratio
Active
$230,000
2
bds
|
2
ba
|
1,134
sqft
|
built
1969
207 5th Ave SW, Rochester, MN 55902
$-974
Cash flow
-22.1%
Cash-on-Cash Return
0.6%
Cap rate
0.9%
Rent to Value Ratio
Active
$799,990
5
bds
|
4
ba
|
3,983
sqft
|
built
2015
920 Woodlands Ln SE, Oronoco, MN 55960
$-2,136
Cash flow
-13.9%
Cash-on-Cash Return
2.5%
Cap rate
0.5%
Rent to Value Ratio