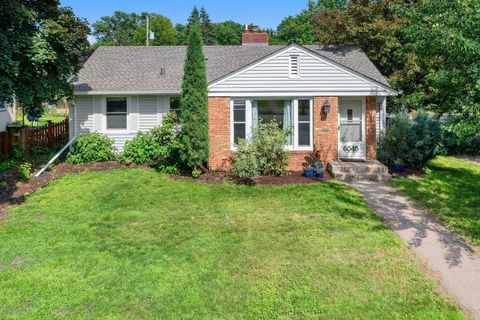
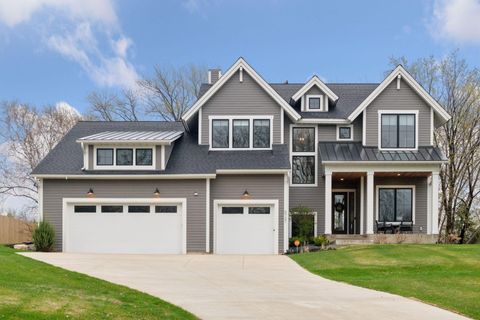
Hennepin County Investment Properties for Sale
Browse homes for sale and investment properties in Hennepin County. Refine your search by price, property type, or more.
Best cash flowing properties in Hennepin County
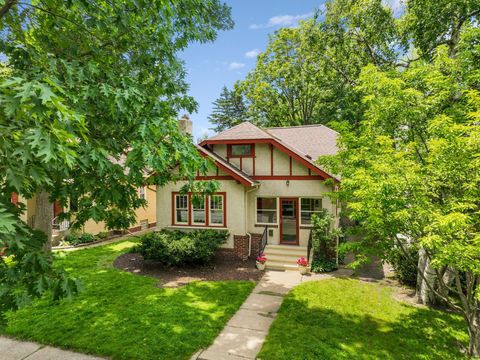
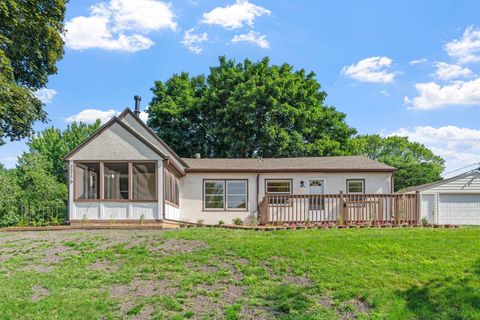
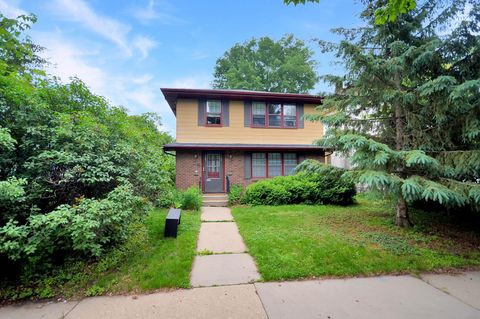
Active
$250,000
3
bds
|
1
ba
|
1,648
sqft
|
built
1925
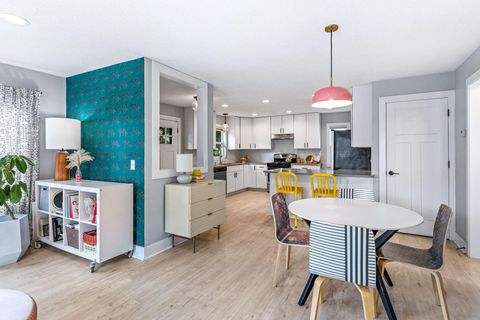
3500 James Ave N, Minneapolis, MN 55412
$142
Cash flow
3.0%
Cash-on-Cash Return
6.9%
Cap rate
1.0%
Rent to Value Ratio
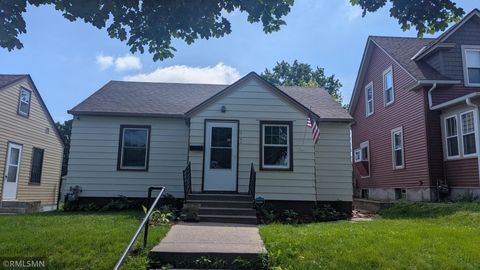
Active
$210,000
3
bds
|
1
ba
|
1,084
sqft
|
built
1910
2931 Lyndale Ave N, Minneapolis, MN 55411
$139
Cash flow
3.5%
Cash-on-Cash Return
6.5%
Cap rate
1.0%
Rent to Value Ratio
1,898 out of 3,276 properties for sale in Hennepin County
Limited Results Shown
Create a free account, or log in to reveal all property listings and enjoy the complete experience.
Active
$289,000
2
bds
|
1
ba
|
1,152
sqft
|
built
1915
3032 12th Ave S, Minneapolis, MN 55407
$-4
Cash flow
-0.1%
Cash-on-Cash Return
5.7%
Cap rate
0.8%
Rent to Value Ratio
Active
$399,000
4
bds
|
2
ba
|
1,586
sqft
|
built
1953
3636 Sumter Ave S, Minneapolis, MN 55426
$-696
Cash flow
-9.1%
Cash-on-Cash Return
3.6%
Cap rate
0.6%
Rent to Value Ratio
Active
$325,000
4
bds
|
3
ba
|
2,806
sqft
|
built
1900
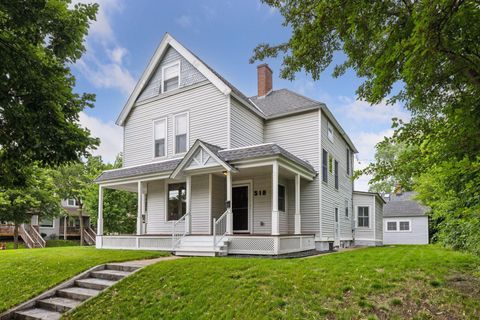
518 W 32nd St, Minneapolis, MN 55408
$-33
Cash flow
-0.5%
Cash-on-Cash Return
5.6%
Cap rate
0.9%
Rent to Value Ratio
Active
$497,473
4
bds
|
2
ba
|
1,990
sqft
|
built
1950
6045 Oakland Ave, Minneapolis, MN 55417
$-698
Cash flow
-7.3%
Cash-on-Cash Return
4.6%
Cap rate
0.7%
Rent to Value Ratio
Active
$1,840,000
4
bds
|
3
ba
|
3,095
sqft
|
built
1900
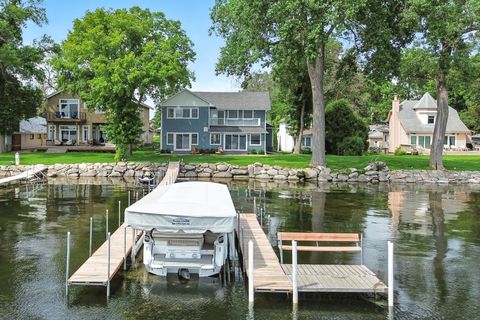
5459 Bartlett Blvd, Mound, MN 55364
$-5,701
Cash flow
-16.2%
Cash-on-Cash Return
2.0%
Cap rate
0.4%
Rent to Value Ratio
Active
$2,295,000
5
bds
|
5
ba
|
5,232
sqft
|
built
2022
5721 Olinger Rd, Edina, MN 55436
$-7,294
Cash flow
-16.6%
Cash-on-Cash Return
1.9%
Cap rate
0.4%
Rent to Value Ratio
Active
$574,900
3
bds
|
2
ba
|
1,615
sqft
|
built
1920
5044 Oliver Ave S, Minneapolis, MN 55419
$-1,531
Cash flow
-13.9%
Cash-on-Cash Return
2.5%
Cap rate
0.5%
Rent to Value Ratio
Active
$900,000
6
bds
|
5
ba
|
5,669
sqft
|
built
1889
2601 Portland Ave, Minneapolis, MN 55407
$-2,894
Cash flow
-16.8%
Cash-on-Cash Return
1.8%
Cap rate
0.3%
Rent to Value Ratio
Active
$359,900
4
bds
|
2
ba
|
1,588
sqft
|
built
1916
1104 21st Ave SE, Minneapolis, MN 55414
$-289
Cash flow
-4.2%
Cash-on-Cash Return
4.7%
Cap rate
0.7%
Rent to Value Ratio
Active
$250,000
3
bds
|
1
ba
|
1,648
sqft
|
built
1925
3500 James Ave N, Minneapolis, MN 55412
$142
Cash flow
3.0%
Cash-on-Cash Return
6.9%
Cap rate
1.0%
Rent to Value Ratio
Active
$375,000
3
bds
|
2
ba
|
1,698
sqft
|
built
1953
2527 Cleveland St NE, Minneapolis, MN 55418
$-165
Cash flow
-2.3%
Cash-on-Cash Return
5.2%
Cap rate
0.8%
Rent to Value Ratio
Active
$519,000
3
bds
|
2
ba
|
1,620
sqft
|
built
1907
2408 Grand Ave S, Minneapolis, MN 55405
$-830
Cash flow
-8.3%
Cash-on-Cash Return
3.8%
Cap rate
0.6%
Rent to Value Ratio
Active
$399,000
3
bds
|
2
ba
|
1,803
sqft
|
built
1940
5805 Sunrise Dr, Minneapolis, MN 55419
$-576
Cash flow
-7.5%
Cash-on-Cash Return
4.5%
Cap rate
0.7%
Rent to Value Ratio
Active
$399,900
3
bds
|
1
ba
|
1,051
sqft
|
built
1918
2168 Centerview Ln, Mound, MN 55364
$-643
Cash flow
-8.4%
Cash-on-Cash Return
3.7%
Cap rate
0.6%
Rent to Value Ratio
Active
$259,900
4
bds
|
2
ba
|
1,680
sqft
|
built
1900
3114 Russell Ave N, Minneapolis, MN 55411
$-58
Cash flow
-1.2%
Cash-on-Cash Return
5.4%
Cap rate
0.8%
Rent to Value Ratio
Active
$374,900
3
bds
|
2
ba
|
1,603
sqft
|
built
1900
2216 W 57th St, Minneapolis, MN 55419
$-304
Cash flow
-4.2%
Cash-on-Cash Return
4.7%
Cap rate
0.7%
Rent to Value Ratio

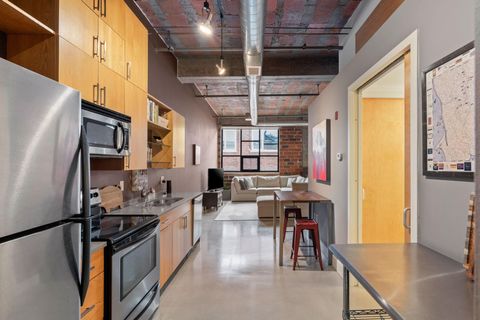
Active
$274,900
1
bds
|
1
ba
|
860
sqft
|
built
1989
401 S 1st St, Minneapolis, MN 55401
$-937
Cash flow
-17.8%
Cash-on-Cash Return
1.6%
Cap rate
0.7%
Rent to Value Ratio

Active
$749,900
4
bds
|
4
ba
|
3,199
sqft
|
built
1922
3201 Xenwood Ave S, Saint Louis Park, MN 55416
$-1,867
Cash flow
-13.0%
Cash-on-Cash Return
2.7%
Cap rate
0.4%
Rent to Value Ratio
Active
$170,000
1
bds
|
1
ba
|
656
sqft
|
built
1964
2700 W 44th St, Minneapolis, MN 55410
$-494
Cash flow
-15.2%
Cash-on-Cash Return
2.2%
Cap rate
0.9%
Rent to Value Ratio
Active
$309,000
2
bds
|
2
ba
|
1,600
sqft
|
built
2003
13832 54th Ave N, Minneapolis, MN 55446
$-457
Cash flow
-7.7%
Cash-on-Cash Return
3.9%
Cap rate
0.7%
Rent to Value Ratio
Active
$380,000
4
bds
|
2
ba
|
2,922
sqft
|
built
1960
8818 18th Ave S, Minneapolis, MN 55425
$-281
Cash flow
-3.9%
Cash-on-Cash Return
4.8%
Cap rate
0.7%
Rent to Value Ratio
Active
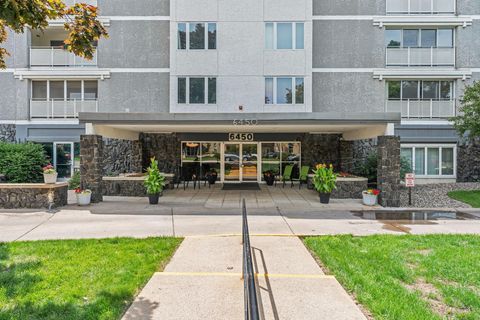
$175,000
2
bds
|
2
ba
|
1,164
sqft
|
built
1966
6450 York Ave S, Minneapolis, MN 55435
$-300
Cash flow
-8.9%
Cash-on-Cash Return
3.6%
Cap rate
1.3%
Rent to Value Ratio
Active
$2,995,000
4
bds
|
4
ba
|
4,015
sqft
|
built
2010
2172 Shadywood Rd, Wayzata, MN 55391
$-11,022
Cash flow
-19.2%
Cash-on-Cash Return
1.3%
Cap rate
0.3%
Rent to Value Ratio
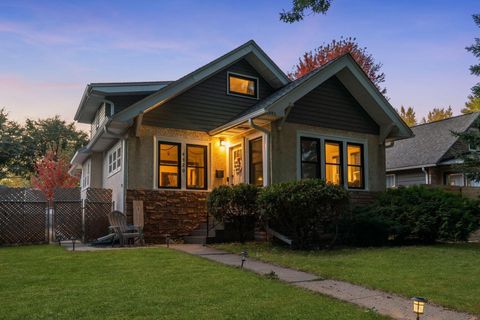
Active
$175,000
1
bds
|
1
ba
|
758
sqft
|
built
1964
1901 Emerson Ave S, Minneapolis, MN 55403
$-371
Cash flow
-11.1%
Cash-on-Cash Return
3.1%
Cap rate
0.9%
Rent to Value Ratio
Active
$550,000
3
bds
|
2
ba
|
1,455
sqft
|
built
1930
5109 17th Ave S, Minneapolis, MN 55417
$-1,173
Cash flow
-11.1%
Cash-on-Cash Return
3.1%
Cap rate
0.5%
Rent to Value Ratio
Active
$425,000
4
bds
|
2
ba
|
2,288
sqft
|
built
1967
2101 25th Ave S, Minneapolis, MN 55406
$-1,004
Cash flow
-12.3%
Cash-on-Cash Return
2.8%
Cap rate
0.6%
Rent to Value Ratio
Active
$239,900
3
bds
|
1
ba
|
1,235
sqft
|
built
1940
3742 Colfax Ave N, Minneapolis, MN 55412
$-181
Cash flow
-3.9%
Cash-on-Cash Return
4.8%
Cap rate
0.7%
Rent to Value Ratio
Active
$289,900
1
bds
|
1
ba
|
854
sqft
|
built
1922
718 Washington Ave N, Minneapolis, MN 55401
$-512
Cash flow
-9.2%
Cash-on-Cash Return
4.1%
Cap rate
0.8%
Rent to Value Ratio
Active
$545,000
4
bds
|
2
ba
|
2,163
sqft
|
built
1922
4520 41st Ave S, Minneapolis, MN 55406
$-1,135
Cash flow
-10.9%
Cash-on-Cash Return
3.8%
Cap rate
0.6%
Rent to Value Ratio

Active
$399,000
3
bds
|
2
ba
|
1,524
sqft
|
built
1953
8412 4th Ave S, Bloomington, MN 55420
$-433
Cash flow
-5.7%
Cash-on-Cash Return
4.4%
Cap rate
0.6%
Rent to Value Ratio
Active
$650,000
5
bds
|
4
ba
|
3,705
sqft
|
built
2017
11444 Creekside Ct, Maple Grove, MN 55311
$-1,160
Cash flow
-9.3%
Cash-on-Cash Return
3.5%
Cap rate
0.6%
Rent to Value Ratio
Active
$749,999
4
bds
|
2
ba
|
2,556
sqft
|
built
1910
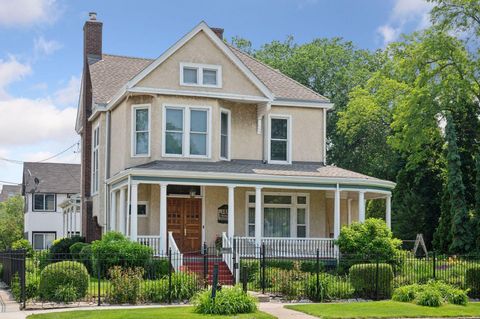
141 Rustic Ldg W, Minneapolis, MN 55419
$-2,056
Cash flow
-14.3%
Cash-on-Cash Return
2.4%
Cap rate
0.4%
Rent to Value Ratio
Active
$339,900
5
bds
|
3
ba
|
2,216
sqft
|
built
1915
1336 Russell Ave N, Minneapolis, MN 55411
$-288
Cash flow
-4.4%
Cash-on-Cash Return
4.7%
Cap rate
0.7%
Rent to Value Ratio
Active
$350,000
2
bds
|
1
ba
|
916
sqft
|
built
1959
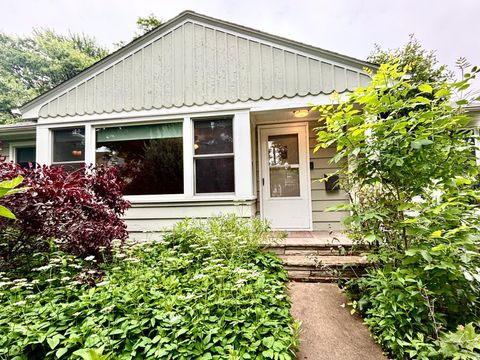
5356 29th Ave S, Minneapolis, MN 55417
$-504
Cash flow
-7.5%
Cash-on-Cash Return
3.9%
Cap rate
0.6%
Rent to Value Ratio
Active
$400,000
4
bds
|
2
ba
|
1,913
sqft
|
built
1950
3235 Ulysses St NE, Minneapolis, MN 55418
$-377
Cash flow
-4.9%
Cash-on-Cash Return
4.5%
Cap rate
0.7%
Rent to Value Ratio
Active
$644,000
2
bds
|
2
ba
|
1,907
sqft
|
built
2022
19479 102nd Pl, Rogers, MN 55374
$-1,063
Cash flow
-8.6%
Cash-on-Cash Return
3.7%
Cap rate
0.6%
Rent to Value Ratio
Active
$999,500
5
bds
|
4
ba
|
4,881
sqft
|
built
2018
4290 Inland Ln N, Minneapolis, MN 55446
$-2,322
Cash flow
-12.1%
Cash-on-Cash Return
2.9%
Cap rate
0.5%
Rent to Value Ratio
Active
$210,000
3
bds
|
1
ba
|
1,084
sqft
|
built
1910
2931 Lyndale Ave N, Minneapolis, MN 55411
$139
Cash flow
3.5%
Cash-on-Cash Return
6.5%
Cap rate
1.0%
Rent to Value Ratio

Active
$399,900
3
bds
|
2
ba
|
1,569
sqft
|
built
1920
4108 Highwood Rd, Mound, MN 55364
$-186
Cash flow
-2.4%
Cash-on-Cash Return
5.1%
Cap rate
0.7%
Rent to Value Ratio
Active
$299,900
2
bds
|
1
ba
|
1,055
sqft
|
built
1926
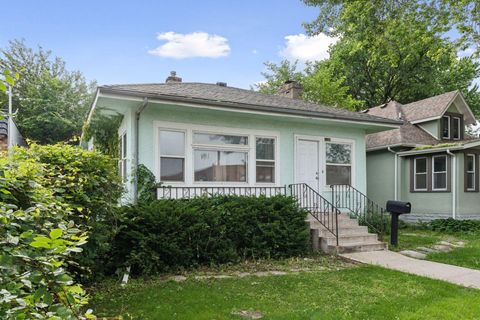
521 S 7th St, Minneapolis, MN 55415
$-339
Cash flow
-5.9%
Cash-on-Cash Return
4.3%
Cap rate
0.9%
Rent to Value Ratio