Hennepin County Investment Properties for Sale
Browse homes for sale and investment properties in Hennepin County. Refine your search by price, property type, or more.
Best cash flowing properties in Hennepin County

Active
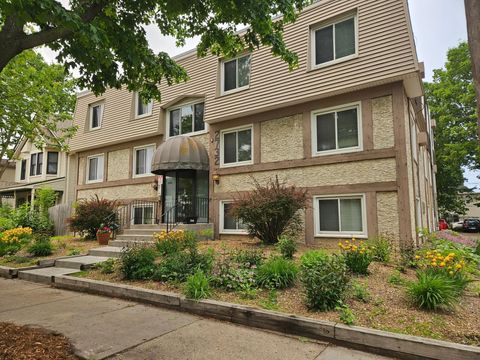
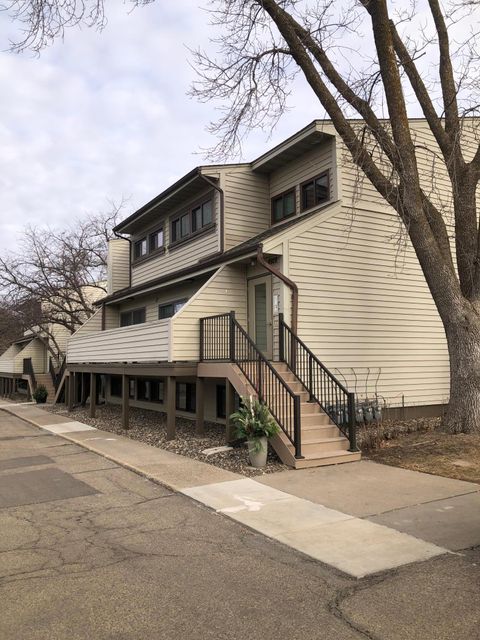
$65,000
2
bds
|
1
ba
|
983
sqft
|
built
1985
3232 Fremont Ave N, Minneapolis, MN 55412
$467
Cash flow
8.4%
Cash-on-Cash Return
8.6%
Cap rate
2.3%
Rent to Value Ratio
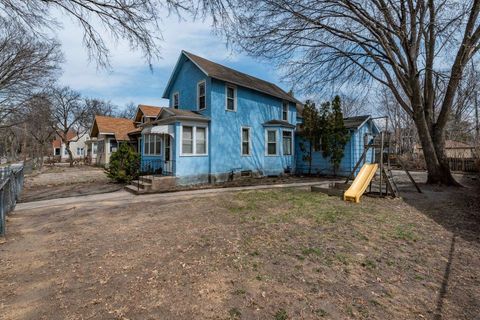
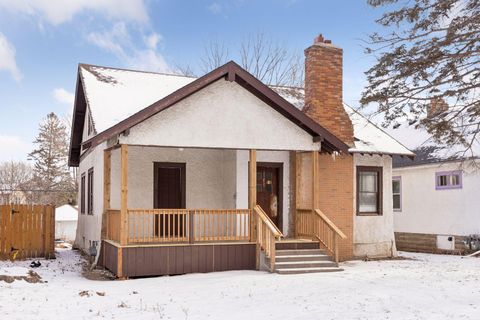
Active
$64,900
bds
|
1
ba
|
435
sqft
|
built
1966
2732 Grand Ave S, Minneapolis, MN 55408
$198
Cash flow
3.6%
Cash-on-Cash Return
3.7%
Cap rate
1.4%
Rent to Value Ratio
1,898 out of 3,276 properties for sale in Hennepin County
Limited Results Shown
Create a free account, or log in to reveal all property listings and enjoy the complete experience.
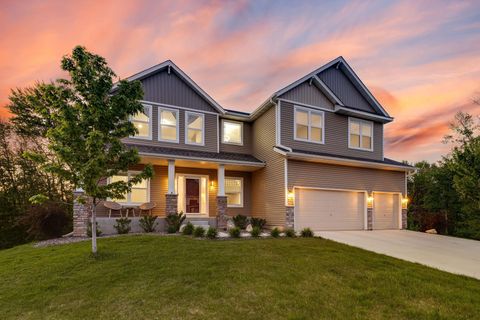
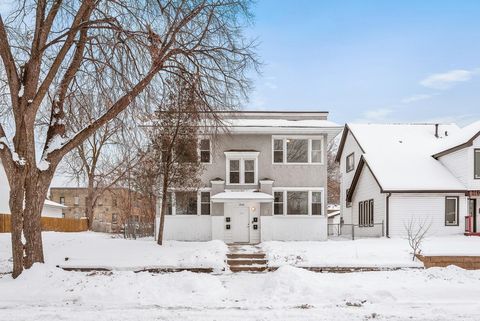
Active
$950,000
4
bds
|
4
ba
|
4,285
sqft
|
built
2019
18338 Dove Ct, Eden Prairie, MN 55347
$-1,834
Cash flow
-10.1%
Cash-on-Cash Return
3.4%
Cap rate
0.5%
Rent to Value Ratio
Active
$65,000
2
bds
|
1
ba
|
983
sqft
|
built
1985
3232 Fremont Ave N, Minneapolis, MN 55412
$467
Cash flow
8.4%
Cash-on-Cash Return
8.6%
Cap rate
2.3%
Rent to Value Ratio
Active
$1,750,000
6
bds
|
6
ba
|
7,000
sqft
|
built
2002
19115 Vogel Farm Rd, Eden Prairie, MN 55347
$-5,094
Cash flow
-15.2%
Cash-on-Cash Return
2.2%
Cap rate
0.4%
Rent to Value Ratio

Active
$395,000
3
bds
|
3
ba
|
1,128
sqft
|
built
1940
351 Morse Ave, Excelsior, MN 55331
$-606
Cash flow
-8.0%
Cash-on-Cash Return
3.8%
Cap rate
0.6%
Rent to Value Ratio
Active
$220,000
4
bds
|
2
ba
|
1,659
sqft
|
built
1897
4042 Girard Ave N, Minneapolis, MN 55412
$149
Cash flow
3.5%
Cash-on-Cash Return
6.5%
Cap rate
0.9%
Rent to Value Ratio
Active
$194,000
2
bds
|
2
ba
|
1,100
sqft
|
built
1975
8928 Neill Lake Rd, Eden Prairie, MN 55347
$-100
Cash flow
-2.7%
Cash-on-Cash Return
5.1%
Cap rate
1.1%
Rent to Value Ratio
Active
$299,999
3
bds
|
1
ba
|
1,352
sqft
|
built
1918
4317 Minnehaha Ave, Minneapolis, MN 55406
$-478
Cash flow
-8.3%
Cash-on-Cash Return
3.8%
Cap rate
0.8%
Rent to Value Ratio
Active
$525,000
3
bds
|
2
ba
|
1,920
sqft
|
built
1979
2950 Dean Pkwy, Minneapolis, MN 55416
$-2,474
Cash flow
-24.6%
Cash-on-Cash Return
0.0%
Cap rate
0.8%
Rent to Value Ratio
Active
$625,000
12
bds
|
4
ba
|
4,196
sqft
|
built
1921
1016 Newton Ave N, Minneapolis, MN 55411
$-1,302
Cash flow
-10.9%
Cash-on-Cash Return
3.2%
Cap rate
0.4%
Rent to Value Ratio

Active
$1,095,000
3
bds
|
3
ba
|
3,369
sqft
|
built
1931
2926 Ewing Ave S, Minneapolis, MN 55416
$-2,160
Cash flow
-10.3%
Cash-on-Cash Return
3.3%
Cap rate
0.6%
Rent to Value Ratio
Active
$109,900
1
bds
|
1
ba
|
1,041
sqft
|
built
1930
2615 Park Ave, Minneapolis, MN 55407
$-1,074
Cash flow
-51.0%
Cash-on-Cash Return
-6.0%
Cap rate
1.5%
Rent to Value Ratio
Active
$945,000
5
bds
|
5
ba
|
7,648
sqft
|
built
1900
1920 Pillsbury Ave S, Minneapolis, MN 55403
$-1,164
Cash flow
-6.4%
Cash-on-Cash Return
4.2%
Cap rate
0.7%
Rent to Value Ratio

Active
$234,900
1
bds
|
2
ba
|
796
sqft
|
built
2007
929 Portland Ave, Minneapolis, MN 55404
$-675
Cash flow
-15.0%
Cash-on-Cash Return
2.2%
Cap rate
0.9%
Rent to Value Ratio
Active
$175,000
1
bds
|
1
ba
|
1,006
sqft
|
built
1900
2929 Chicago Ave, Minneapolis, MN 55407
$-252
Cash flow
-7.5%
Cash-on-Cash Return
3.9%
Cap rate
1.1%
Rent to Value Ratio
Active
$625,000
2
bds
|
2
ba
|
1,539
sqft
|
built
2006
100 3rd Ave S, Minneapolis, MN 55401
$-2,036
Cash flow
-17.0%
Cash-on-Cash Return
1.8%
Cap rate
0.7%
Rent to Value Ratio
Active
$1,000,000
7
bds
|
5
ba
|
5,618
sqft
|
built
1869
424 5th St SE, Minneapolis, MN 55414
$-1,449
Cash flow
-7.6%
Cash-on-Cash Return
3.9%
Cap rate
0.6%
Rent to Value Ratio
Active
$2,775,000
5
bds
|
5
ba
|
8,269
sqft
|
built
1932
6321 Interlachen Blvd, Edina, MN 55436
$-11,070
Cash flow
-20.8%
Cash-on-Cash Return
0.9%
Cap rate
0.3%
Rent to Value Ratio

Active
$100,000
2
bds
|
1
ba
|
936
sqft
|
built
1972
8045 Xerxes Ave S, Bloomington, MN 55431
$51
Cash flow
2.7%
Cash-on-Cash Return
6.3%
Cap rate
1.6%
Rent to Value Ratio
Active
$699,000
6
bds
|
5
ba
|
4,718
sqft
|
built
1997
5061 Oxbow Pl, Champlin, MN 55316
$-855
Cash flow
-6.4%
Cash-on-Cash Return
4.2%
Cap rate
0.6%
Rent to Value Ratio

Active
$188,500
1
bds
|
1
ba
|
733
sqft
|
built
2006
15 E Franklin Ave, Minneapolis, MN 55404
$-329
Cash flow
-9.1%
Cash-on-Cash Return
3.6%
Cap rate
0.8%
Rent to Value Ratio
Active
$64,900
bds
|
1
ba
|
435
sqft
|
built
1966
2732 Grand Ave S, Minneapolis, MN 55408
$198
Cash flow
3.6%
Cash-on-Cash Return
3.7%
Cap rate
1.4%
Rent to Value Ratio

Active
$3,000,000
5
bds
|
5
ba
|
5,360
sqft
|
built
2024
5121 Blossom Ct, Edina, MN 55436
$-9,571
Cash flow
-16.6%
Cash-on-Cash Return
1.9%
Cap rate
0.3%
Rent to Value Ratio
Active
$100,000
bds
|
1
ba
|
470
sqft
|
built
1985
431 S 7th St, Minneapolis, MN 55415
$-158
Cash flow
-8.2%
Cash-on-Cash Return
3.8%
Cap rate
1.4%
Rent to Value Ratio

Active
$1,600,000
5
bds
|
5
ba
|
4,001
sqft
|
built
2025
5904 Wooddale Ave, Edina, MN 55424
$-3,879
Cash flow
-12.6%
Cash-on-Cash Return
2.8%
Cap rate
0.4%
Rent to Value Ratio

Active
$285,000
2
bds
|
2
ba
|
1,042
sqft
|
built
2005
619 8th St SE, Minneapolis, MN 55414
$-980
Cash flow
-17.9%
Cash-on-Cash Return
1.6%
Cap rate
0.6%
Rent to Value Ratio

Active
$525,000
5
bds
|
2
ba
|
1,440
sqft
|
built
1908
302 E 48th St, Minneapolis, MN 55419
$-1,447
Cash flow
-14.4%
Cash-on-Cash Return
2.4%
Cap rate
0.4%
Rent to Value Ratio

Active
$335,000
3
bds
|
2
ba
|
1,553
sqft
|
built
1983
3151 Dean Ct, Minneapolis, MN 55416
$-822
Cash flow
-12.8%
Cash-on-Cash Return
2.7%
Cap rate
0.9%
Rent to Value Ratio

Active
$209,900
1
bds
|
1
ba
|
763
sqft
|
built
1984
3054 Lake Shore Dr, Minneapolis, MN 55416
$-422
Cash flow
-10.5%
Cash-on-Cash Return
3.3%
Cap rate
0.8%
Rent to Value Ratio

Active
$83,000
2
bds
|
1
ba
|
1,066
sqft
|
built
1985
3232 Fremont Ave N, Minneapolis, MN 55412
$175
Cash flow
11.0%
Cash-on-Cash Return
8.2%
Cap rate
1.9%
Rent to Value Ratio
Active
$720,000
8
bds
|
4
ba
|
2,856
sqft
|
built
1909
2740 Lyndale Ave S, Minneapolis, MN 55408
$-3,189
Cash flow
-23.1%
Cash-on-Cash Return
0.4%
Cap rate
0.3%
Rent to Value Ratio

Active
$199,900
2
bds
|
2
ba
|
1,334
sqft
|
built
1978
9700 Portland Ave S, Bloomington, MN 55420
$-593
Cash flow
-15.5%
Cash-on-Cash Return
2.1%
Cap rate
1.1%
Rent to Value Ratio

Active
$1,750,000
5
bds
|
5
ba
|
4,016
sqft
|
built
2025
5821 Ashcroft Ave, Edina, MN 55424
$-3,996
Cash flow
-11.9%
Cash-on-Cash Return
2.9%
Cap rate
0.4%
Rent to Value Ratio
Active
$1,595,000
5
bds
|
5
ba
|
6,060
sqft
|
built
2003
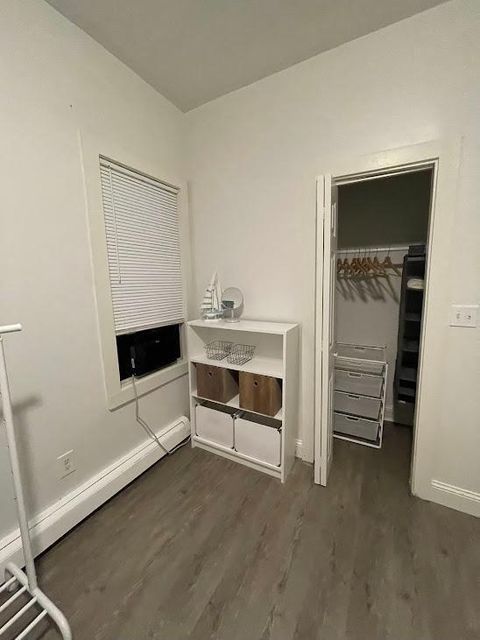
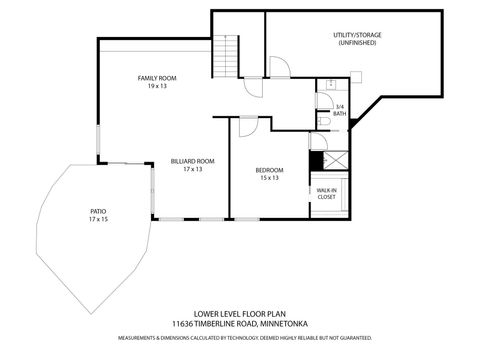
11636 Timberline Rd, Minnetonka, MN 55305
$-4,219
Cash flow
-13.8%
Cash-on-Cash Return
2.5%
Cap rate
0.5%
Rent to Value Ratio
Active
$1,886,000
5
bds
|
5
ba
|
6,108
sqft
|
built
2025
10190 Peony Ln N, Maple Grove, MN 55311
$-4,513
Cash flow
-12.5%
Cash-on-Cash Return
2.8%
Cap rate
0.5%
Rent to Value Ratio

Active
$284,900
1
bds
|
1
ba
|
875
sqft
|
built
2007
201 S 11th St, Minneapolis, MN 55403
$-1,156
Cash flow
-21.2%
Cash-on-Cash Return
0.8%
Cap rate
0.8%
Rent to Value Ratio

Active
$559,000
2
bds
|
3
ba
|
2,219
sqft
|
built
1975
1058 Cedar View Dr, Minneapolis, MN 55405
$-1,590
Cash flow
-14.8%
Cash-on-Cash Return
2.3%
Cap rate
0.6%
Rent to Value Ratio

Active
$2,875,000
5
bds
|
5
ba
|
9,017
sqft
|
built
1923
4637 E Lake Harriet Pkwy, Minneapolis, MN 55419
$-9,563
Cash flow
-17.4%
Cash-on-Cash Return
1.7%
Cap rate
0.3%
Rent to Value Ratio

Active
$229,900
1
bds
|
1
ba
|
830
sqft
|
built
2006
521 S 7th St, Minneapolis, MN 55415
$-573
Cash flow
-13.0%
Cash-on-Cash Return
2.7%
Cap rate
0.8%
Rent to Value Ratio

Active
$199,900
1
bds
|
1
ba
|
753
sqft
|
built
2004
9 W Franklin Ave, Minneapolis, MN 55404
$-270
Cash flow
-7.0%
Cash-on-Cash Return
4.1%
Cap rate
0.9%
Rent to Value Ratio
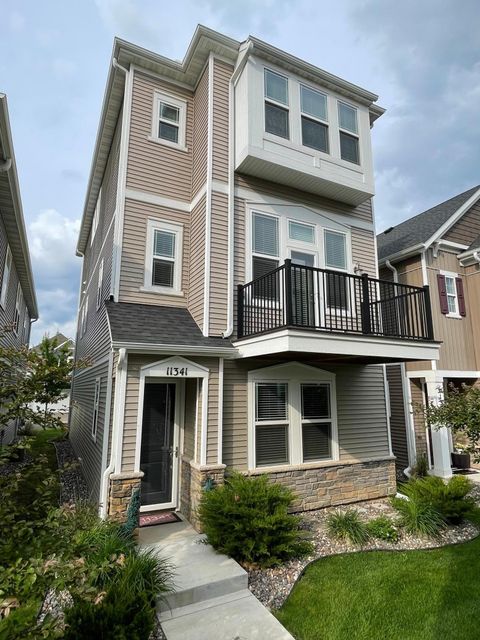
Active
$499,990
4
bds
|
4
ba
|
2,400
sqft
|
built
2018
11341 81st Way N, Maple Grove, MN 55369
$-553
Cash flow
-5.8%
Cash-on-Cash Return
4.4%
Cap rate
0.7%
Rent to Value Ratio