Hennepin County Investment Properties for Sale
Browse homes for sale and investment properties in Hennepin County. Refine your search by price, property type, or more.
Best cash flowing properties in Hennepin County

Active
$99,900
2
bds
|
1
ba
|
748
sqft
|
built
1922
2938 Penn Ave N, Minneapolis, MN 55411
$425
Cash flow
22.2%
Cash-on-Cash Return
10.8%
Cap rate
1.4%
Rent to Value Ratio

Active
$137,000
1
bds
|
1
ba
|
820
sqft
|
built
1900
2929 Chicago Ave, Minneapolis, MN 55407
$-55
Cash flow
-2.1%
Cash-on-Cash Return
5.2%
Cap rate
1.5%
Rent to Value Ratio
1,898 out of 3,276 properties for sale in Hennepin County
Limited Results Shown
Create a free account, or log in to reveal all property listings and enjoy the complete experience.

Active
$499,900
5
bds
|
4
ba
|
2,583
sqft
|
built
1900
1096 14th Ave SE, Minneapolis, MN 55414
$-671
Cash flow
-7.0%
Cash-on-Cash Return
4.1%
Cap rate
0.6%
Rent to Value Ratio
Active
$2,425,000
2
bds
|
3
ba
|
1,903
sqft
|
built
2022
255 Hennepin Ave, Minneapolis, MN 55401
$-13,432
Cash flow
-28.9%
Cash-on-Cash Return
-1.0%
Cap rate
0.3%
Rent to Value Ratio

Active
$484,900
3
bds
|
3
ba
|
1,416
sqft
|
built
1985
230 3rd Ave NE, Minneapolis, MN 55413
$-1,058
Cash flow
-11.4%
Cash-on-Cash Return
3.1%
Cap rate
0.6%
Rent to Value Ratio

Active
$135,000
1
bds
|
1
ba
|
720
sqft
|
built
1972
6710 Vernon Ave S, Edina, MN 55436
$-260
Cash flow
-10.0%
Cash-on-Cash Return
3.4%
Cap rate
1.1%
Rent to Value Ratio

Active
$595,000
2
bds
|
2
ba
|
1,490
sqft
|
built
2016
740 Portland Ave, Minneapolis, MN 55415
$-2,089
Cash flow
-18.3%
Cash-on-Cash Return
1.5%
Cap rate
0.5%
Rent to Value Ratio
Active
$2,699,000
4
bds
|
5
ba
|
4,717
sqft
|
built
2025
641 Park St E, Wayzata, MN 55391
$-9,840
Cash flow
-19.0%
Cash-on-Cash Return
1.3%
Cap rate
0.2%
Rent to Value Ratio

Active
$200,000
2
bds
|
1
ba
|
1,280
sqft
|
built
1984
7037 W 110th Street Cir, Bloomington, MN 55438
$-204
Cash flow
-5.3%
Cash-on-Cash Return
4.5%
Cap rate
1.0%
Rent to Value Ratio

Active
$129,900
2
bds
|
2
ba
|
1,250
sqft
|
built
1972
7500 Cahill Rd, Edina, MN 55439
$-273
Cash flow
-11.0%
Cash-on-Cash Return
3.2%
Cap rate
1.6%
Rent to Value Ratio

Active
$144,900
1
bds
|
1
ba
|
640
sqft
|
built
1951
2201 3rd Ave S, Minneapolis, MN 55404
$-292
Cash flow
-10.5%
Cash-on-Cash Return
3.3%
Cap rate
1.0%
Rent to Value Ratio

Active
$1,595,000
2
bds
|
3
ba
|
3,253
sqft
|
built
2007
201 S 11th St, Minneapolis, MN 55403
$-6,971
Cash flow
-22.8%
Cash-on-Cash Return
0.4%
Cap rate
0.5%
Rent to Value Ratio

Active
$154,900
2
bds
|
2
ba
|
1,050
sqft
|
built
1982
11160 Anderson Lakes Pkwy, Eden Prairie, MN 55344
$-264
Cash flow
-8.9%
Cash-on-Cash Return
3.6%
Cap rate
1.0%
Rent to Value Ratio

Active
$1,169,500
4
bds
|
4
ba
|
3,810
sqft
|
built
2025
5123 Waterbury Rd, Mound, MN 55364
$-3,507
Cash flow
-15.6%
Cash-on-Cash Return
2.1%
Cap rate
0.3%
Rent to Value Ratio

Active
$6,000,000
5
bds
|
8
ba
|
12,558
sqft
|
built
2013
10675 Cavallo Rdg, Eden Prairie, MN 55347
$-28,606
Cash flow
-24.9%
Cash-on-Cash Return
0.0%
Cap rate
0.1%
Rent to Value Ratio

Active
$7,500,000
5
bds
|
6
ba
|
9,139
sqft
|
built
2020
2552 W Lake Of The Isles Pkwy, Minneapolis, MN 55405
$-34,350
Cash flow
-23.9%
Cash-on-Cash Return
0.2%
Cap rate
0.1%
Rent to Value Ratio
Active
$3,750,000
2
bds
|
3
ba
|
2,866
sqft
|
built
2022
255 Hennepin Ave, Minneapolis, MN 55401
$-22,934
Cash flow
-31.9%
Cash-on-Cash Return
-1.7%
Cap rate
0.2%
Rent to Value Ratio

Active
$18,500,000
7
bds
|
7
ba
|
6,088
sqft
|
built
1931
8 Merilane Ave, Edina, MN 55436
$-90,095
Cash flow
-25.4%
Cash-on-Cash Return
-0.2%
Cap rate
0.0%
Rent to Value Ratio
Active
$687,455
3
bds
|
3
ba
|
1,965
sqft
|
built
2022
3822 Queensland Cir N, Plymouth, MN 55446
$-1,024
Cash flow
-7.8%
Cash-on-Cash Return
3.9%
Cap rate
0.6%
Rent to Value Ratio
Active
$99,900
2
bds
|
1
ba
|
748
sqft
|
built
1922
2938 Penn Ave N, Minneapolis, MN 55411
$425
Cash flow
22.2%
Cash-on-Cash Return
10.8%
Cap rate
1.4%
Rent to Value Ratio

Active
$1,999,900
3
bds
|
6
ba
|
5,135
sqft
|
built
2001
1700 Kenwood Pkwy, Minneapolis, MN 55405
$-5,961
Cash flow
-15.6%
Cash-on-Cash Return
2.1%
Cap rate
0.4%
Rent to Value Ratio

Active
$177,900
2
bds
|
2
ba
|
1,335
sqft
|
built
1978
9700 Portland Ave S, Bloomington, MN 55420
$-435
Cash flow
-12.8%
Cash-on-Cash Return
2.7%
Cap rate
1.2%
Rent to Value Ratio

Active
$520,000
2
bds
|
2
ba
|
1,350
sqft
|
built
2016
740 Portland Ave, Minneapolis, MN 55415
$-1,408
Cash flow
-14.1%
Cash-on-Cash Return
2.4%
Cap rate
0.7%
Rent to Value Ratio

Active
$999,900
6
bds
|
3
ba
|
4,232
sqft
|
built
1906
3013 James Ave S, Minneapolis, MN 55408
$-3,788
Cash flow
-19.8%
Cash-on-Cash Return
1.1%
Cap rate
0.3%
Rent to Value Ratio
Active
$2,795,000
7
bds
|
9
ba
|
12,182
sqft
|
built
1959
4700 Merilane Ave, Edina, MN 55436
$-10,718
Cash flow
-20.0%
Cash-on-Cash Return
1.1%
Cap rate
0.3%
Rent to Value Ratio

Active
$699,900
4
bds
|
3
ba
|
1,961
sqft
|
built
1900
3017 James Ave S, Minneapolis, MN 55408
$-1,546
Cash flow
-11.5%
Cash-on-Cash Return
3.0%
Cap rate
0.5%
Rent to Value Ratio

Active
$119,000
1
bds
|
1
ba
|
665
sqft
|
built
1985
433 S 7th St, Minneapolis, MN 55415
$-316
Cash flow
-13.9%
Cash-on-Cash Return
2.5%
Cap rate
1.3%
Rent to Value Ratio
Active
$1,340,000
4
bds
|
4
ba
|
4,732
sqft
|
built
1999
18778 Melrose Chase, Eden Prairie, MN 55347
$-2,630
Cash flow
-10.2%
Cash-on-Cash Return
3.3%
Cap rate
0.6%
Rent to Value Ratio
Active
$137,000
1
bds
|
1
ba
|
820
sqft
|
built
1900
2929 Chicago Ave, Minneapolis, MN 55407
$-55
Cash flow
-2.1%
Cash-on-Cash Return
5.2%
Cap rate
1.5%
Rent to Value Ratio

Active
$289,000
2
bds
|
2
ba
|
1,435
sqft
|
built
1980
5601 Dewey Hill Rd, Minneapolis, MN 55439
$-1,057
Cash flow
-19.1%
Cash-on-Cash Return
1.3%
Cap rate
0.8%
Rent to Value Ratio

Active
$79,900
bds
|
1
ba
|
441
sqft
|
built
1982
431 S 7th St, Minneapolis, MN 55415
$-266
Cash flow
-17.4%
Cash-on-Cash Return
1.7%
Cap rate
1.5%
Rent to Value Ratio

Active
$574,900
2
bds
|
2
ba
|
1,930
sqft
|
built
2008
201 S 11th St, Minneapolis, MN 55403
$-2,559
Cash flow
-23.2%
Cash-on-Cash Return
0.3%
Cap rate
0.8%
Rent to Value Ratio

Active
$2,995,000
6
bds
|
6
ba
|
5,495
sqft
|
built
2014
20545 Linwood Rd, Excelsior, MN 55331
$-10,658
Cash flow
-18.6%
Cash-on-Cash Return
1.4%
Cap rate
0.3%
Rent to Value Ratio

Active
$599,000
2
bds
|
2
ba
|
1,524
sqft
|
built
2018
1240 S 2nd St, Minneapolis, MN 55415
$-1,625
Cash flow
-14.2%
Cash-on-Cash Return
2.4%
Cap rate
0.7%
Rent to Value Ratio
Active
$3,750,000
5
bds
|
6
ba
|
6,379
sqft
|
built
2022
4630 Drexel Ave, Edina, MN 55424
$-13,649
Cash flow
-19.0%
Cash-on-Cash Return
1.3%
Cap rate
0.2%
Rent to Value Ratio
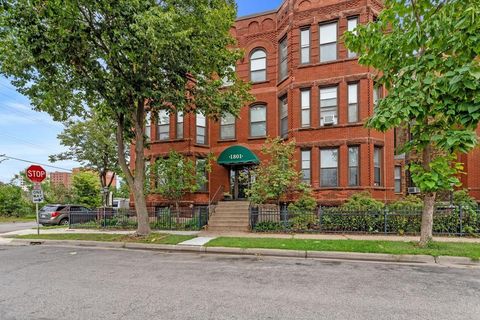
Active
$140,000
2
bds
|
1
ba
|
1,020
sqft
|
built
1891
1801 Elliot Ave, Minneapolis, MN 55404
$-745
Cash flow
-27.8%
Cash-on-Cash Return
-0.7%
Cap rate
1.1%
Rent to Value Ratio
Active
$174,900
2
bds
|
2
ba
|
1,462
sqft
|
built
1978
1225 Lasalle Ave, Minneapolis, MN 55403
$-894
Cash flow
-26.7%
Cash-on-Cash Return
-0.5%
Cap rate
1.4%
Rent to Value Ratio
Active
$2,185,000
5
bds
|
5
ba
|
3,710
sqft
|
built
2025
3836 Vincent Ave S, Minneapolis, MN 55410
$-6,751
Cash flow
-16.1%
Cash-on-Cash Return
2.0%
Cap rate
0.3%
Rent to Value Ratio
Active
$5,495,000
5
bds
|
6
ba
|
8,100
sqft
|
built
2025
5104 Mirror Lakes Dr, Edina, MN 55436
$-24,321
Cash flow
-23.1%
Cash-on-Cash Return
0.4%
Cap rate
0.1%
Rent to Value Ratio
Active
$3,595,000
6
bds
|
5
ba
|
5,999
sqft
|
built
2025
3061 Lake Shore Blvd, Wayzata, MN 55391
$-14,561
Cash flow
-21.1%
Cash-on-Cash Return
0.8%
Cap rate
0.1%
Rent to Value Ratio
Active
$1,200,000
3
bds
|
3
ba
|
3,645
sqft
|
built
1988
16400 County Road 81, Maple Grove, MN 55369
$-2,160
Cash flow
-9.4%
Cash-on-Cash Return
3.5%
Cap rate
0.5%
Rent to Value Ratio
Active
$697,590
3
bds
|
3
ba
|
1,965
sqft
|
built
2022
3826 Queensland Cir N, Plymouth, MN 55446
$-1,072
Cash flow
-8.0%
Cash-on-Cash Return
3.8%
Cap rate
0.6%
Rent to Value Ratio