Hennepin County Investment Properties for Sale
Browse homes for sale and investment properties in Hennepin County. Refine your search by price, property type, or more.
Best cash flowing properties in Hennepin County

Active
$95,000
2
bds
|
1
ba
|
980
sqft
|
built
1972
8045 Xerxes Ave S, Bloomington, MN 55431
$-130
Cash flow
-7.1%
Cash-on-Cash Return
4.0%
Cap rate
1.5%
Rent to Value Ratio
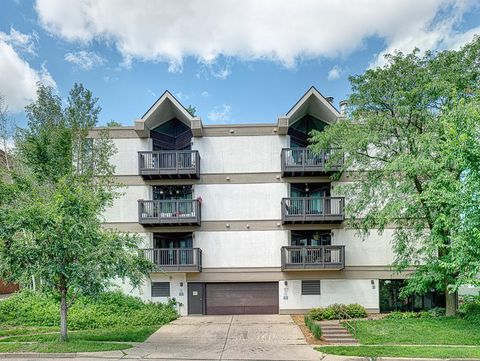
Active
$165,000
1
bds
|
1
ba
|
950
sqft
|
built
1982
232 W Franklin Ave, Minneapolis, MN 55404
$-369
Cash flow
-11.7%
Cash-on-Cash Return
3.0%
Cap rate
0.9%
Rent to Value Ratio
1,898 out of 3,276 properties for sale in Hennepin County
Limited Results Shown
Create a free account, or log in to reveal all property listings and enjoy the complete experience.
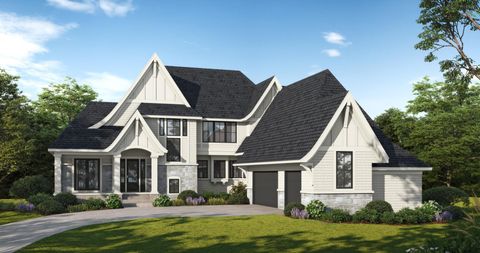
Active
$2,495,000
5
bds
|
5
ba
|
5,950
sqft
|
built
2024
2203 Oakland Rd, Minnetonka, MN 55305
$-6,662
Cash flow
-13.9%
Cash-on-Cash Return
2.5%
Cap rate
0.3%
Rent to Value Ratio
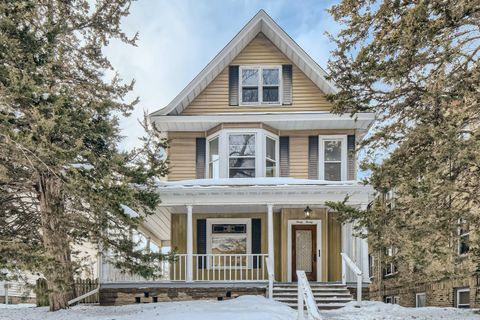
Active
$590,000
6
bds
|
3
ba
|
3,692
sqft
|
built
1900
3020 James Ave S, Minneapolis, MN 55408
$-2,061
Cash flow
-18.2%
Cash-on-Cash Return
1.5%
Cap rate
0.3%
Rent to Value Ratio
Active
$95,000
2
bds
|
1
ba
|
980
sqft
|
built
1972
8045 Xerxes Ave S, Bloomington, MN 55431
$-130
Cash flow
-7.1%
Cash-on-Cash Return
4.0%
Cap rate
1.5%
Rent to Value Ratio

Active
$1,149,900
3
bds
|
4
ba
|
3,162
sqft
|
built
2022
21412 Poate Ct, Rogers, MN 55374
$-1,166
Cash flow
-5.3%
Cash-on-Cash Return
4.5%
Cap rate
0.6%
Rent to Value Ratio
Active
$3,295,000
5
bds
|
5
ba
|
8,161
sqft
|
built
1917
2740 W Lake Of The Isles Pkwy, Minneapolis, MN 55416
$-16,599
Cash flow
-26.3%
Cash-on-Cash Return
-0.4%
Cap rate
0.2%
Rent to Value Ratio
Active
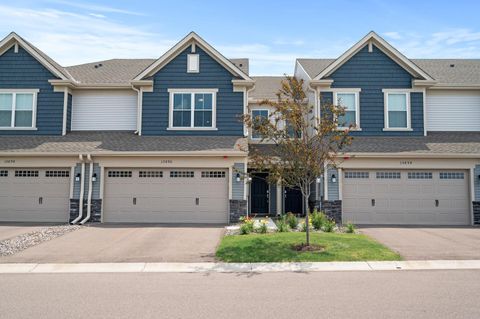
$390,000
3
bds
|
3
ba
|
1,777
sqft
|
built
2022
10896 Territorial Trl, Maple Grove, MN 55369
$-489
Cash flow
-6.5%
Cash-on-Cash Return
4.2%
Cap rate
0.7%
Rent to Value Ratio
Active
$279,900
3
bds
|
2
ba
|
1,268
sqft
|
built
1965
15 S 1st St, Minneapolis, MN 55401
$-866
Cash flow
-16.1%
Cash-on-Cash Return
2.0%
Cap rate
1.0%
Rent to Value Ratio
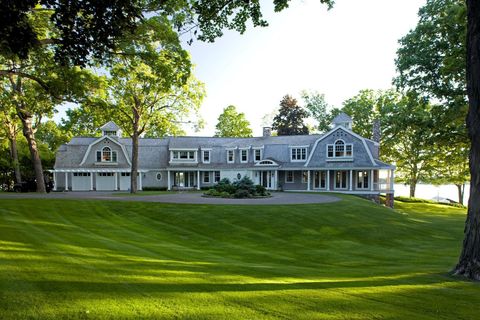
Active
$9,995,000
4
bds
|
6
ba
|
9,683
sqft
|
built
1999
1655 Bohns Point Rd, Wayzata, MN 55391
$-49,624
Cash flow
-25.9%
Cash-on-Cash Return
-0.3%
Cap rate
0.1%
Rent to Value Ratio
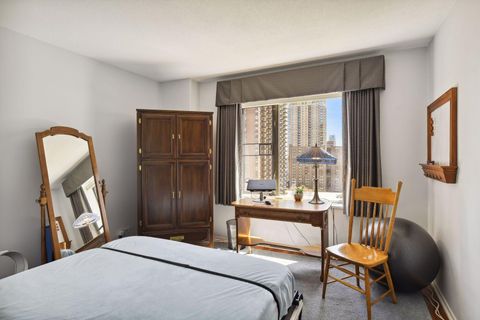
Active
$165,000
1
bds
|
1
ba
|
950
sqft
|
built
1982
232 W Franklin Ave, Minneapolis, MN 55404
$-369
Cash flow
-11.7%
Cash-on-Cash Return
3.0%
Cap rate
0.9%
Rent to Value Ratio
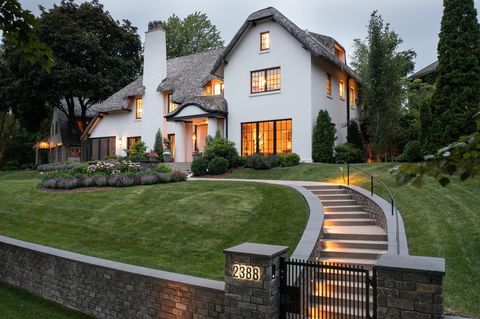
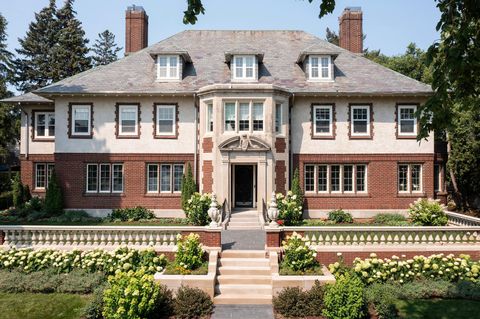
Active
$4,599,000
4
bds
|
5
ba
|
5,465
sqft
|
built
1922
2388 W Lake Of The Isles Pkwy, Minneapolis, MN 55405
$-18,976
Cash flow
-21.5%
Cash-on-Cash Return
0.7%
Cap rate
0.2%
Rent to Value Ratio
Active
$1,350,000
2
bds
|
3
ba
|
1,848
sqft
|
built
2005
345 6th Ave N, Minneapolis, MN 55401
$-4,738
Cash flow
-18.3%
Cash-on-Cash Return
1.5%
Cap rate
0.4%
Rent to Value Ratio

Active
$1,695,000
5
bds
|
5
ba
|
6,692
sqft
|
built
2000
18815 Bearpath Trl, Eden Prairie, MN 55347
$-4,343
Cash flow
-13.4%
Cash-on-Cash Return
2.6%
Cap rate
0.5%
Rent to Value Ratio
Active
$1,995,000
2
bds
|
3
ba
|
2,093
sqft
|
built
2018
275 Lake St E, Wayzata, MN 55391
$-8,137
Cash flow
-21.3%
Cash-on-Cash Return
0.8%
Cap rate
0.3%
Rent to Value Ratio

Active
$1,875,000
1
bds
|
2
ba
|
1,710
sqft
|
built
2022
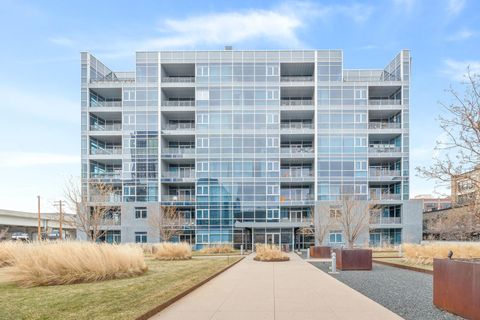
255 Hennepin Ave, Minneapolis, MN 55401
$-9,122
Cash flow
-25.4%
Cash-on-Cash Return
-0.2%
Cap rate
0.3%
Rent to Value Ratio

Active
$215,000
2
bds
|
2
ba
|
1,140
sqft
|
built
1973
1920 S 1st St, Minneapolis, MN 55454
$-714
Cash flow
-17.3%
Cash-on-Cash Return
1.7%
Cap rate
1.0%
Rent to Value Ratio
Active
$10,995,000
6
bds
|
12
ba
|
19,893
sqft
|
built
1988
17950 Breezy Point Rd, Wayzata, MN 55391
$-53,496
Cash flow
-25.4%
Cash-on-Cash Return
-0.2%
Cap rate
0.1%
Rent to Value Ratio

Active
$669,900
3
bds
|
3
ba
|
2,938
sqft
|
built
2024
8124 Eden Prairie Rd, Eden Prairie, MN 55347
$-825
Cash flow
-6.4%
Cash-on-Cash Return
4.2%
Cap rate
0.6%
Rent to Value Ratio
Active
$6,900,000
3
bds
|
4
ba
|
4,332
sqft
|
built
2022
255 Hennepin Ave, Minneapolis, MN 55401
$-38,293
Cash flow
-29.0%
Cash-on-Cash Return
-1.0%
Cap rate
0.1%
Rent to Value Ratio