Hennepin County Investment Properties for Sale
Browse homes for sale and investment properties in Hennepin County. Refine your search by price, property type, or more.
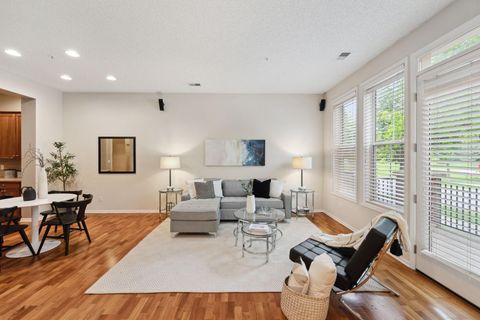
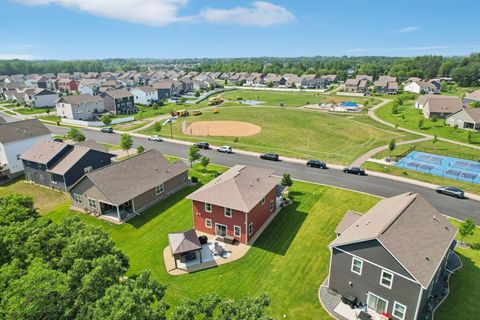
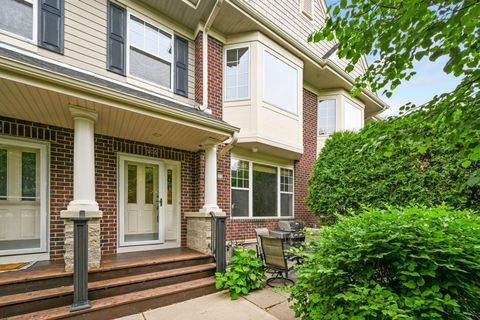
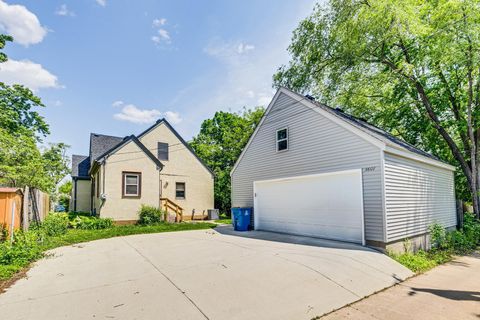
Best cash flowing properties in Hennepin County
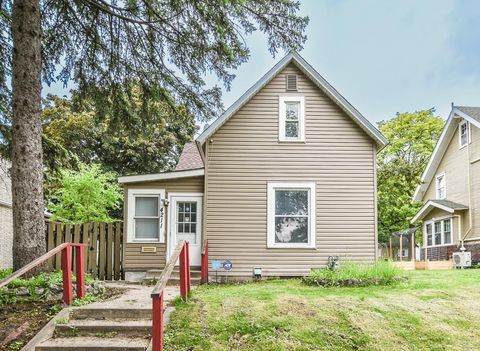
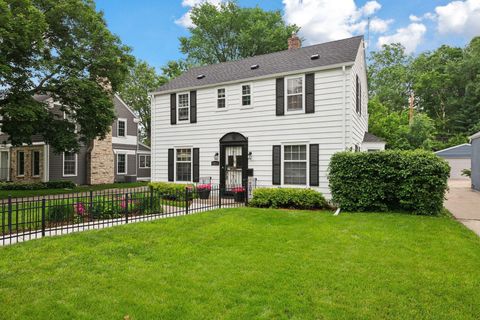
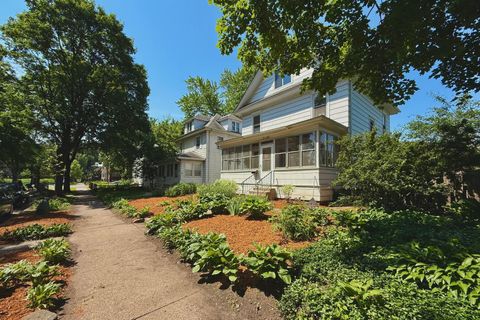
Active
$255,000
4
bds
|
2
ba
|
1,674
sqft
|
built
1900
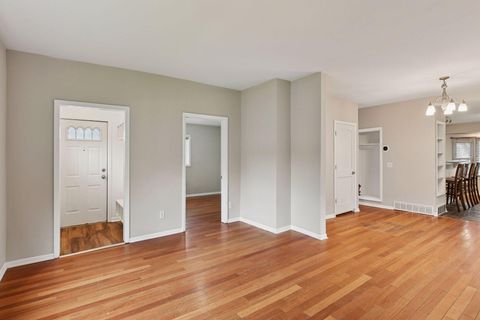
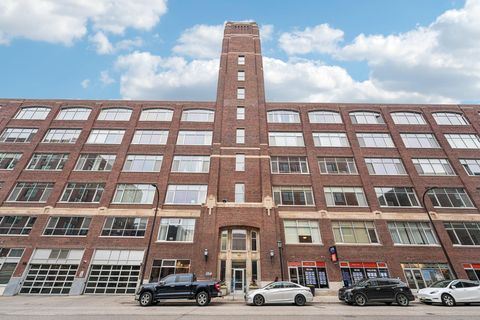
4211 Emerson Ave N, Minneapolis, MN 55412
$187
Cash flow
3.8%
Cash-on-Cash Return
7.1%
Cap rate
0.9%
Rent to Value Ratio

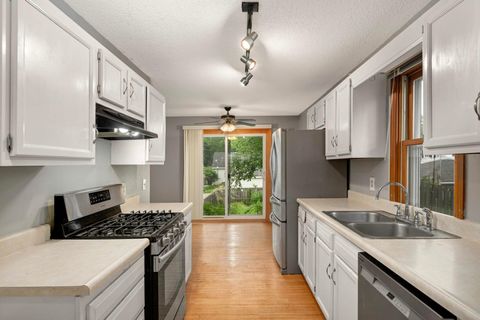
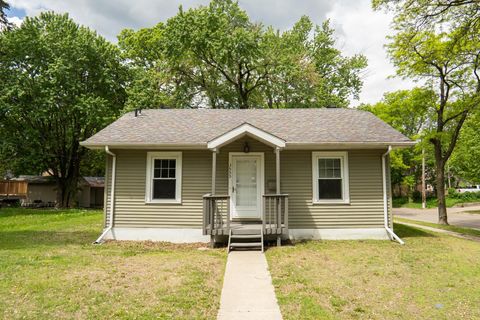
Active
$205,000
2
bds
|
1
ba
|
1,158
sqft
|
built
1916
3612 Newton Ave N, Minneapolis, MN 55412
$89
Cash flow
2.3%
Cash-on-Cash Return
6.2%
Cap rate
1.0%
Rent to Value Ratio
1,741 out of 2,210 properties for sale in Hennepin County
Limited Results Shown
Create a free account, or log in to reveal all property listings and enjoy the complete experience.
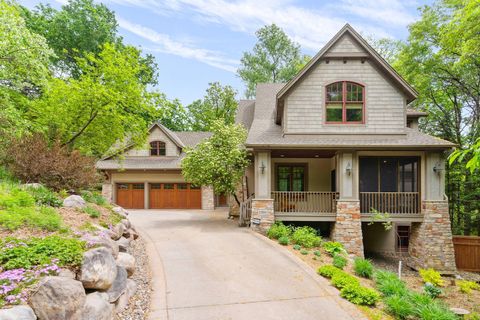
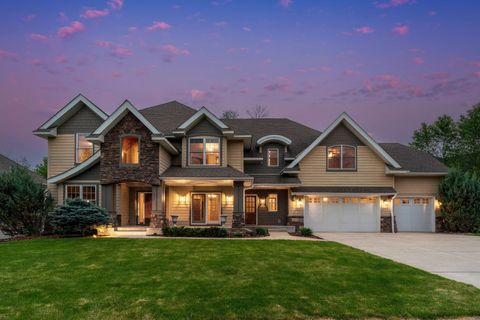
Active
$3,290,000
5
bds
|
4
ba
|
4,607
sqft
|
built
2024
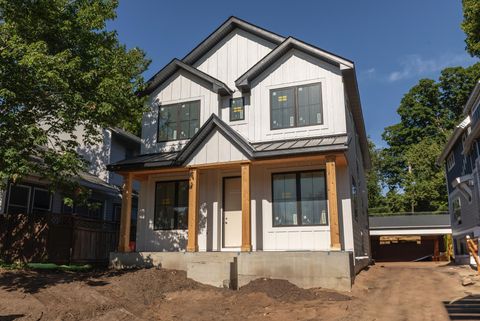
4919 Three Points Blvd, Mound, MN 55364
$-13,373
Cash flow
-21.2%
Cash-on-Cash Return
0.8%
Cap rate
0.2%
Rent to Value Ratio

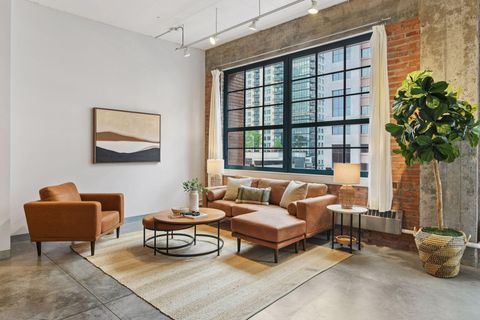
Active
$969,000
2
bds
|
2
ba
|
1,686
sqft
|
built
1915
525 3rd St N, Minneapolis, MN 55401
$-3,088
Cash flow
-16.6%
Cash-on-Cash Return
1.9%
Cap rate
0.5%
Rent to Value Ratio
Active
$440,000
2
bds
|
2
ba
|
1,404
sqft
|
built
1977
1145 Xene Ln N, Plymouth, MN 55447
$-887
Cash flow
-10.5%
Cash-on-Cash Return
3.3%
Cap rate
0.7%
Rent to Value Ratio
Active
$239,900
2
bds
|
2
ba
|
1,135
sqft
|
built
1992
2040 Shenandoah Ct, Plymouth, MN 55447
$-355
Cash flow
-7.7%
Cash-on-Cash Return
3.9%
Cap rate
0.9%
Rent to Value Ratio
Active
$369,900
4
bds
|
2
ba
|
2,044
sqft
|
built
1900
724 Pierce St NE, Minneapolis, MN 55413
$-215
Cash flow
-3.0%
Cash-on-Cash Return
5.0%
Cap rate
0.8%
Rent to Value Ratio
Active
$1,649,900
5
bds
|
4
ba
|
3,165
sqft
|
built
2025
4425 Zenith Ave S, Minneapolis, MN 55410
$-6,256
Cash flow
-19.8%
Cash-on-Cash Return
1.1%
Cap rate
0.2%
Rent to Value Ratio
Active
$358,000
5
bds
|
2
ba
|
1,529
sqft
|
built
1959
6318 Perry Ave N, Brooklyn Center, MN 55429
$-605
Cash flow
-8.8%
Cash-on-Cash Return
3.7%
Cap rate
0.6%
Rent to Value Ratio

Active
$349,900
5
bds
|
2
ba
|
1,652
sqft
|
built
1900
2106 University Ave NE, Minneapolis, MN 55418
$-87
Cash flow
-1.3%
Cash-on-Cash Return
5.4%
Cap rate
0.8%
Rent to Value Ratio
Active
$525,000
4
bds
|
3
ba
|
2,293
sqft
|
built
1969
18520 29th Ave N, Plymouth, MN 55447
$-629
Cash flow
-6.3%
Cash-on-Cash Return
4.2%
Cap rate
0.6%
Rent to Value Ratio

Active
$1,199,000
2
bds
|
2
ba
|
2,024
sqft
|
built
2013
415 Indian Mound St, Wayzata, MN 55391
$-4,440
Cash flow
-19.3%
Cash-on-Cash Return
1.2%
Cap rate
0.4%
Rent to Value Ratio
Active
$389,000
2
bds
|
2
ba
|
1,580
sqft
|
built
2006
5900 Oxford St, Minneapolis, MN 55416
$-971
Cash flow
-13.0%
Cash-on-Cash Return
3.3%
Cap rate
0.7%
Rent to Value Ratio
Active
$474,900
4
bds
|
3
ba
|
2,103
sqft
|
built
2021
11505 Pineridge Way N, Dayton, MN 55327
$-779
Cash flow
-8.6%
Cash-on-Cash Return
4.3%
Cap rate
0.7%
Rent to Value Ratio
Active
$385,000
2
bds
|
2
ba
|
1,600
sqft
|
built
2002
1550 Zarthan Ave S, Saint Louis Park, MN 55416
$-843
Cash flow
-11.4%
Cash-on-Cash Return
3.6%
Cap rate
0.7%
Rent to Value Ratio
Active
$389,000
4
bds
|
3
ba
|
1,924
sqft
|
built
1932
3807 Hubbard Ave N, Robbinsdale, MN 55422
$-262
Cash flow
-3.5%
Cash-on-Cash Return
4.9%
Cap rate
0.7%
Rent to Value Ratio
Active
$1,699,000
4
bds
|
5
ba
|
4,925
sqft
|
built
2002
1501 June Ave S, Golden Valley, MN 55416
$-5,279
Cash flow
-16.2%
Cash-on-Cash Return
2.0%
Cap rate
0.4%
Rent to Value Ratio
Active
$339,900
2
bds
|
1
ba
|
1,168
sqft
|
built
1900
250 Park Ave, Minneapolis, MN 55415
$-999
Cash flow
-15.3%
Cash-on-Cash Return
2.2%
Cap rate
0.8%
Rent to Value Ratio

Active
$850,000
6
bds
|
3
ba
|
2,766
sqft
|
built
1927
1913 E River Pkwy, Minneapolis, MN 55414
$-2,268
Cash flow
-13.9%
Cash-on-Cash Return
2.5%
Cap rate
0.5%
Rent to Value Ratio

Active
$450,000
5
bds
|
2
ba
|
2,139
sqft
|
built
1984
11430 47th Ave N, Plymouth, MN 55442
$-399
Cash flow
-4.6%
Cash-on-Cash Return
4.6%
Cap rate
0.7%
Rent to Value Ratio

Active
$484,900
3
bds
|
3
ba
|
3,051
sqft
|
built
2001
22087 Jasmine Way, Rogers, MN 55374
$-591
Cash flow
-6.4%
Cash-on-Cash Return
4.2%
Cap rate
0.6%
Rent to Value Ratio
Active
$618,000
3
bds
|
3
ba
|
2,399
sqft
|
built
1940
2613 Inglewood Ave S, Saint Louis Park, MN 55416
$-1,076
Cash flow
-9.1%
Cash-on-Cash Return
3.6%
Cap rate
0.6%
Rent to Value Ratio

Active
$1,245,000
5
bds
|
5
ba
|
5,000
sqft
|
built
2013
4475 Bluebell Trl S, Medina, MN 55340
$-3,558
Cash flow
-14.9%
Cash-on-Cash Return
2.2%
Cap rate
0.4%
Rent to Value Ratio
Active
$250,000
2
bds
|
2
ba
|
1,017
sqft
|
built
1920
5709 26th Ave S, Minneapolis, MN 55417
$-46
Cash flow
-1.0%
Cash-on-Cash Return
5.5%
Cap rate
0.8%
Rent to Value Ratio
Active
$295,000
1
bds
|
1
ba
|
775
sqft
|
built
1920
700 Washington Ave N, Minneapolis, MN 55401
$-760
Cash flow
-13.4%
Cash-on-Cash Return
2.6%
Cap rate
0.7%
Rent to Value Ratio
Active
$1,425,000
6
bds
|
6
ba
|
6,450
sqft
|
built
2013
15525 53rd Ave N, Plymouth, MN 55446
$-3,188
Cash flow
-11.7%
Cash-on-Cash Return
3.0%
Cap rate
0.5%
Rent to Value Ratio

Active
$465,000
2
bds
|
2
ba
|
1,093
sqft
|
built
2018
1240 S 2nd St, Minneapolis, MN 55415
$-1,199
Cash flow
-13.5%
Cash-on-Cash Return
2.6%
Cap rate
0.7%
Rent to Value Ratio
Active
$1,295,000
4
bds
|
4
ba
|
4,357
sqft
|
built
1987
19435 Cottagewood Rd, Excelsior, MN 55331
$-3,783
Cash flow
-15.2%
Cash-on-Cash Return
2.2%
Cap rate
0.4%
Rent to Value Ratio

Active
$425,000
4
bds
|
2
ba
|
1,705
sqft
|
built
1941
3259 Zarthan Ave S, Minneapolis, MN 55416
$-295
Cash flow
-3.6%
Cash-on-Cash Return
4.8%
Cap rate
0.7%
Rent to Value Ratio
Active
$129,900
1
bds
|
1
ba
|
937
sqft
|
built
1985
2601 Kenzie Ter, Minneapolis, MN 55418
$-359
Cash flow
-14.4%
Cash-on-Cash Return
2.9%
Cap rate
1.2%
Rent to Value Ratio
Active
$729,900
5
bds
|
4
ba
|
3,593
sqft
|
built
2021
6419 Alvarado Ln N, Maple Grove, MN 55311
$-1,407
Cash flow
-10.1%
Cash-on-Cash Return
4.0%
Cap rate
0.6%
Rent to Value Ratio
Active
$719,900
4
bds
|
4
ba
|
3,569
sqft
|
built
2001
17299 66th Pl N, Osseo, MN 55311
$-1,291
Cash flow
-9.4%
Cash-on-Cash Return
3.5%
Cap rate
0.6%
Rent to Value Ratio
Active
$345,000
4
bds
|
3
ba
|
2,664
sqft
|
built
1956
5456 Twin Lake Blvd E, Brooklyn Center, MN 55429
$-320
Cash flow
-4.8%
Cash-on-Cash Return
4.6%
Cap rate
0.7%
Rent to Value Ratio

Active
$1,675,000
5
bds
|
5
ba
|
4,950
sqft
|
built
2026
25480 Smithtown Rd, Excelsior, MN 55331
$-6,333
Cash flow
-19.7%
Cash-on-Cash Return
1.1%
Cap rate
0.2%
Rent to Value Ratio
Active
$105,000
1
bds
|
1
ba
|
704
sqft
|
built
1969
917 11th Ave S, Hopkins, MN 55343
$-145
Cash flow
-7.2%
Cash-on-Cash Return
4.0%
Cap rate
1.0%
Rent to Value Ratio
Active
$549,900
4
bds
|
2
ba
|
2,229
sqft
|
built
1909
3140 Fremont Ave S, Minneapolis, MN 55408
$-1,220
Cash flow
-11.6%
Cash-on-Cash Return
3.0%
Cap rate
0.5%
Rent to Value Ratio

Active
$375,000
3
bds
|
2
ba
|
1,275
sqft
|
built
1950
2800 Alabama Ave S, Saint Louis Park, MN 55416
$-311
Cash flow
-4.3%
Cash-on-Cash Return
4.7%
Cap rate
0.7%
Rent to Value Ratio
Active
$259,900
3
bds
|
2
ba
|
1,540
sqft
|
built
1924
3555 Queen Ave N, Minneapolis, MN 55412
$-104
Cash flow
-2.1%
Cash-on-Cash Return
5.8%
Cap rate
0.8%
Rent to Value Ratio
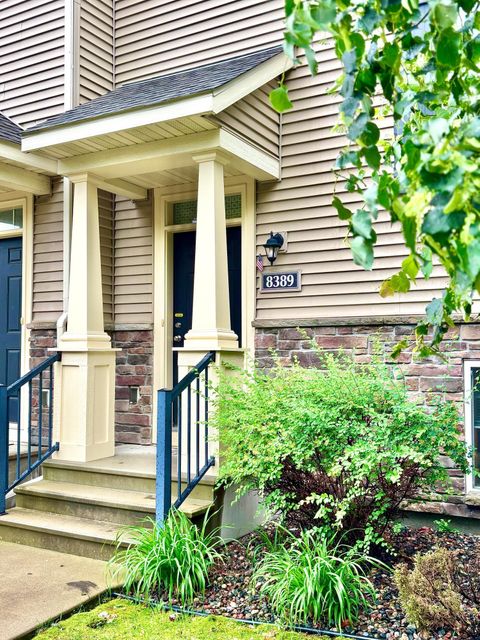
Active
$387,000
4
bds
|
4
ba
|
1,933
sqft
|
built
2010
8389 Norwood Ln N, Maple Grove, MN 55369
$-779
Cash flow
-10.5%
Cash-on-Cash Return
3.8%
Cap rate
0.7%
Rent to Value Ratio
Active
$1,650,000
4
bds
|
5
ba
|
5,268
sqft
|
built
2022
16216 Gleason Lake Rd, Wayzata, MN 55391
$-6,927
Cash flow
-21.9%
Cash-on-Cash Return
0.6%
Cap rate
0.1%
Rent to Value Ratio