Olmsted County Investment Properties for Sale
Browse homes for sale and investment properties in Olmsted County. Refine your search by price, property type, or more.
Best cash flowing properties in Olmsted County
Active
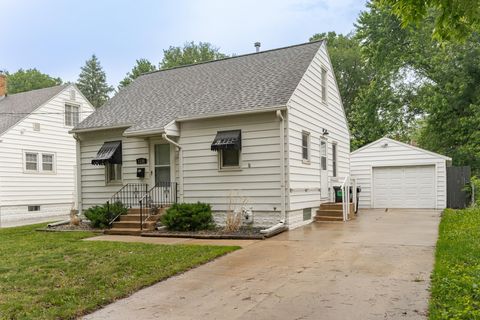
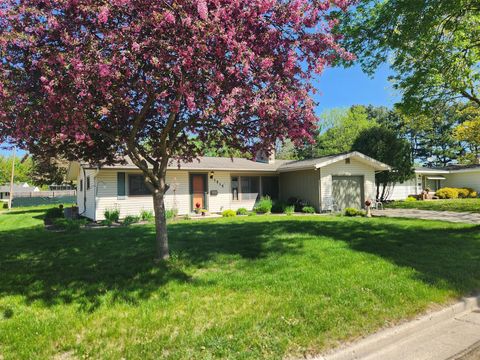
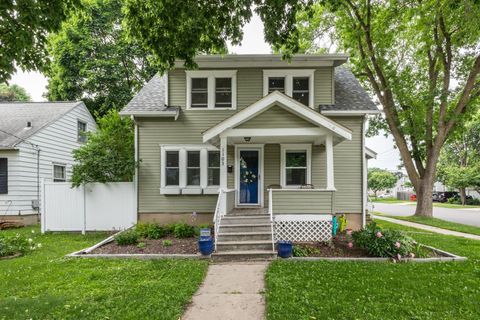
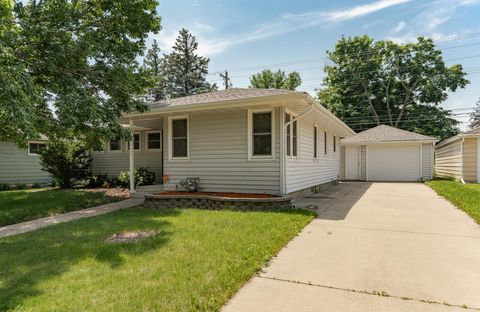
$274,900
3
bds
|
1
ba
|
1,211
sqft
|
built
1939
1130 4th Ave SE, Rochester, MN 55904
$166
Cash flow
3.2%
Cash-on-Cash Return
6.4%
Cap rate
0.9%
Rent to Value Ratio
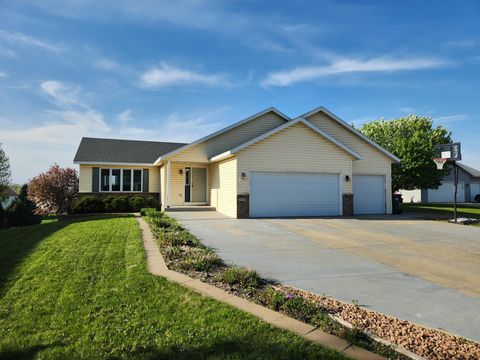
Active
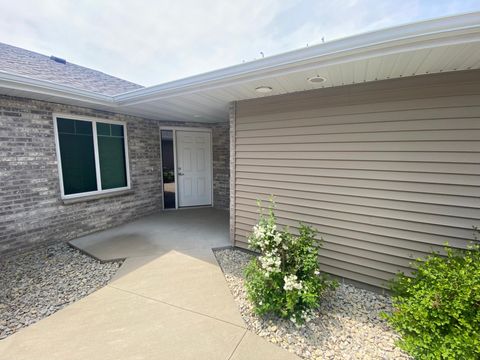
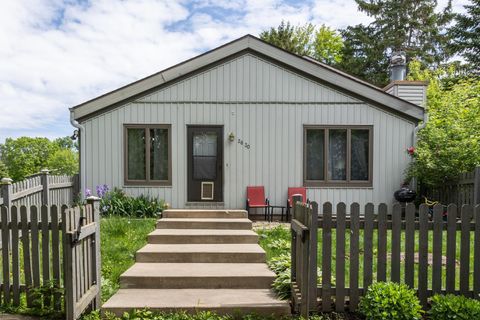
$213,200
2
bds
|
1
ba
|
1,185
sqft
|
built
2020
4228 Mallard Pl SE, Rochester, MN 55904
$148
Cash flow
3.6%
Cash-on-Cash Return
6.5%
Cap rate
1.0%
Rent to Value Ratio
302 out of 478 properties for sale in Olmsted County
Limited Results Shown
Create a free account, or log in to reveal all property listings and enjoy the complete experience.
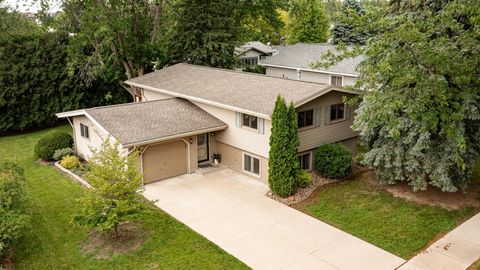
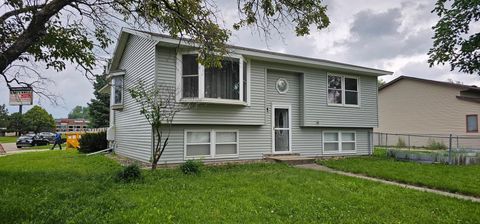
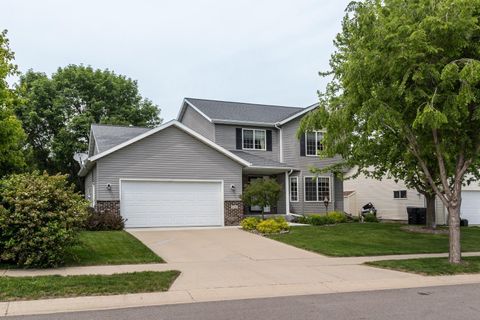
Active
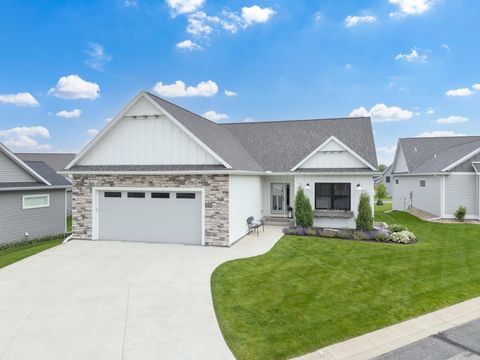
$309,999
3
bds
|
2
ba
|
2,006
sqft
|
built
1978
2407 27th Ave NW, Rochester, MN 55901
$-228
Cash flow
-3.8%
Cash-on-Cash Return
4.8%
Cap rate
0.7%
Rent to Value Ratio
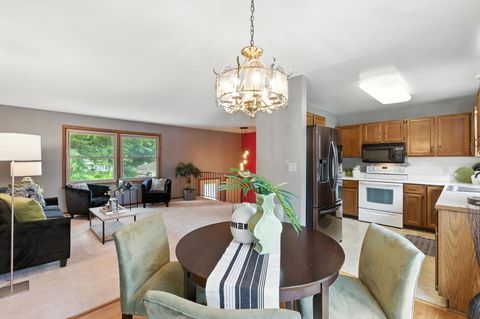
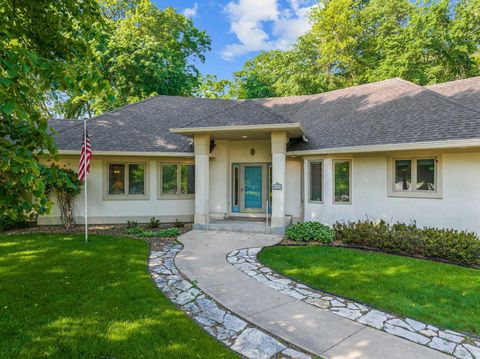
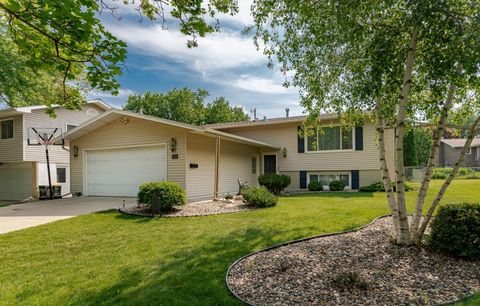
Active
$324,900
4
bds
|
2
ba
|
1,735
sqft
|
built
1977
507 17 1/2 St SE, Rochester, MN 55904
$-232
Cash flow
-3.7%
Cash-on-Cash Return
4.8%
Cap rate
0.7%
Rent to Value Ratio
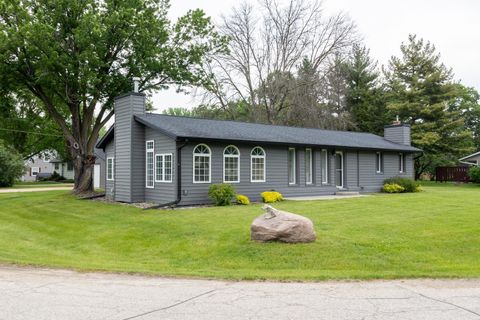
Active
$260,000
3
bds
|
1
ba
|
1,457
sqft
|
built
1955
1515 Graham Ct SE, Rochester, MN 55904
$76
Cash flow
1.5%
Cash-on-Cash Return
6.0%
Cap rate
0.8%
Rent to Value Ratio
Active
$429,900
5
bds
|
3
ba
|
2,501
sqft
|
built
2001
2739 Bandel Dr NW, Rochester, MN 55901
$-457
Cash flow
-5.5%
Cash-on-Cash Return
4.4%
Cap rate
0.7%
Rent to Value Ratio
Active
$349,900
4
bds
|
2
ba
|
2,649
sqft
|
built
1980
603 31st St NE, Rochester, MN 55906
$-105
Cash flow
-1.6%
Cash-on-Cash Return
5.3%
Cap rate
0.8%
Rent to Value Ratio
Active
$274,900
3
bds
|
1
ba
|
1,211
sqft
|
built
1939
1130 4th Ave SE, Rochester, MN 55904
$166
Cash flow
3.2%
Cash-on-Cash Return
6.4%
Cap rate
0.9%
Rent to Value Ratio
Active
$849,900
3
bds
|
4
ba
|
3,193
sqft
|
built
1998
1145 Taro Ln SW, Rochester, MN 55902
$-2,486
Cash flow
-15.3%
Cash-on-Cash Return
2.2%
Cap rate
0.4%
Rent to Value Ratio
Active
$330,000
3
bds
|
3
ba
|
1,975
sqft
|
built
1997
2225 Fisher Ct NW, Rochester, MN 55901
$-528
Cash flow
-8.3%
Cash-on-Cash Return
3.8%
Cap rate
0.7%
Rent to Value Ratio
Active
$369,900
4
bds
|
2
ba
|
1,912
sqft
|
built
2004
5329 Castleview Dr NW, Rochester, MN 55901
$-467
Cash flow
-6.6%
Cash-on-Cash Return
4.2%
Cap rate
0.6%
Rent to Value Ratio
Active
$2,150,000
5
bds
|
5
ba
|
6,513
sqft
|
built
1923
925 6th St SW, Rochester, MN 55902
$-7,098
Cash flow
-17.2%
Cash-on-Cash Return
1.7%
Cap rate
0.3%
Rent to Value Ratio
Active
$400,000
4
bds
|
3
ba
|
2,674
sqft
|
built
1985
510 24th St SW, Rochester, MN 55902
$-481
Cash flow
-6.3%
Cash-on-Cash Return
4.2%
Cap rate
0.7%
Rent to Value Ratio
Active
$235,000
2
bds
|
1
ba
|
1,384
sqft
|
built
1920
1103 4th Ave SE, Rochester, MN 55904
$68
Cash flow
1.5%
Cash-on-Cash Return
6.0%
Cap rate
0.9%
Rent to Value Ratio
Active
$419,900
3
bds
|
4
ba
|
3,034
sqft
|
built
2000
5241 Lexington Pl NW, Rochester, MN 55901
$-487
Cash flow
-6.1%
Cash-on-Cash Return
4.3%
Cap rate
0.7%
Rent to Value Ratio
Active
$319,900
3
bds
|
2
ba
|
1,780
sqft
|
built
1973
2620 E River Rd NE, Rochester, MN 55906
$-268
Cash flow
-4.4%
Cash-on-Cash Return
4.7%
Cap rate
0.7%
Rent to Value Ratio
Active
$330,000
2
bds
|
1
ba
|
2,292
sqft
|
built
1971
4809 18th St SE, Rochester, MN 55904
$-206
Cash flow
-3.3%
Cash-on-Cash Return
4.9%
Cap rate
0.7%
Rent to Value Ratio
Active
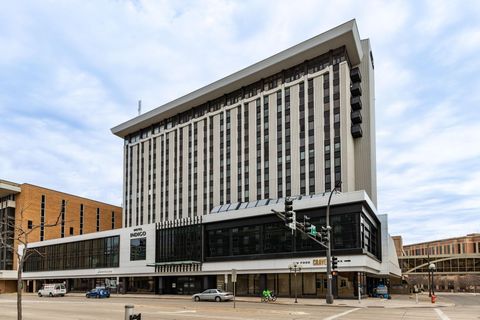
$525,000
2
bds
|
2
ba
|
1,979
sqft
|
built
1979
600 4th St SW, Rochester, MN 55902
$-2,083
Cash flow
-20.7%
Cash-on-Cash Return
0.9%
Cap rate
0.5%
Rent to Value Ratio
Active
$374,900
3
bds
|
3
ba
|
2,201
sqft
|
built
1984
4887 Tee Ct SW, Rochester, MN 55902
$-737
Cash flow
-10.3%
Cash-on-Cash Return
3.3%
Cap rate
0.7%
Rent to Value Ratio

Active
$299,900
3
bds
|
1
ba
|
1,076
sqft
|
built
1961
1309 28th St SE, Rochester, MN 55904
$-142
Cash flow
-2.5%
Cash-on-Cash Return
5.1%
Cap rate
0.7%
Rent to Value Ratio
Active
$1,550,000
5
bds
|
5
ba
|
5,733
sqft
|
built
2015
3484 Hidden Creek Rd NE, Rochester, MN 55906
$-5,309
Cash flow
-17.9%
Cash-on-Cash Return
1.6%
Cap rate
0.3%
Rent to Value Ratio
Active
$450,000
1
bds
|
2
ba
|
1,784
sqft
|
built
2007
2444 Red Pine Ave SW, Rochester, MN 55902
$-642
Cash flow
-7.4%
Cash-on-Cash Return
4.0%
Cap rate
0.6%
Rent to Value Ratio
Active
$2,495,000
4
bds
|
4
ba
|
5,343
sqft
|
built
2020
1500 Weatherhill Ridge Ct SW, Rochester, MN 55902
$-10,551
Cash flow
-22.1%
Cash-on-Cash Return
0.6%
Cap rate
0.2%
Rent to Value Ratio
Active
$309,900
3
bds
|
2
ba
|
1,970
sqft
|
built
1950
931 9th Ave NE, Rochester, MN 55906
$-13
Cash flow
-0.2%
Cash-on-Cash Return
5.6%
Cap rate
0.8%
Rent to Value Ratio
Active
$600,000
5
bds
|
3
ba
|
2,832
sqft
|
built
2019
695 Marcus Pl NE, Byron, MN 55920
$-1,289
Cash flow
-11.2%
Cash-on-Cash Return
3.1%
Cap rate
0.5%
Rent to Value Ratio
Active
$1,190,000
5
bds
|
4
ba
|
4,054
sqft
|
built
2017
3039 Lady Slipper Ln SW, Rochester, MN 55902
$-4,328
Cash flow
-19.0%
Cash-on-Cash Return
1.3%
Cap rate
0.3%
Rent to Value Ratio
Active
$340,000
3
bds
|
2
ba
|
2,000
sqft
|
built
2001
4929 Valley Dr NW, Rochester, MN 55901
$-290
Cash flow
-4.5%
Cash-on-Cash Return
4.7%
Cap rate
0.7%
Rent to Value Ratio
Active
$407,900
5
bds
|
3
ba
|
2,345
sqft
|
built
1997
4403 5th St NW, Rochester, MN 55901
$-546
Cash flow
-7.0%
Cash-on-Cash Return
4.1%
Cap rate
0.6%
Rent to Value Ratio
Active
$358,000
4
bds
|
2
ba
|
1,720
sqft
|
built
2001
5219 56th Ave NW, Rochester, MN 55901
$-287
Cash flow
-4.2%
Cash-on-Cash Return
4.7%
Cap rate
0.7%
Rent to Value Ratio
Active
$369,900
5
bds
|
3
ba
|
2,794
sqft
|
built
1976
1623 Marvale Ave SE, Rochester, MN 55904
$-176
Cash flow
-2.5%
Cash-on-Cash Return
5.1%
Cap rate
0.8%
Rent to Value Ratio
Active
$355,000
3
bds
|
3
ba
|
2,147
sqft
|
built
1957
912 11 1/2 St SW, Rochester, MN 55902
$-464
Cash flow
-6.8%
Cash-on-Cash Return
4.1%
Cap rate
0.6%
Rent to Value Ratio
Active
$199,900
2
bds
|
2
ba
|
1,877
sqft
|
built
1977
2630 Charles Ct NW, Rochester, MN 55901
$4
Cash flow
0.1%
Cash-on-Cash Return
5.7%
Cap rate
1.0%
Rent to Value Ratio
Active
$689,000
4
bds
|
3
ba
|
2,892
sqft
|
built
2021
2335 Woodstone Ln SW, Rochester, MN 55902
$-7,331
Cash flow
-55.5%
Cash-on-Cash Return
-7.1%
Cap rate
0.6%
Rent to Value Ratio
Active
$285,000
1
bds
|
2
ba
|
1,026
sqft
|
built
1969
220 Broadway Ave S, Rochester, MN 55904
$-595
Cash flow
-10.9%
Cash-on-Cash Return
3.2%
Cap rate
0.8%
Rent to Value Ratio
Active
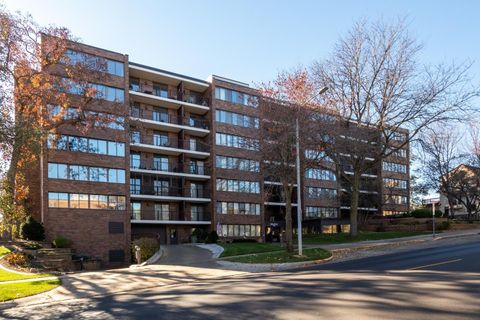
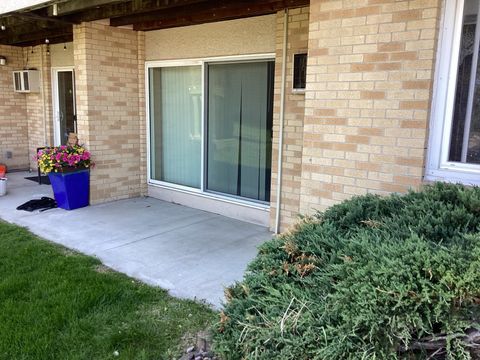
$99,900
1
bds
|
1
ba
|
836
sqft
|
built
1970
366 Elton Hills Dr NW, Rochester, MN 55901
$-78
Cash flow
-4.1%
Cash-on-Cash Return
4.7%
Cap rate
1.4%
Rent to Value Ratio
Active
$213,200
2
bds
|
1
ba
|
1,185
sqft
|
built
2020
4228 Mallard Pl SE, Rochester, MN 55904
$148
Cash flow
3.6%
Cash-on-Cash Return
6.5%
Cap rate
1.0%
Rent to Value Ratio
Active
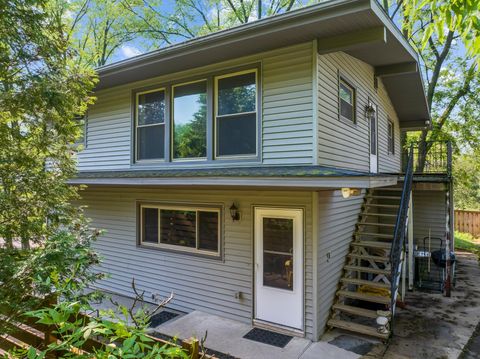
$309,900
4
bds
|
3
ba
|
1,764
sqft
|
built
1915
1015 19th Ave NE, Rochester, MN 55906
$-402
Cash flow
-6.8%
Cash-on-Cash Return
4.1%
Cap rate
0.6%
Rent to Value Ratio
Active
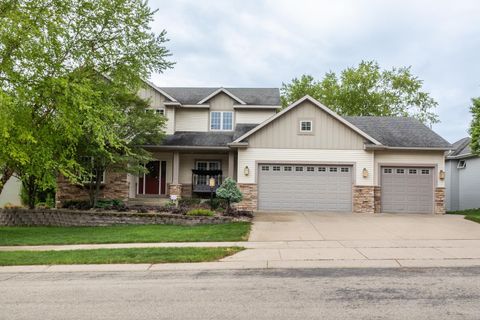
$639,900
5
bds
|
4
ba
|
3,709
sqft
|
built
2003
3146 Scanlan Ln NE, Rochester, MN 55906
$-1,506
Cash flow
-12.3%
Cash-on-Cash Return
2.9%
Cap rate
0.5%
Rent to Value Ratio
Active
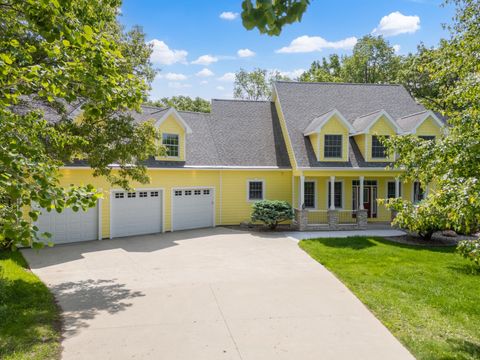
$985,000
5
bds
|
5
ba
|
5,295
sqft
|
built
2002
6674 Zumbro Hylands NW, Rochester, MN 55901
$-2,828
Cash flow
-15.0%
Cash-on-Cash Return
2.2%
Cap rate
0.4%
Rent to Value Ratio
Active
$288,900
3
bds
|
2
ba
|
1,427
sqft
|
built
1983
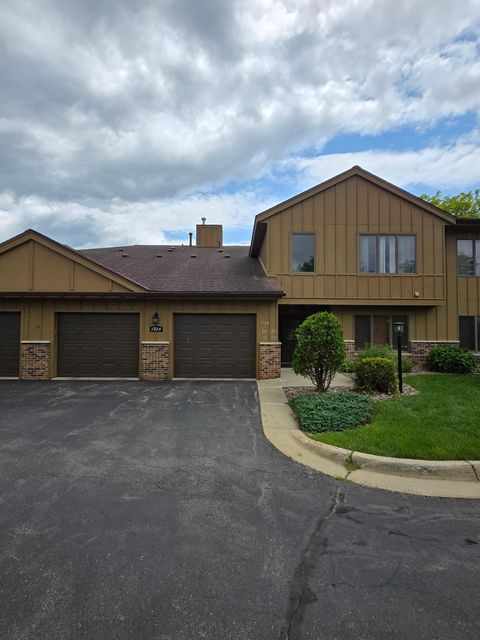
1924 Greenfield Ln SW, Rochester, MN 55902
$-261
Cash flow
-4.7%
Cash-on-Cash Return
4.6%
Cap rate
0.9%
Rent to Value Ratio
Active
$124,900
1
bds
|
1
ba
|
720
sqft
|
built
1970
1931 Viking Dr NW, Rochester, MN 55901
$-157
Cash flow
-6.6%
Cash-on-Cash Return
4.2%
Cap rate
1.1%
Rent to Value Ratio
Active
$565,000
4
bds
|
4
ba
|
3,526
sqft
|
built
1992
5121 Cameron Dr NW, Rochester, MN 55901
$-1,027
Cash flow
-9.5%
Cash-on-Cash Return
3.5%
Cap rate
0.5%
Rent to Value Ratio