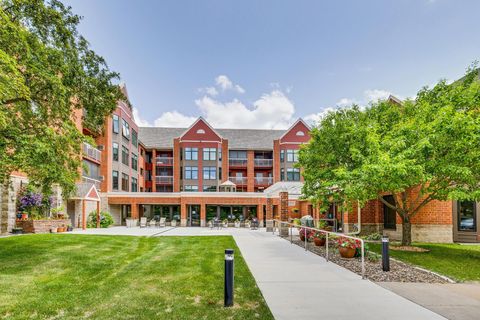
Ramsey County Investment Properties for Sale
Browse homes for sale and investment properties in Ramsey County. Refine your search by price, property type, or more.
Best cash flowing properties in Ramsey County

Active
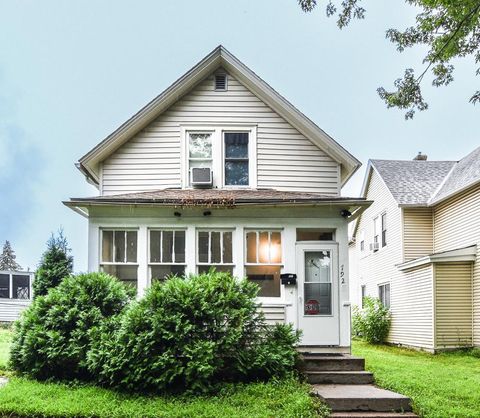
$117,000
2
bds
|
1
ba
|
912
sqft
|
built
1894
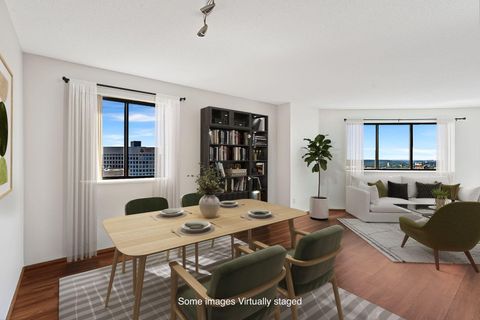
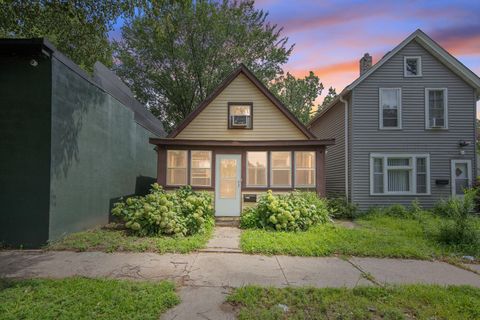
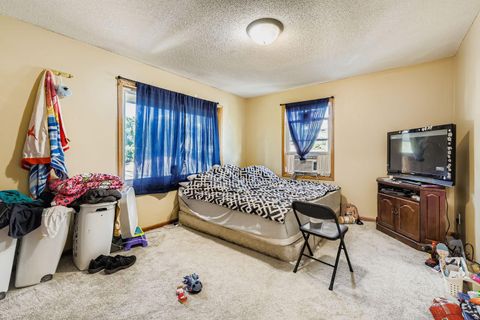
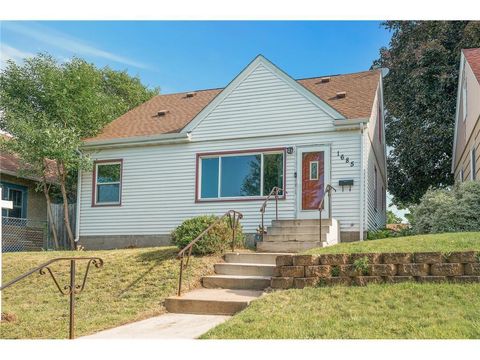
553 Blair Ave, Saint Paul, MN 55103
$254
Cash flow
11.3%
Cash-on-Cash Return
8.3%
Cap rate
1.4%
Rent to Value Ratio
Active
$190,000
2
bds
|
1
ba
|
930
sqft
|
built
1880
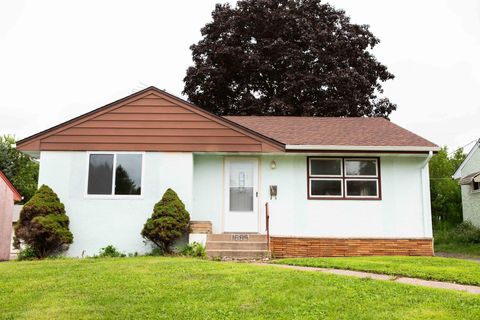
792 Cook Ave E, Saint Paul, MN 55106
$205
Cash flow
5.6%
Cash-on-Cash Return
7.0%
Cap rate
0.8%
Rent to Value Ratio
239 out of 356 properties for sale in Ramsey County
Limited Results Shown
Create a free account, or log in to reveal all property listings and enjoy the complete experience.

Active
$279,900
3
bds
|
2
ba
|
1,740
sqft
|
built
1935
1732 Maryland Ave E, Saint Paul, MN 55106
$-601
Cash flow
-11.2%
Cash-on-Cash Return
3.1%
Cap rate
0.6%
Rent to Value Ratio

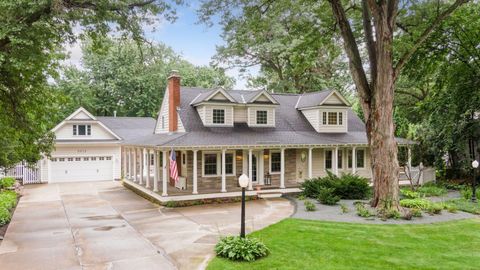
Active
$489,900
3
bds
|
3
ba
|
1,358
sqft
|
built
1920
563 Eustis St, Saint Paul, MN 55104
$-1,040
Cash flow
-11.1%
Cash-on-Cash Return
3.1%
Cap rate
0.5%
Rent to Value Ratio

Active
$422,000
4
bds
|
3
ba
|
2,025
sqft
|
built
1987
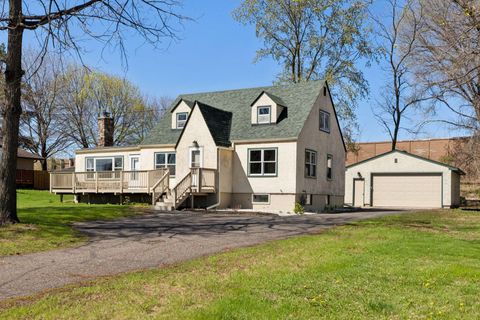
567 Lakewood Dr S, Maplewood, MN 55119
$-496
Cash flow
-6.1%
Cash-on-Cash Return
4.3%
Cap rate
0.7%
Rent to Value Ratio

Active
$120,000
1
bds
|
1
ba
|
478
sqft
|
built
1983
66 9th St E, Saint Paul, MN 55101
$30
Cash flow
1.3%
Cash-on-Cash Return
6.0%
Cap rate
1.3%
Rent to Value Ratio

Active
$327,500
1
bds
|
1
ba
|
1,241
sqft
|
built
1905
406 Wacouta St, Saint Paul, MN 55101
$-1,847
Cash flow
-29.4%
Cash-on-Cash Return
-1.1%
Cap rate
0.5%
Rent to Value Ratio
Active
$194,500
1
bds
|
1
ba
|
893
sqft
|
built
1896
350 Saint Peter St, Saint Paul, MN 55102
$-492
Cash flow
-13.2%
Cash-on-Cash Return
2.6%
Cap rate
1.0%
Rent to Value Ratio

Active
$110,900
1
bds
|
1
ba
|
668
sqft
|
built
1972
3421 Kent St, Saint Paul, MN 55126
$0
Cash flow
n/a
Cash-on-Cash Return
n/a
Cap rate
n/a
Rent to Value Ratio
Active
$210,000
2
bds
|
2
ba
|
1,206
sqft
|
built
1978
2680 Oxford St N, Roseville, MN 55113
$-673
Cash flow
-16.7%
Cash-on-Cash Return
1.8%
Cap rate
1.0%
Rent to Value Ratio
Active
$117,500
1
bds
|
1
ba
|
727
sqft
|
built
1978
2670 Oxford St N, Roseville, MN 55113
$65
Cash flow
2.9%
Cash-on-Cash Return
6.3%
Cap rate
1.5%
Rent to Value Ratio

Active
$675,000
4
bds
|
3
ba
|
2,574
sqft
|
built
1925
1511 Branston St, Saint Paul, MN 55108
$-1,325
Cash flow
-10.2%
Cash-on-Cash Return
3.3%
Cap rate
0.6%
Rent to Value Ratio
Active
$159,000
2
bds
|
1
ba
|
863
sqft
|
built
1987
78 10th St E, Saint Paul, MN 55101
$-834
Cash flow
-27.4%
Cash-on-Cash Return
-0.6%
Cap rate
1.0%
Rent to Value Ratio
Active
$995,000
3
bds
|
4
ba
|
3,023
sqft
|
built
1938
3072 Fairview Ave N, Roseville, MN 55113
$-2,986
Cash flow
-15.7%
Cash-on-Cash Return
2.1%
Cap rate
0.4%
Rent to Value Ratio
Active
$495,000
4
bds
|
2
ba
|
1,649
sqft
|
built
1924
1818 Juliet Ave, Saint Paul, MN 55105
$-1,009
Cash flow
-10.6%
Cash-on-Cash Return
3.2%
Cap rate
0.6%
Rent to Value Ratio
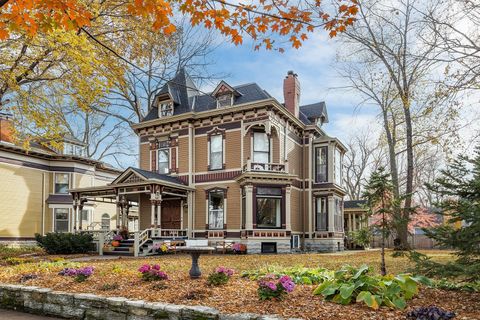
Active
$899,900
7
bds
|
6
ba
|
7,285
sqft
|
built
1883
422 Laurel Ave, Saint Paul, MN 55102
$-3,399
Cash flow
-19.7%
Cash-on-Cash Return
1.1%
Cap rate
0.4%
Rent to Value Ratio
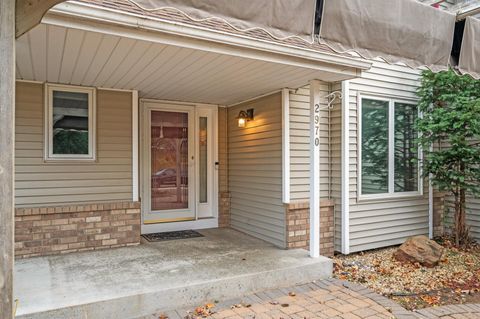
Active
$724,900
6
bds
|
4
ba
|
3,404
sqft
|
built
1994
2970 Western Ave N, Roseville, MN 55113
$-1,814
Cash flow
-13.1%
Cash-on-Cash Return
2.7%
Cap rate
0.5%
Rent to Value Ratio
Active
$2,400,000
5
bds
|
5
ba
|
4,323
sqft
|
built
2012
800 County Road I W, Shoreview, MN 55126
$-9,842
Cash flow
-21.4%
Cash-on-Cash Return
0.8%
Cap rate
0.2%
Rent to Value Ratio

Active
$475,000
3
bds
|
2
ba
|
2,182
sqft
|
built
1953
3672 Rustic Pl, Shoreview, MN 55126
$-619
Cash flow
-6.8%
Cash-on-Cash Return
4.1%
Cap rate
0.7%
Rent to Value Ratio
Active
$475,000
4
bds
|
3
ba
|
2,104
sqft
|
built
1917
2181 Dayton Ave, Saint Paul, MN 55104
$-833
Cash flow
-9.1%
Cash-on-Cash Return
3.6%
Cap rate
0.6%
Rent to Value Ratio
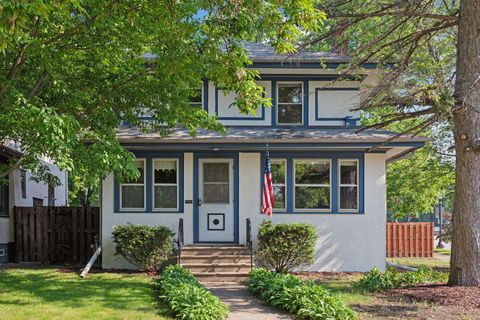
Active
$369,999
3
bds
|
3
ba
|
1,885
sqft
|
built
2004
2065 Woodlynn Ave, Maplewood, MN 55109
$-652
Cash flow
-9.2%
Cash-on-Cash Return
3.6%
Cap rate
0.8%
Rent to Value Ratio
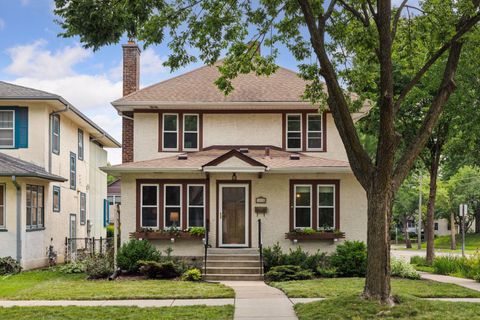
Active
$169,900
2
bds
|
1
ba
|
885
sqft
|
built
1908
950 Marion St, Saint Paul, MN 55117
$76
Cash flow
2.3%
Cash-on-Cash Return
6.2%
Cap rate
0.9%
Rent to Value Ratio
Active
$400,000
4
bds
|
2
ba
|
1,778
sqft
|
built
1947
2979 Centerville Rd, Saint Paul, MN 55117
$-107
Cash flow
-1.4%
Cash-on-Cash Return
5.4%
Cap rate
0.8%
Rent to Value Ratio
Active
$268,000
3
bds
|
2
ba
|
1,310
sqft
|
built
1974
4371 Arden View Ct, New Brighton, MN 55112
$-375
Cash flow
-7.3%
Cash-on-Cash Return
4.0%
Cap rate
0.9%
Rent to Value Ratio

Active
$289,900
3
bds
|
3
ba
|
2,231
sqft
|
built
1894
552 Burgess St, Saint Paul, MN 55103
$-119
Cash flow
-2.1%
Cash-on-Cash Return
5.2%
Cap rate
0.8%
Rent to Value Ratio
Active
$234,900
2
bds
|
1
ba
|
1,152
sqft
|
built
1911
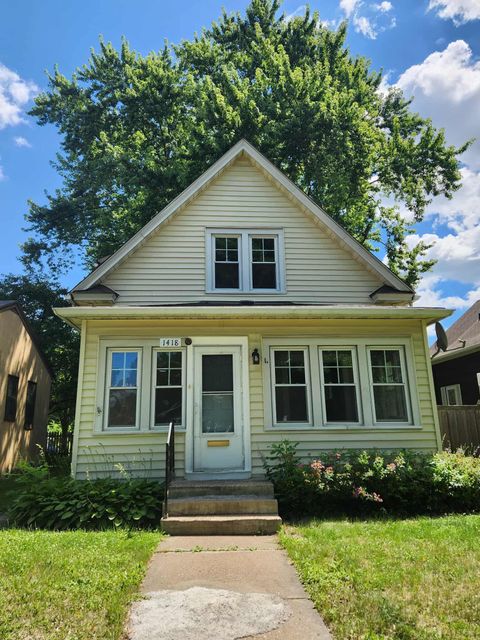
1418 Payne Ave, Saint Paul, MN 55130
$-542
Cash flow
-12.0%
Cash-on-Cash Return
2.9%
Cap rate
0.6%
Rent to Value Ratio
Active
$450,000
7
bds
|
6
ba
|
3,229
sqft
|
built
1969
2169 Glenridge Ave, Saint Paul, MN 55119
$-1,486
Cash flow
-17.2%
Cash-on-Cash Return
1.7%
Cap rate
0.5%
Rent to Value Ratio
Active
$299,000
3
bds
|
3
ba
|
1,954
sqft
|
built
1978
2671 Sumac Rdg, White Bear Lake, MN 55110
$-211
Cash flow
-3.7%
Cash-on-Cash Return
4.8%
Cap rate
0.8%
Rent to Value Ratio

Active
$2,250,000
6
bds
|
10
ba
|
10,838
sqft
|
built
1989
4 W Bay Ln, Saint Paul, MN 55127
$-9,127
Cash flow
-21.2%
Cash-on-Cash Return
0.8%
Cap rate
0.2%
Rent to Value Ratio

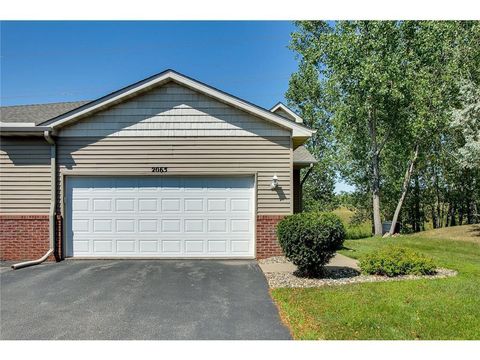
Active
$200,000
2
bds
|
1
ba
|
954
sqft
|
built
1984
4357 Buckingham Ct, Saint Paul, MN 55127
$-105
Cash flow
-2.7%
Cash-on-Cash Return
5.0%
Cap rate
1.0%
Rent to Value Ratio
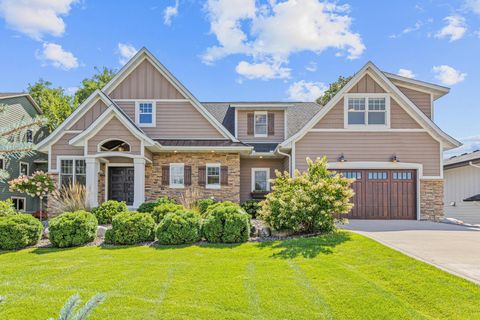
Active
$635,000
4
bds
|
3
ba
|
2,894
sqft
|
built
1985
1688 Chatham Ave, New Brighton, MN 55112
$-1,185
Cash flow
-9.7%
Cash-on-Cash Return
3.4%
Cap rate
0.6%
Rent to Value Ratio
Active
$225,000
2
bds
|
1
ba
|
1,125
sqft
|
built
1993
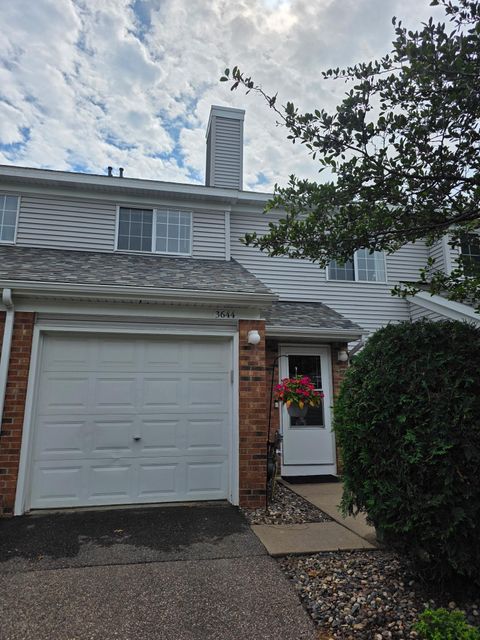
3644 Linden Ave, White Bear Lake, MN 55110
$-246
Cash flow
-5.7%
Cash-on-Cash Return
4.4%
Cap rate
0.9%
Rent to Value Ratio
Active
$302,600
4
bds
|
2
ba
|
1,915
sqft
|
built
1952
1685 Bush Ave, Saint Paul, MN 55106
$-191
Cash flow
-3.3%
Cash-on-Cash Return
4.9%
Cap rate
0.8%
Rent to Value Ratio
Active
$490,000
8
bds
|
4
ba
|
3,984
sqft
|
built
1905
1122 Dayton Ave, Saint Paul, MN 55104
$-1,321
Cash flow
-14.1%
Cash-on-Cash Return
2.4%
Cap rate
0.4%
Rent to Value Ratio
Active
$226,900
2
bds
|
2
ba
|
1,104
sqft
|
built
1984
794 Agate St, Saint Paul, MN 55117
$-290
Cash flow
-6.7%
Cash-on-Cash Return
4.1%
Cap rate
0.7%
Rent to Value Ratio
Active
$289,900
3
bds
|
1
ba
|
1,475
sqft
|
built
1955
1685 Fremont Ave, Saint Paul, MN 55106
$-347
Cash flow
-6.2%
Cash-on-Cash Return
4.2%
Cap rate
0.7%
Rent to Value Ratio
Active
$130,000
1
bds
|
1
ba
|
642
sqft
|
built
1986
500 County Road B W, Roseville, MN 55113
$-42
Cash flow
-1.7%
Cash-on-Cash Return
5.3%
Cap rate
1.2%
Rent to Value Ratio

Active
$897,000
4
bds
|
4
ba
|
3,542
sqft
|
built
1967
75 E Pleasant Lake Rd, Saint Paul, MN 55127
$-2,640
Cash flow
-15.4%
Cash-on-Cash Return
2.1%
Cap rate
0.4%
Rent to Value Ratio
Active
$1,300,000
10
bds
|
3
ba
|
5,206
sqft
|
built
1908
542 Portland Ave, Saint Paul, MN 55102
$-5,705
Cash flow
-22.9%
Cash-on-Cash Return
0.4%
Cap rate
0.2%
Rent to Value Ratio
Active
$319,900
4
bds
|
2
ba
|
1,987
sqft
|
built
1909
1436 Payne Ave, Saint Paul, MN 55130
$-289
Cash flow
-4.7%
Cash-on-Cash Return
4.6%
Cap rate
0.7%
Rent to Value Ratio