Minnesota Investment Properties for Sale
Browse homes for sale and investment properties in Minnesota. Refine your search by price, property type, or more.
Best cash flowing properties in Minnesota
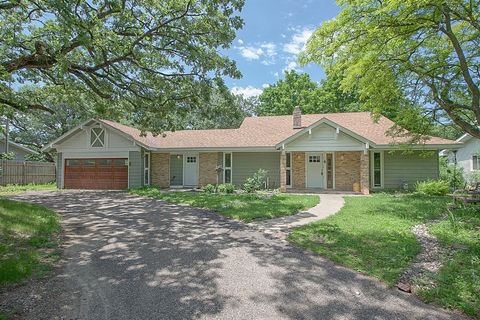
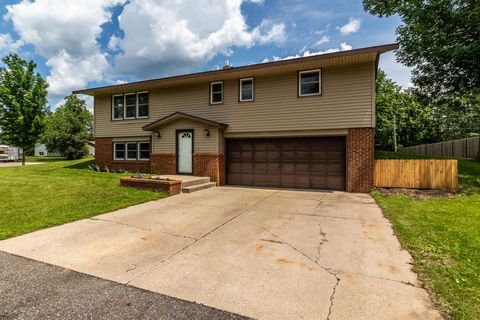
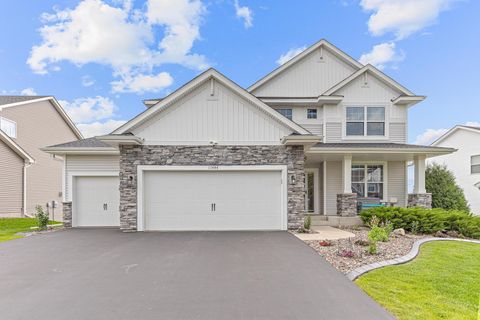
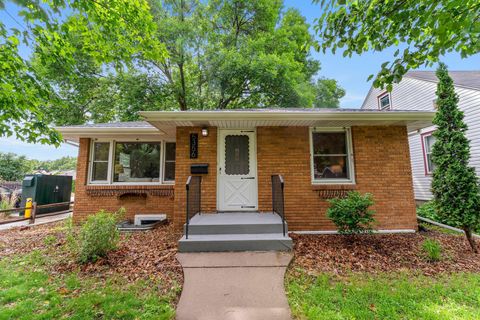
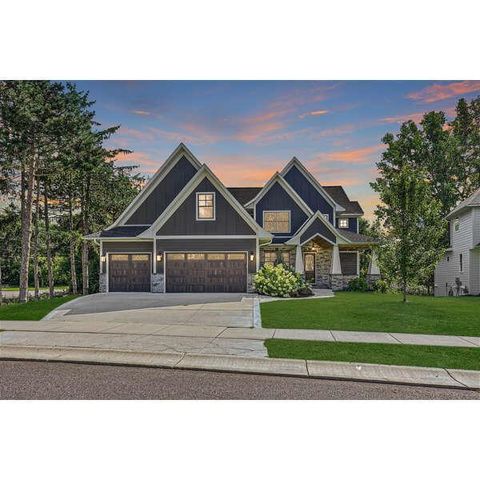
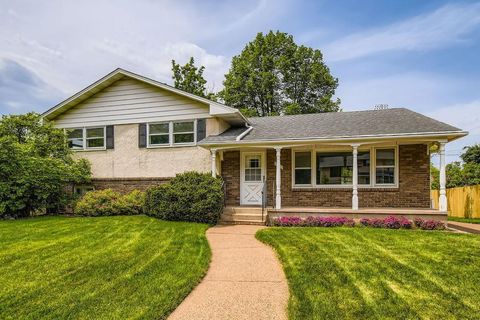
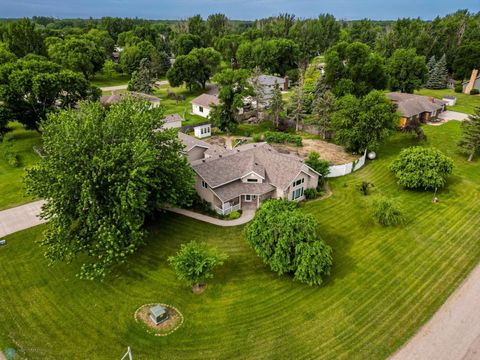
Active
$315,000
4
bds
|
3
ba
|
2,757
sqft
|
built
1977
3558 13th Ave SE, Saint Cloud, MN 56304
$234
Cash flow
3.9%
Cash-on-Cash Return
6.6%
Cap rate
0.9%
Rent to Value Ratio
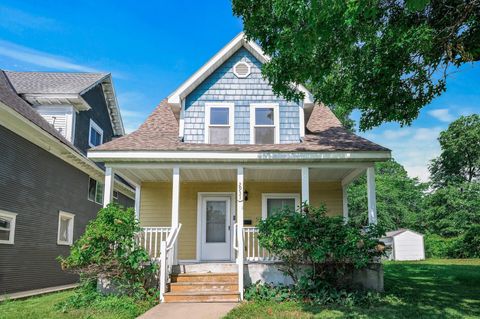
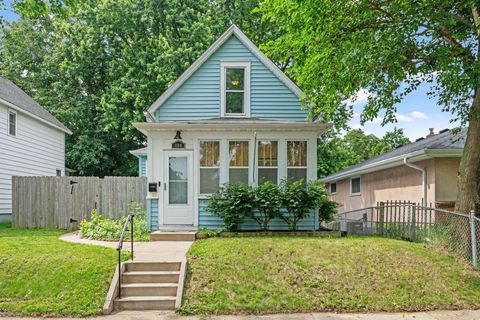
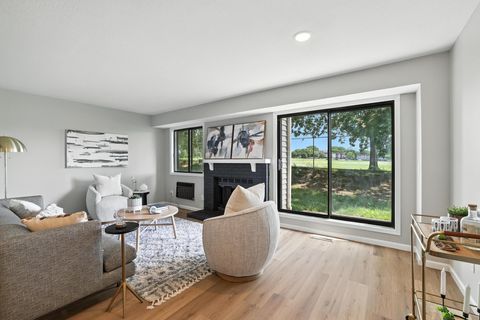
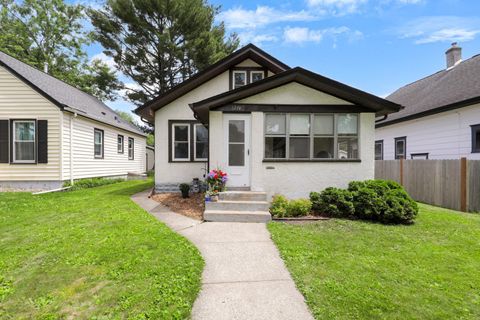
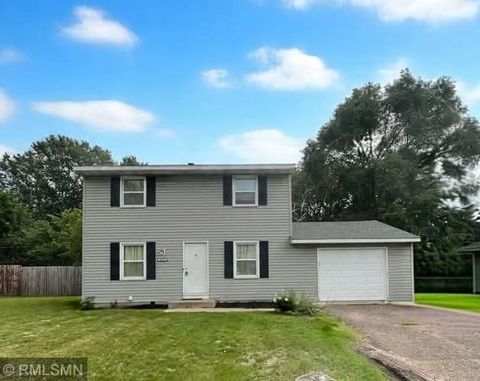
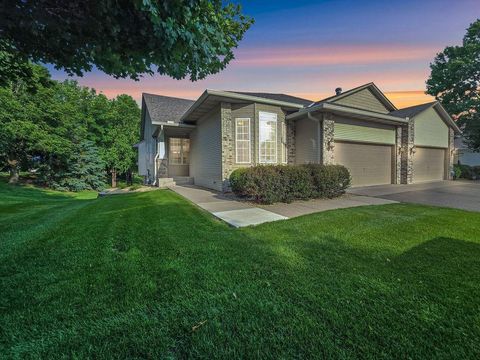
Active
$210,000
3
bds
|
1
ba
|
1,084
sqft
|
built
1910
2931 Lyndale Ave N, Minneapolis, MN 55411
$139
Cash flow
3.5%
Cash-on-Cash Return
6.5%
Cap rate
1.0%
Rent to Value Ratio
5,985 out of 15,745 properties for sale in Minnesota
Limited Results Shown
Create a free account, or log in to reveal all property listings and enjoy the complete experience.
Active
$400,000
4
bds
|
3
ba
|
2,403
sqft
|
built
2000
3023 Crescent Ridge Trl, Saint Cloud, MN 56301
$-715
Cash flow
-9.3%
Cash-on-Cash Return
3.5%
Cap rate
0.5%
Rent to Value Ratio
Active
$389,900
4
bds
|
3
ba
|
3,048
sqft
|
built
2003
47 Glenview Loop, Saint Cloud, MN 56303
$-811
Cash flow
-10.9%
Cash-on-Cash Return
3.2%
Cap rate
0.6%
Rent to Value Ratio
Active
$285,000
3
bds
|
3
ba
|
1,830
sqft
|
built
1972
1744 Oak Rd, Saint Cloud, MN 56303
$-493
Cash flow
-9.0%
Cash-on-Cash Return
3.6%
Cap rate
0.6%
Rent to Value Ratio
Active
$315,000
4
bds
|
3
ba
|
2,757
sqft
|
built
1977
3558 13th Ave SE, Saint Cloud, MN 56304
$234
Cash flow
3.9%
Cash-on-Cash Return
6.6%
Cap rate
0.9%
Rent to Value Ratio
Active
$215,000
3
bds
|
2
ba
|
1,464
sqft
|
built
1912
1104 Cook Ave E, Saint Paul, MN 55106
$39
Cash flow
0.9%
Cash-on-Cash Return
5.9%
Cap rate
0.9%
Rent to Value Ratio

Active
$900,000
5
bds
|
5
ba
|
4,061
sqft
|
built
1990
19826 Dakota Ave, Prior Lake, MN 55372
$-2,049
Cash flow
-11.9%
Cash-on-Cash Return
2.9%
Cap rate
0.4%
Rent to Value Ratio

Active
$250,000
2
bds
|
2
ba
|
1,400
sqft
|
built
2002
5280 207th St N, Forest Lake, MN 55025
$-261
Cash flow
-5.4%
Cash-on-Cash Return
4.4%
Cap rate
0.8%
Rent to Value Ratio
Active
$874,900
4
bds
|
4
ba
|
3,152
sqft
|
built
2002
4584 162nd Ln NW, Andover, MN 55304
$-1,879
Cash flow
-11.2%
Cash-on-Cash Return
3.1%
Cap rate
0.5%
Rent to Value Ratio

Active
$399,000
3
bds
|
2
ba
|
1,524
sqft
|
built
1953
8412 4th Ave S, Bloomington, MN 55420
$-433
Cash flow
-5.7%
Cash-on-Cash Return
4.4%
Cap rate
0.6%
Rent to Value Ratio

Active
$270,000
3
bds
|
2
ba
|
1,150
sqft
|
built
1994
11454 190th Ln NW, Elk River, MN 55330
$-337
Cash flow
-6.5%
Cash-on-Cash Return
4.2%
Cap rate
0.7%
Rent to Value Ratio
Active
$347,900
3
bds
|
2
ba
|
1,157
sqft
|
built
2024
5348 Fall Cir, North Branch, MN 55056
$-75
Cash flow
-1.1%
Cash-on-Cash Return
5.4%
Cap rate
0.7%
Rent to Value Ratio

Active
$511,515
4
bds
|
3
ba
|
2,515
sqft
|
built
2025
4867 Island Park Dr, Woodbury, MN 55129
$-620
Cash flow
-6.3%
Cash-on-Cash Return
4.2%
Cap rate
0.6%
Rent to Value Ratio
Active
$650,000
5
bds
|
4
ba
|
3,705
sqft
|
built
2017
11444 Creekside Ct, Maple Grove, MN 55311
$-1,160
Cash flow
-9.3%
Cash-on-Cash Return
3.5%
Cap rate
0.6%
Rent to Value Ratio
Active
$215,000
3
bds
|
2
ba
|
1,385
sqft
|
built
1982
186 Bridlewood Dr, Saint Paul, MN 55119
$-435
Cash flow
-10.6%
Cash-on-Cash Return
3.8%
Cap rate
0.8%
Rent to Value Ratio

Active
$535,000
4
bds
|
3
ba
|
2,970
sqft
|
built
1994
861 Autumn Dr, Woodbury, MN 55125
$-824
Cash flow
-8.0%
Cash-on-Cash Return
3.8%
Cap rate
0.6%
Rent to Value Ratio
Active
$749,999
4
bds
|
2
ba
|
2,556
sqft
|
built
1910
141 Rustic Ldg W, Minneapolis, MN 55419
$-2,056
Cash flow
-14.3%
Cash-on-Cash Return
2.4%
Cap rate
0.4%
Rent to Value Ratio
Active
$339,900
5
bds
|
3
ba
|
2,216
sqft
|
built
1915
1336 Russell Ave N, Minneapolis, MN 55411
$-288
Cash flow
-4.4%
Cash-on-Cash Return
4.7%
Cap rate
0.7%
Rent to Value Ratio
Active
$350,000
2
bds
|
1
ba
|
916
sqft
|
built
1959
5356 29th Ave S, Minneapolis, MN 55417
$-504
Cash flow
-7.5%
Cash-on-Cash Return
3.9%
Cap rate
0.6%
Rent to Value Ratio
Active
$400,000
4
bds
|
2
ba
|
1,913
sqft
|
built
1950
3235 Ulysses St NE, Minneapolis, MN 55418
$-377
Cash flow
-4.9%
Cash-on-Cash Return
4.5%
Cap rate
0.7%
Rent to Value Ratio
Active
$249,500
3
bds
|
1
ba
|
1,264
sqft
|
built
1924
1274 Marion St, Saint Paul, MN 55117
$-289
Cash flow
-6.0%
Cash-on-Cash Return
4.9%
Cap rate
0.8%
Rent to Value Ratio
Active
$349,900
4
bds
|
1
ba
|
2,014
sqft
|
built
1957
1927 Autumn St, Roseville, MN 55113
$-354
Cash flow
-5.3%
Cash-on-Cash Return
4.5%
Cap rate
0.7%
Rent to Value Ratio
Active
$644,000
2
bds
|
2
ba
|
1,907
sqft
|
built
2022
19479 102nd Pl, Rogers, MN 55374
$-1,063
Cash flow
-8.6%
Cash-on-Cash Return
3.7%
Cap rate
0.6%
Rent to Value Ratio
Active
$999,500
5
bds
|
4
ba
|
4,881
sqft
|
built
2018
4290 Inland Ln N, Minneapolis, MN 55446
$-2,322
Cash flow
-12.1%
Cash-on-Cash Return
2.9%
Cap rate
0.5%
Rent to Value Ratio
Active
$210,000
3
bds
|
1
ba
|
1,084
sqft
|
built
1910
2931 Lyndale Ave N, Minneapolis, MN 55411
$139
Cash flow
3.5%
Cash-on-Cash Return
6.5%
Cap rate
1.0%
Rent to Value Ratio

Active
$269,900
2
bds
|
3
ba
|
1,326
sqft
|
built
1998
6147 Tahoe Cir, Woodbury, MN 55125
$-509
Cash flow
-9.8%
Cash-on-Cash Return
4.0%
Cap rate
0.8%
Rent to Value Ratio
Active
$320,000
4
bds
|
2
ba
|
1,451
sqft
|
built
1961
10701 6th St NE, Minneapolis, MN 55434
$-312
Cash flow
-5.1%
Cash-on-Cash Return
5.1%
Cap rate
0.7%
Rent to Value Ratio
Active
$349,900
1
bds
|
1
ba
|
1,676
sqft
|
built
1898
11 Summit Ct, Saint Paul, MN 55102
$-1,058
Cash flow
-15.8%
Cash-on-Cash Return
2.1%
Cap rate
0.7%
Rent to Value Ratio
Active
$340,000
4
bds
|
2
ba
|
1,981
sqft
|
built
1963
53 Morningside Dr, Saint Paul, MN 55119
$-166
Cash flow
-2.5%
Cash-on-Cash Return
5.1%
Cap rate
0.8%
Rent to Value Ratio
Active
$510,000
2
bds
|
2
ba
|
1,554
sqft
|
built
2010
2359 Weston Pl SW, Rochester, MN 55902
$-1,275
Cash flow
-13.0%
Cash-on-Cash Return
2.7%
Cap rate
0.5%
Rent to Value Ratio
Active
$299,750
3
bds
|
2
ba
|
1,809
sqft
|
built
1949
1105 9th Ave NW, Rochester, MN 55901
$13
Cash flow
0.2%
Cash-on-Cash Return
5.7%
Cap rate
0.8%
Rent to Value Ratio
Active
$550,000
4
bds
|
3
ba
|
3,600
sqft
|
built
1989
11765 177th St W, Lakeville, MN 55044
$-705
Cash flow
-6.7%
Cash-on-Cash Return
4.1%
Cap rate
0.6%
Rent to Value Ratio
Active
$445,000
3
bds
|
3
ba
|
2,964
sqft
|
built
1976
1909 56th Ave N, Moorhead, MN 56560
$-479
Cash flow
-5.6%
Cash-on-Cash Return
4.4%
Cap rate
0.7%
Rent to Value Ratio

Active
$499,900
2
bds
|
2
ba
|
1,697
sqft
|
built
2022
20109 Geneva Trl, Lakeville, MN 55044
$-859
Cash flow
-9.0%
Cash-on-Cash Return
3.6%
Cap rate
0.6%
Rent to Value Ratio

Active
$2,694,903
4
bds
|
5
ba
|
5,870
sqft
|
built
2018
19803 Jersey Ave, Lakeville, MN 55044
$-9,052
Cash flow
-17.5%
Cash-on-Cash Return
1.6%
Cap rate
0.3%
Rent to Value Ratio

Active
$699,900
4
bds
|
3
ba
|
2,179
sqft
|
built
1909
968 Lincoln Ave, Saint Paul, MN 55105
$-1,769
Cash flow
-13.2%
Cash-on-Cash Return
2.6%
Cap rate
0.5%
Rent to Value Ratio

Active
$399,900
3
bds
|
2
ba
|
1,569
sqft
|
built
1920
4108 Highwood Rd, Mound, MN 55364
$-186
Cash flow
-2.4%
Cash-on-Cash Return
5.1%
Cap rate
0.7%
Rent to Value Ratio
Active
$450,000
4
bds
|
3
ba
|
3,331
sqft
|
built
2001
791 Woodduck Dr, Woodbury, MN 55125
$-348
Cash flow
-4.0%
Cash-on-Cash Return
4.8%
Cap rate
0.7%
Rent to Value Ratio
Active
$299,900
2
bds
|
1
ba
|
1,055
sqft
|
built
1926
521 S 7th St, Minneapolis, MN 55415
$-339
Cash flow
-5.9%
Cash-on-Cash Return
4.3%
Cap rate
0.9%
Rent to Value Ratio
Active
$315,000
3
bds
|
1
ba
|
1,312
sqft
|
built
1924
5529 40th Ave S, Minneapolis, MN 55417
$-221
Cash flow
-3.7%
Cash-on-Cash Return
4.8%
Cap rate
0.7%
Rent to Value Ratio
Active
$219,900
2
bds
|
2
ba
|
1,176
sqft
|
built
1965
19 S 1st St, Minneapolis, MN 55401
$-676
Cash flow
-16.0%
Cash-on-Cash Return
2.0%
Cap rate
1.1%
Rent to Value Ratio