Minnesota Investment Properties for Sale
Browse homes for sale and investment properties in Minnesota. Refine your search by price, property type, or more.
Best cash flowing properties in Minnesota
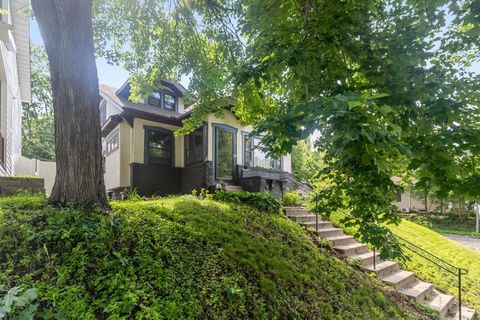
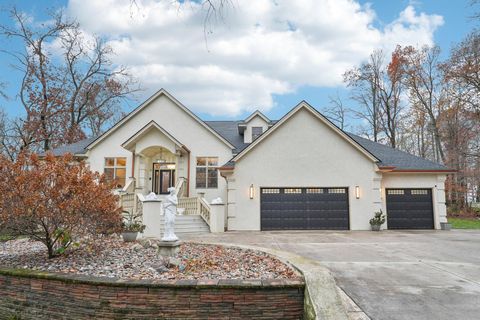
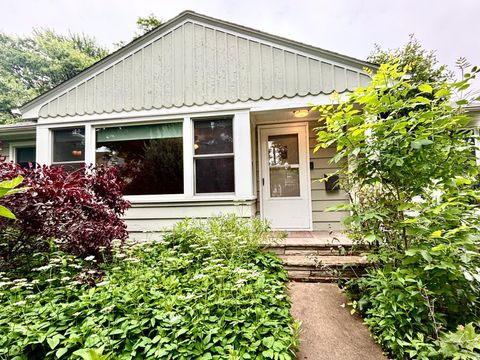
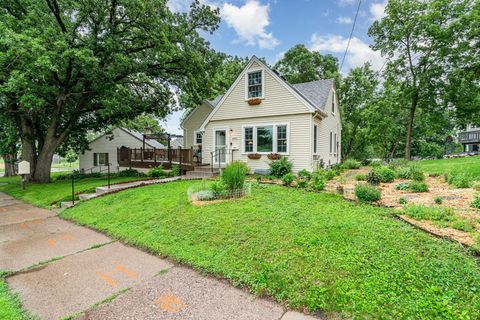
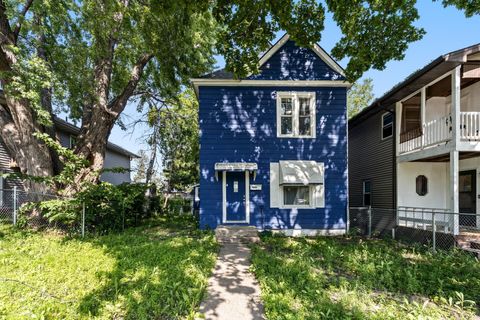
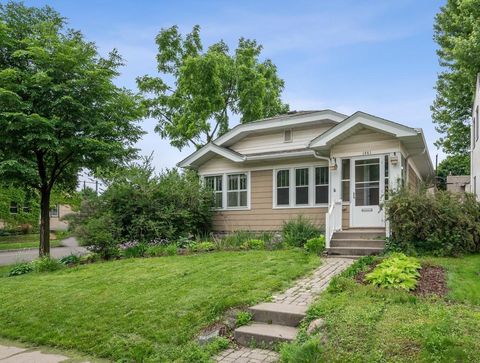
Active
$250,000
3
bds
|
1
ba
|
1,648
sqft
|
built
1925
3500 James Ave N, Minneapolis, MN 55412
$142
Cash flow
3.0%
Cash-on-Cash Return
6.9%
Cap rate
1.0%
Rent to Value Ratio
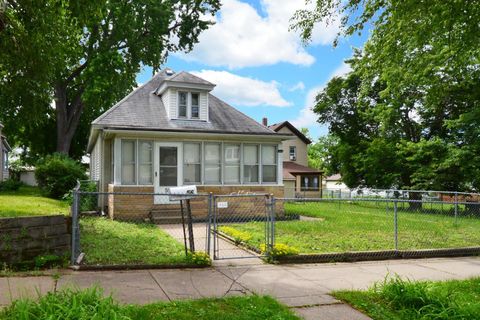
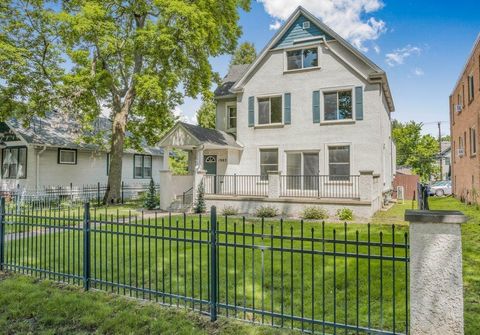
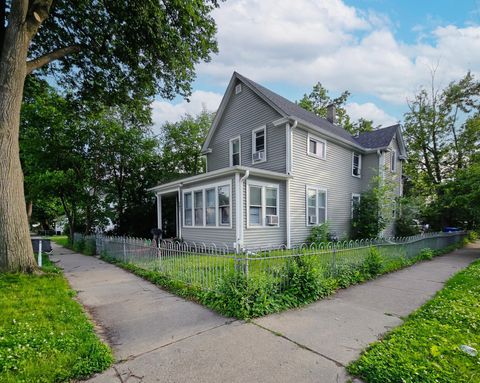
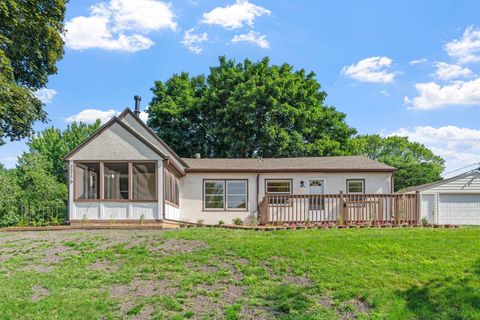
Active
$214,900
2
bds
|
1
ba
|
1,294
sqft
|
built
1909
56 Hatch Ave, Saint Paul, MN 55117
$26
Cash flow
0.6%
Cash-on-Cash Return
6.4%
Cap rate
0.9%
Rent to Value Ratio
5,858 out of 15,756 properties for sale in Minnesota
Limited Results Shown
Create a free account, or log in to reveal all property listings and enjoy the complete experience.
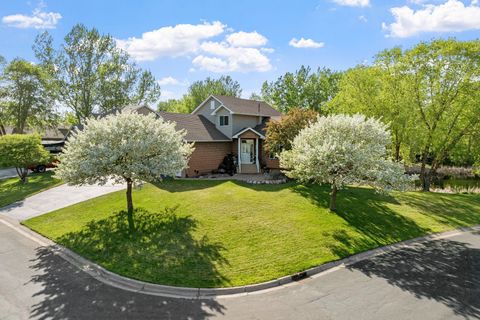
Active
$824,000
5
bds
|
4
ba
|
3,419
sqft
|
built
2023
10082 Arrowwood Trl, Woodbury, MN 55129
$-1,091
Cash flow
-6.9%
Cash-on-Cash Return
4.1%
Cap rate
0.5%
Rent to Value Ratio
Active
$250,000
3
bds
|
1
ba
|
1,648
sqft
|
built
1925
3500 James Ave N, Minneapolis, MN 55412
$142
Cash flow
3.0%
Cash-on-Cash Return
6.9%
Cap rate
1.0%
Rent to Value Ratio
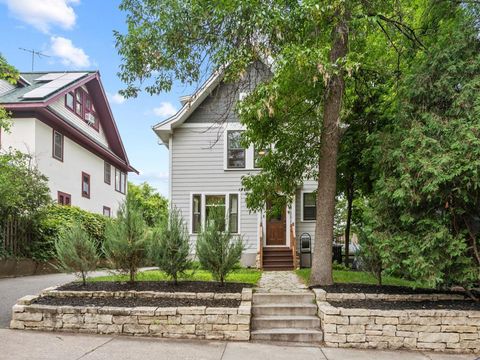
Active
$495,000
4
bds
|
3
ba
|
2,010
sqft
|
built
1888
981 Bayless Ave, Saint Paul, MN 55114
$-1,552
Cash flow
-16.4%
Cash-on-Cash Return
2.5%
Cap rate
0.5%
Rent to Value Ratio
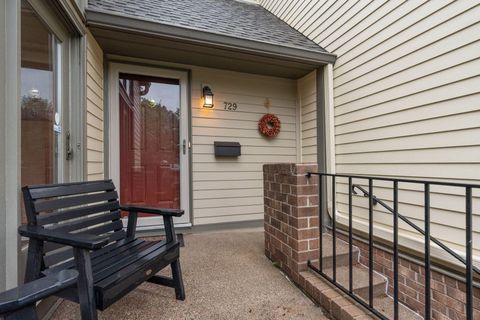
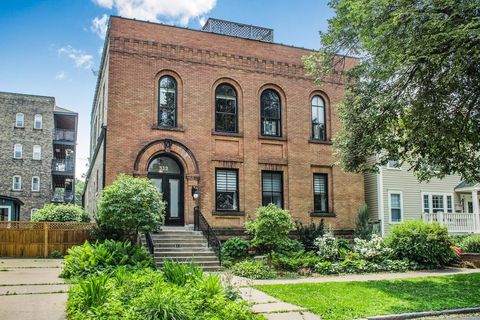
Active
$525,000
2
bds
|
3
ba
|
2,618
sqft
|
built
1984
729 Summit Ave, Saint Paul, MN 55105
$-1,586
Cash flow
-15.8%
Cash-on-Cash Return
2.6%
Cap rate
0.7%
Rent to Value Ratio
Active
$269,900
3
bds
|
2
ba
|
1,320
sqft
|
built
1925
2112 Manitou Ave, Saint Paul, MN 55119
$-441
Cash flow
-8.5%
Cash-on-Cash Return
4.3%
Cap rate
0.7%
Rent to Value Ratio
Active
$214,900
2
bds
|
1
ba
|
1,294
sqft
|
built
1909
56 Hatch Ave, Saint Paul, MN 55117
$26
Cash flow
0.6%
Cash-on-Cash Return
6.4%
Cap rate
0.9%
Rent to Value Ratio
Active
$354,900
4
bds
|
2
ba
|
1,810
sqft
|
built
1900
402 Clifton St, Saint Paul, MN 55102
$-160
Cash flow
-2.4%
Cash-on-Cash Return
5.1%
Cap rate
0.8%
Rent to Value Ratio
Active
$330,000
2
bds
|
2
ba
|
1,709
sqft
|
built
1986
15 Round Lake Trl, Saint Paul, MN 55117
$-653
Cash flow
-10.3%
Cash-on-Cash Return
3.3%
Cap rate
0.7%
Rent to Value Ratio
Active
$849,900
5
bds
|
6
ba
|
5,229
sqft
|
built
2001
7343 256th St, Wyoming, MN 55092
$-1,275
Cash flow
-7.8%
Cash-on-Cash Return
3.9%
Cap rate
0.7%
Rent to Value Ratio
Active
$469,900
5
bds
|
3
ba
|
2,422
sqft
|
built
1890
1903 Grand Ave, Saint Paul, MN 55105
$-655
Cash flow
-7.3%
Cash-on-Cash Return
4.0%
Cap rate
0.7%
Rent to Value Ratio
Active
$349,900
3
bds
|
3
ba
|
1,716
sqft
|
built
2004
7636 Arbor Ln, Savage, MN 55378
$-803
Cash flow
-12.0%
Cash-on-Cash Return
2.9%
Cap rate
0.6%
Rent to Value Ratio
Active
$374,900
3
bds
|
3
ba
|
1,911
sqft
|
built
2016
3292 Lakewood Trl, Woodbury, MN 55129
$-511
Cash flow
-7.1%
Cash-on-Cash Return
4.0%
Cap rate
0.7%
Rent to Value Ratio
Active
$375,000
3
bds
|
2
ba
|
1,698
sqft
|
built
1953
2527 Cleveland St NE, Minneapolis, MN 55418
$-165
Cash flow
-2.3%
Cash-on-Cash Return
5.2%
Cap rate
0.8%
Rent to Value Ratio
Active
$519,000
3
bds
|
2
ba
|
1,620
sqft
|
built
1907
2408 Grand Ave S, Minneapolis, MN 55405
$-830
Cash flow
-8.3%
Cash-on-Cash Return
3.8%
Cap rate
0.6%
Rent to Value Ratio
Active
$575,000
2
bds
|
2
ba
|
1,806
sqft
|
built
1899
512 Laurel Ave, Saint Paul, MN 55102
$-1,606
Cash flow
-14.6%
Cash-on-Cash Return
2.3%
Cap rate
0.5%
Rent to Value Ratio
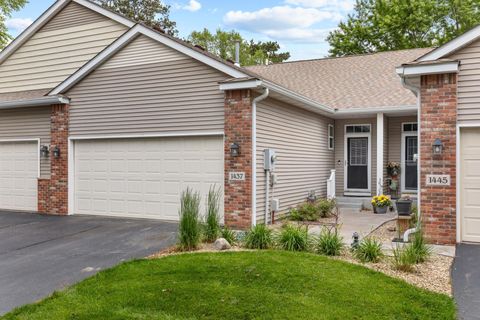
Active
$295,000
2
bds
|
2
ba
|
1,813
sqft
|
built
2003
1437 131st Dr NE, Minneapolis, MN 55449
$-382
Cash flow
-6.8%
Cash-on-Cash Return
4.7%
Cap rate
0.8%
Rent to Value Ratio
Active
$399,000
3
bds
|
2
ba
|
1,803
sqft
|
built
1940
5805 Sunrise Dr, Minneapolis, MN 55419
$-576
Cash flow
-7.5%
Cash-on-Cash Return
4.5%
Cap rate
0.7%
Rent to Value Ratio

Active
$198,500
2
bds
|
2
ba
|
1,125
sqft
|
built
2003
1600 Arundel St, Saint Paul, MN 55117
$-512
Cash flow
-13.5%
Cash-on-Cash Return
3.2%
Cap rate
0.9%
Rent to Value Ratio
Active
$359,500
5
bds
|
2
ba
|
1,042
sqft
|
built
1900
597 Virginia St, Saint Paul, MN 55103
$-1,032
Cash flow
-15.0%
Cash-on-Cash Return
2.8%
Cap rate
0.5%
Rent to Value Ratio

Active
$229,000
2
bds
|
1
ba
|
1,476
sqft
|
built
2003
114123 Hundertmark Rd, Chaska, MN 55318
$-254
Cash flow
-5.8%
Cash-on-Cash Return
4.3%
Cap rate
1.0%
Rent to Value Ratio
Active
$399,900
3
bds
|
1
ba
|
1,051
sqft
|
built
1918
2168 Centerview Ln, Mound, MN 55364
$-643
Cash flow
-8.4%
Cash-on-Cash Return
3.7%
Cap rate
0.6%
Rent to Value Ratio
Active
$339,900
2
bds
|
2
ba
|
1,144
sqft
|
built
1992
1913 Eastridge Ct, Stillwater, MN 55082
$-367
Cash flow
-5.6%
Cash-on-Cash Return
4.4%
Cap rate
0.6%
Rent to Value Ratio

Active
$709,900
4
bds
|
5
ba
|
4,500
sqft
|
built
2001
3135 Sherburn Pl SW, Rochester, MN 55902
$-1,503
Cash flow
-11.0%
Cash-on-Cash Return
3.1%
Cap rate
0.5%
Rent to Value Ratio

Active
$600,000
5
bds
|
4
ba
|
3,292
sqft
|
built
1978
1165 Kenilworth Dr, Woodbury, MN 55125
$-990
Cash flow
-8.6%
Cash-on-Cash Return
3.7%
Cap rate
0.6%
Rent to Value Ratio
Active
$259,900
4
bds
|
2
ba
|
1,680
sqft
|
built
1900
3114 Russell Ave N, Minneapolis, MN 55411
$-58
Cash flow
-1.2%
Cash-on-Cash Return
5.4%
Cap rate
0.8%
Rent to Value Ratio
Active
$374,900
3
bds
|
2
ba
|
1,603
sqft
|
built
1900
2216 W 57th St, Minneapolis, MN 55419
$-304
Cash flow
-4.2%
Cash-on-Cash Return
4.7%
Cap rate
0.7%
Rent to Value Ratio

Active
$274,900
1
bds
|
1
ba
|
860
sqft
|
built
1989
401 S 1st St, Minneapolis, MN 55401
$-937
Cash flow
-17.8%
Cash-on-Cash Return
1.6%
Cap rate
0.7%
Rent to Value Ratio
Active
$270,000
4
bds
|
1
ba
|
1,069
sqft
|
built
1937
917 Jessie St, Saint Paul, MN 55130
$-343
Cash flow
-6.6%
Cash-on-Cash Return
4.7%
Cap rate
0.7%
Rent to Value Ratio
Active
$725,000
4
bds
|
3
ba
|
2,709
sqft
|
built
2010
2260 Brewster St, Saint Paul, MN 55108
$-1,711
Cash flow
-12.3%
Cash-on-Cash Return
3.4%
Cap rate
0.5%
Rent to Value Ratio
Active
$365,000
3
bds
|
2
ba
|
1,807
sqft
|
built
1929
1441 Simpson St, Saint Paul, MN 55108
$-155
Cash flow
-2.2%
Cash-on-Cash Return
5.2%
Cap rate
0.8%
Rent to Value Ratio
Active
$559,900
4
bds
|
4
ba
|
3,443
sqft
|
built
1999
5390 157th St N, Hugo, MN 55038
$-972
Cash flow
-9.1%
Cash-on-Cash Return
3.6%
Cap rate
0.6%
Rent to Value Ratio

Active
$444,900
4
bds
|
3
ba
|
2,103
sqft
|
built
2022
12719 Erskin Cir, Blaine, MN 55449
$-304
Cash flow
-3.6%
Cash-on-Cash Return
4.9%
Cap rate
0.7%
Rent to Value Ratio

Active
$474,900
2
bds
|
2
ba
|
1,155
sqft
|
built
2007
240 Spring St, Saint Paul, MN 55102
$-1,632
Cash flow
-17.9%
Cash-on-Cash Return
1.6%
Cap rate
0.5%
Rent to Value Ratio

Active
$500,000
3
bds
|
2
ba
|
1,866
sqft
|
built
2021
2343 Aloha Ave, Shakopee, MN 55379
$-782
Cash flow
-8.2%
Cash-on-Cash Return
3.8%
Cap rate
0.6%
Rent to Value Ratio
Active
$170,000
1
bds
|
1
ba
|
656
sqft
|
built
1964
2700 W 44th St, Minneapolis, MN 55410
$-494
Cash flow
-15.2%
Cash-on-Cash Return
2.2%
Cap rate
0.9%
Rent to Value Ratio
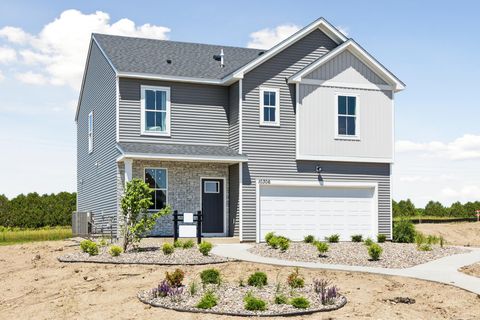
Active
$502,615
4
bds
|
3
ba
|
2,166
sqft
|
built
2024
10306 Duval Rd, Woodbury, MN 55129
$-599
Cash flow
-6.2%
Cash-on-Cash Return
4.2%
Cap rate
0.6%
Rent to Value Ratio
Active
$236,000
2
bds
|
2
ba
|
1,200
sqft
|
built
1995
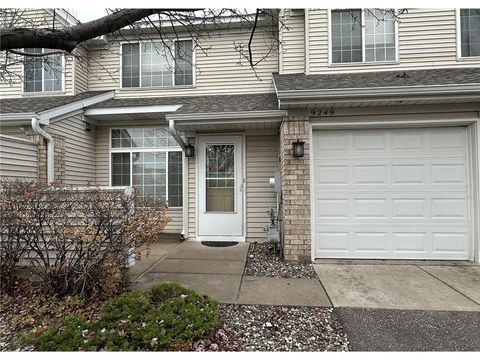
9249 Troon Ct, Woodbury, MN 55125
$-311
Cash flow
-6.9%
Cash-on-Cash Return
4.1%
Cap rate
0.8%
Rent to Value Ratio

Active
$749,900
4
bds
|
4
ba
|
3,199
sqft
|
built
1922
3201 Xenwood Ave S, Saint Louis Park, MN 55416
$-1,867
Cash flow
-13.0%
Cash-on-Cash Return
2.7%
Cap rate
0.4%
Rent to Value Ratio
Active
$309,000
2
bds
|
2
ba
|
1,600
sqft
|
built
2003
13832 54th Ave N, Minneapolis, MN 55446
$-457
Cash flow
-7.7%
Cash-on-Cash Return
3.9%
Cap rate
0.7%
Rent to Value Ratio
Active
$380,000
4
bds
|
2
ba
|
2,922
sqft
|
built
1960
8818 18th Ave S, Minneapolis, MN 55425
$-281
Cash flow
-3.9%
Cash-on-Cash Return
4.8%
Cap rate
0.7%
Rent to Value Ratio