Minnesota Investment Properties for Sale
Browse homes for sale and investment properties in Minnesota. Refine your search by price, property type, or more.
Best cash flowing properties in Minnesota
Active
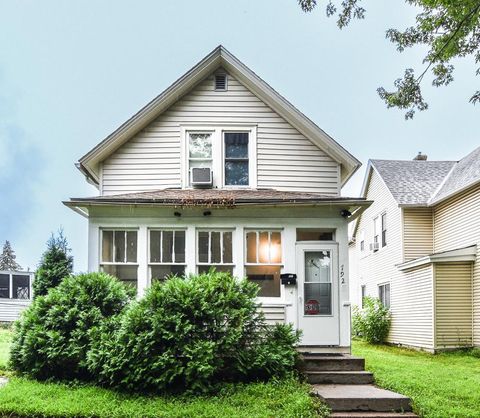
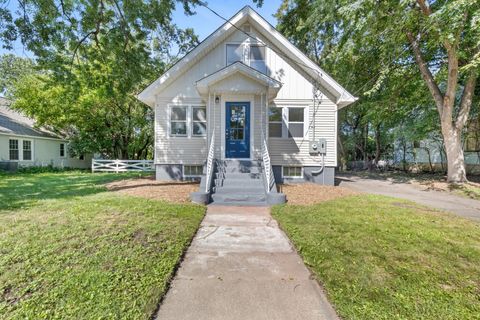
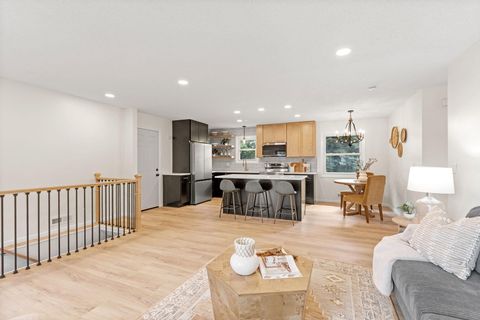
$190,000
2
bds
|
1
ba
|
930
sqft
|
built
1880
792 Cook Ave E, Saint Paul, MN 55106
$205
Cash flow
5.6%
Cash-on-Cash Return
7.0%
Cap rate
0.8%
Rent to Value Ratio
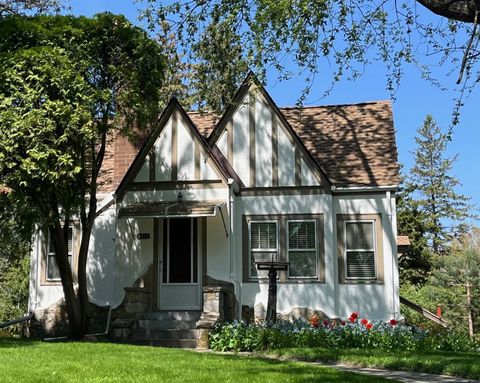
Active
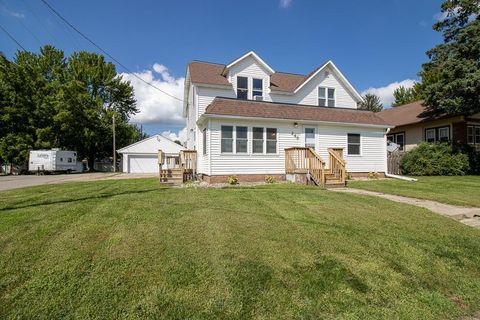
$225,000
3
bds
|
2
ba
|
2,082
sqft
|
built
1912
260 E Minnesota St, Le Center, MN 56057
$39
Cash flow
0.9%
Cash-on-Cash Return
5.9%
Cap rate
0.9%
Rent to Value Ratio
5,583 out of 11,439 properties for sale in Minnesota
Limited Results Shown
Create a free account, or log in to reveal all property listings and enjoy the complete experience.
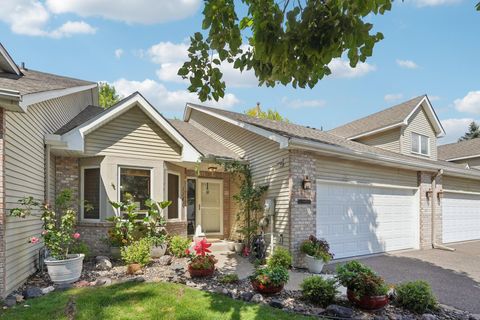
Active
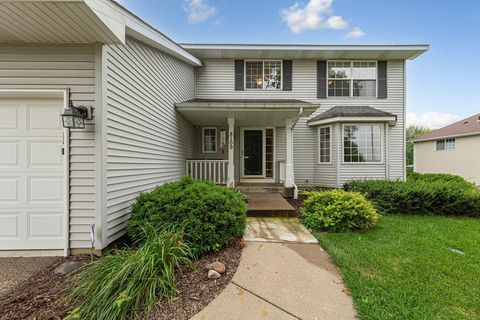
$479,900
4
bds
|
4
ba
|
2,712
sqft
|
built
1997
8109 139th St, Savage, MN 55378
$-516
Cash flow
-5.6%
Cash-on-Cash Return
4.4%
Cap rate
0.6%
Rent to Value Ratio
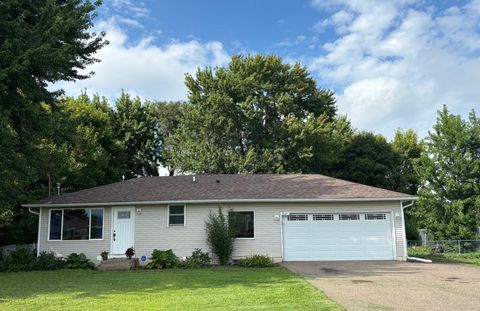
Active
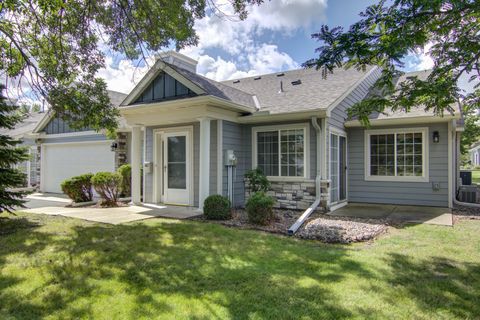
$299,900
2
bds
|
2
ba
|
1,251
sqft
|
built
1994
9851 Moonbeam Ln, Woodbury, MN 55125
$-429
Cash flow
-7.5%
Cash-on-Cash Return
4.0%
Cap rate
0.7%
Rent to Value Ratio
Active
$119,900
1
bds
|
1
ba
|
400
sqft
|
built
2006
46019 Highway 47, Isle, MN 56342
$25
Cash flow
1.1%
Cash-on-Cash Return
5.9%
Cap rate
0.9%
Rent to Value Ratio
Active
$899,000
4
bds
|
3
ba
|
3,328
sqft
|
built
1984
21350 Oakdale Dr, Rogers, MN 55374
$-2,023
Cash flow
-11.7%
Cash-on-Cash Return
3.0%
Cap rate
0.5%
Rent to Value Ratio
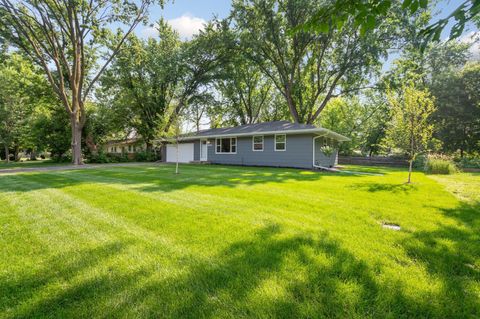
Active
$350,000
4
bds
|
2
ba
|
2,271
sqft
|
built
1958
6602 36th Ave N, Crystal, MN 55427
$-255
Cash flow
-3.8%
Cash-on-Cash Return
4.8%
Cap rate
0.7%
Rent to Value Ratio
Active
$269,900
3
bds
|
2
ba
|
2,022
sqft
|
built
1955
1615 13th St S, Moorhead, MN 56560
$0
Cash flow
0.0%
Cash-on-Cash Return
5.7%
Cap rate
0.8%
Rent to Value Ratio
Active
$250,000
2
bds
|
1
ba
|
924
sqft
|
built
1967
4963 Crofoot Ave NW, Buffalo, MN 55313
$-210
Cash flow
-4.4%
Cash-on-Cash Return
4.7%
Cap rate
0.6%
Rent to Value Ratio
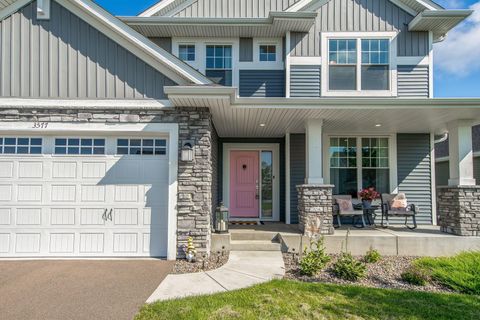
Active
$400,000
4
bds
|
4
ba
|
2,098
sqft
|
built
2017
21469 Lena Trl, Big Lake, MN 55309
$-346
Cash flow
-4.5%
Cash-on-Cash Return
4.6%
Cap rate
0.7%
Rent to Value Ratio

Active
$3,150,000
2
bds
|
3
ba
|
2,500
sqft
|
built
2021
1601 Noble Dr N, Golden Valley, MN 55422
$-14,342
Cash flow
-23.8%
Cash-on-Cash Return
0.2%
Cap rate
0.1%
Rent to Value Ratio
Active
$459,000
3
bds
|
3
ba
|
3,353
sqft
|
built
1988
2001 Folwell Dr SW, Rochester, MN 55902
$-442
Cash flow
-5.0%
Cash-on-Cash Return
4.5%
Cap rate
0.7%
Rent to Value Ratio
Active
$374,900
4
bds
|
2
ba
|
2,120
sqft
|
built
1956
2415 Decatur Ave S, Saint Louis Park, MN 55426
$-181
Cash flow
-2.5%
Cash-on-Cash Return
5.1%
Cap rate
0.8%
Rent to Value Ratio
Active
$380,000
2
bds
|
2
ba
|
1,650
sqft
|
built
1923
2744 Toledo Ave S, Saint Louis Park, MN 55416
$-306
Cash flow
-4.2%
Cash-on-Cash Return
4.7%
Cap rate
0.7%
Rent to Value Ratio
Active
$299,000
3
bds
|
2
ba
|
1,832
sqft
|
built
1976
10436 Yorktown Ln N, Maple Grove, MN 55369
$-568
Cash flow
-9.9%
Cash-on-Cash Return
3.4%
Cap rate
0.7%
Rent to Value Ratio
Active
$399,900
4
bds
|
2
ba
|
1,843
sqft
|
built
1968
11632 Utah Ave N, Champlin, MN 55316
$-653
Cash flow
-8.5%
Cash-on-Cash Return
3.7%
Cap rate
0.6%
Rent to Value Ratio
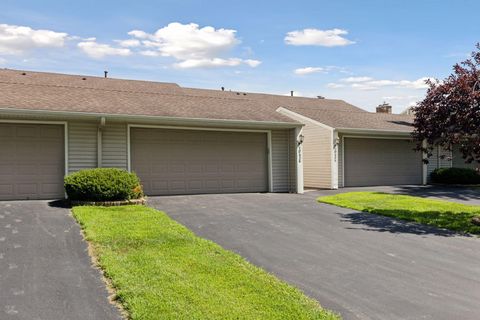
Active
$634,900
5
bds
|
4
ba
|
3,663
sqft
|
built
2022
3577 110th Ln NE, Blaine, MN 55449
$-818
Cash flow
-6.7%
Cash-on-Cash Return
4.1%
Cap rate
0.6%
Rent to Value Ratio
Active
$355,000
2
bds
|
2
ba
|
1,519
sqft
|
built
1995
1140 Trenton Cir N, Plymouth, MN 55441
$-930
Cash flow
-13.7%
Cash-on-Cash Return
2.5%
Cap rate
0.6%
Rent to Value Ratio
Active
$414,900
3
bds
|
2
ba
|
2,002
sqft
|
built
1940
8616 Park Ave, Saint Bonifacius, MN 55375
$-636
Cash flow
-8.0%
Cash-on-Cash Return
3.8%
Cap rate
0.5%
Rent to Value Ratio
Active
$285,000
2
bds
|
1
ba
|
1,048
sqft
|
built
1950
1021 Diffley Rd, Eagan, MN 55123
$-211
Cash flow
-3.9%
Cash-on-Cash Return
4.8%
Cap rate
0.7%
Rent to Value Ratio
Active
$375,000
5
bds
|
2
ba
|
1,792
sqft
|
built
1969
8409 67th Ave N, Brooklyn Park, MN 55428
$-725
Cash flow
-10.1%
Cash-on-Cash Return
3.4%
Cap rate
0.5%
Rent to Value Ratio
Active
$279,900
2
bds
|
2
ba
|
1,836
sqft
|
built
2003
220 6th St NE, Montgomery, MN 56069
$-283
Cash flow
-5.3%
Cash-on-Cash Return
4.5%
Cap rate
0.8%
Rent to Value Ratio
Active
$425,000
3
bds
|
3
ba
|
2,264
sqft
|
built
1982
2297 Timberlea Dr, Woodbury, MN 55125
$-446
Cash flow
-5.5%
Cash-on-Cash Return
4.4%
Cap rate
0.7%
Rent to Value Ratio
Active
$425,000
3
bds
|
2
ba
|
1,896
sqft
|
built
1993
2401 Leyland Trl, Woodbury, MN 55125
$-291
Cash flow
-3.6%
Cash-on-Cash Return
4.9%
Cap rate
0.7%
Rent to Value Ratio
Active
$550,000
4
bds
|
3
ba
|
2,458
sqft
|
built
2008
30863 105th St, Princeton, MN 55371
$-1,000
Cash flow
-9.5%
Cash-on-Cash Return
3.5%
Cap rate
0.5%
Rent to Value Ratio
Active
$680,000
4
bds
|
4
ba
|
3,359
sqft
|
built
1986
855 Eagle Ridge Ln, Stillwater, MN 55082
$-1,410
Cash flow
-10.8%
Cash-on-Cash Return
3.2%
Cap rate
0.5%
Rent to Value Ratio
Active
$139,900
1
bds
|
1
ba
|
780
sqft
|
built
1986
1425 W 28th St, Minneapolis, MN 55408
$-599
Cash flow
-22.3%
Cash-on-Cash Return
0.5%
Cap rate
1.0%
Rent to Value Ratio
Active
$370,000
4
bds
|
2
ba
|
1,820
sqft
|
built
1978
13041 Union Terrace Ln N, Champlin, MN 55316
$-223
Cash flow
-3.1%
Cash-on-Cash Return
5.0%
Cap rate
0.8%
Rent to Value Ratio
Active
$469,900
4
bds
|
3
ba
|
2,662
sqft
|
built
1988
4624 89th Cres N, Brooklyn Park, MN 55443
$-771
Cash flow
-8.6%
Cash-on-Cash Return
3.7%
Cap rate
0.6%
Rent to Value Ratio
Active
$214,900
2
bds
|
1
ba
|
760
sqft
|
built
1986
3388 Upper 149th St W, Rosemount, MN 55068
$-122
Cash flow
-3.0%
Cash-on-Cash Return
5.0%
Cap rate
0.8%
Rent to Value Ratio
Active
$474,900
3
bds
|
2
ba
|
1,786
sqft
|
built
1980
8755 Griffith Ave NW, Maple Lake, MN 55358
$-749
Cash flow
-8.2%
Cash-on-Cash Return
3.8%
Cap rate
0.5%
Rent to Value Ratio
Active
$625,000
4
bds
|
3
ba
|
2,036
sqft
|
built
1913
1272 Hartford Ave, Saint Paul, MN 55116
$-1,834
Cash flow
-15.3%
Cash-on-Cash Return
2.2%
Cap rate
0.5%
Rent to Value Ratio
Active
$299,900
3
bds
|
2
ba
|
1,344
sqft
|
built
1959
2168 5th St E, Saint Paul, MN 55119
$-253
Cash flow
-4.4%
Cash-on-Cash Return
4.7%
Cap rate
0.7%
Rent to Value Ratio
Active
$549,900
5
bds
|
2
ba
|
1,865
sqft
|
built
1940
1368 Pleasant Ave, Saint Paul, MN 55102
$-1,225
Cash flow
-11.6%
Cash-on-Cash Return
3.0%
Cap rate
0.5%
Rent to Value Ratio
Active
$525,000
4
bds
|
3
ba
|
2,570
sqft
|
built
1971
13128 Elm Cir, Burnsville, MN 55337
$-744
Cash flow
-7.4%
Cash-on-Cash Return
4.0%
Cap rate
0.6%
Rent to Value Ratio
Active
$435,000
4
bds
|
2
ba
|
1,908
sqft
|
built
1973
15520 95th Cir NE, Otsego, MN 55330
$-952
Cash flow
-11.4%
Cash-on-Cash Return
3.1%
Cap rate
0.5%
Rent to Value Ratio
Active
$449,999
4
bds
|
3
ba
|
3,093
sqft
|
built
2003
4611 19th St SW, Forest Lake, MN 55025
$-1,175
Cash flow
-13.6%
Cash-on-Cash Return
2.5%
Cap rate
0.6%
Rent to Value Ratio
Active
$699,900
3
bds
|
4
ba
|
2,706
sqft
|
built
2014
4301 Nokomis Ave, Minneapolis, MN 55406
$-1,654
Cash flow
-12.3%
Cash-on-Cash Return
2.8%
Cap rate
0.5%
Rent to Value Ratio
Active
$339,000
4
bds
|
3
ba
|
2,062
sqft
|
built
1900
1423 Penn Ave N, Minneapolis, MN 55411
$-551
Cash flow
-8.5%
Cash-on-Cash Return
3.7%
Cap rate
0.6%
Rent to Value Ratio
Active
$274,900
3
bds
|
3
ba
|
1,750
sqft
|
built
2003
1215 Norton Ave NE, Fridley, MN 55432
$-327
Cash flow
-6.2%
Cash-on-Cash Return
4.3%
Cap rate
0.8%
Rent to Value Ratio