Montgomery, TX Investment Properties for Sale
Browse homes for sale and investment properties in Montgomery, TX. Refine your search by price, property type, or more.
Best cash flowing properties in Montgomery, TX

Active
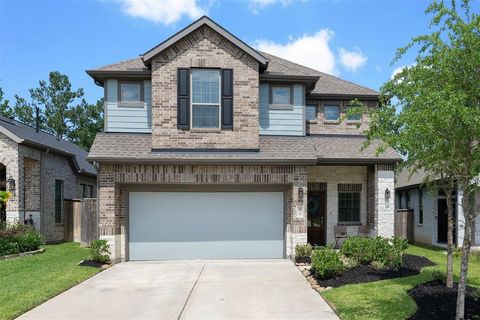
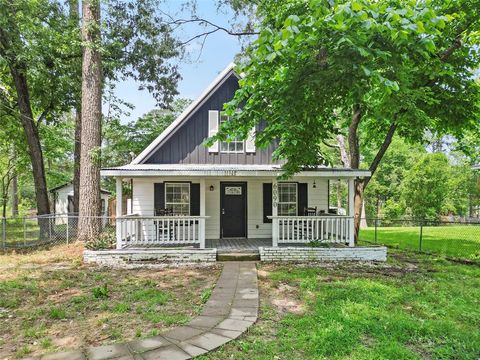
$255,000
3
bds
|
0
ba
|
1,624
sqft
|
built
1976
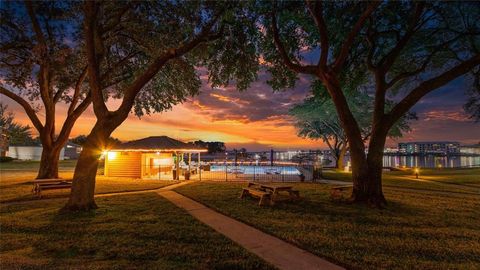
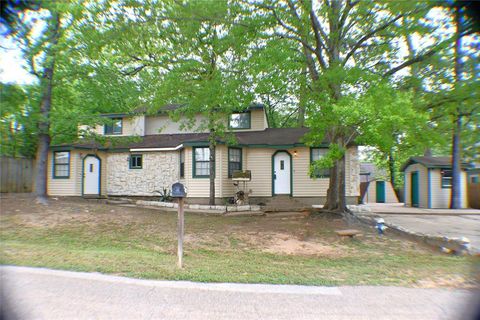
118 April Point Dr N, Montgomery, TX 77356
$426
Cash flow
8.7%
Cash-on-Cash Return
7.7%
Cap rate
1.0%
Rent to Value Ratio

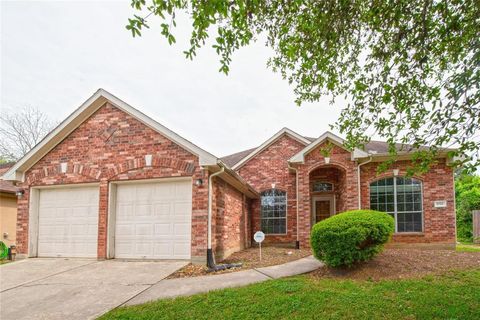
Active
$79,000
2
bds
|
0
ba
|
800
sqft
|
built
1966
16777 Stinson Ln, Montgomery, TX 77316
$385
Cash flow
25.4%
Cash-on-Cash Return
11.5%
Cap rate
1.6%
Rent to Value Ratio
590 out of 735 properties for sale in Montgomery, TX
Limited Results Shown
Create a free account, or log in to reveal all property listings and enjoy the complete experience.

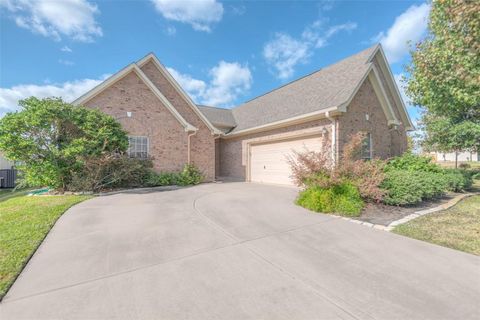
Active
$294,600
2
bds
|
0
ba
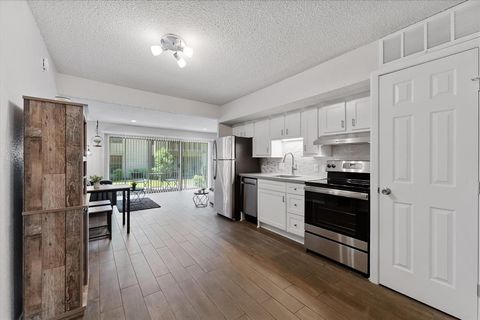
|
1,168
sqft
|
built
1978
15575 Marina Dr, Montgomery, TX 77356
$-851
Cash flow
-15.1%
Cash-on-Cash Return
2.2%
Cap rate
0.7%
Rent to Value Ratio

Active
$960,000
3
bds
|
0
ba
|
2,897
sqft
|
built
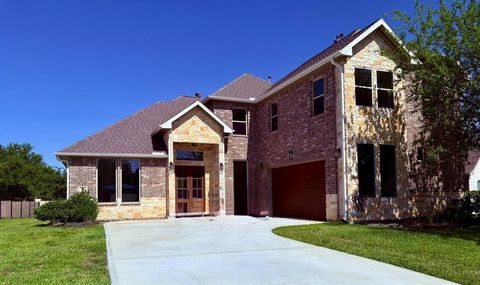
2008
26173 Crown Ranch Blvd, Montgomery, TX 77316
$-2,678
Cash flow
-14.6%
Cash-on-Cash Return
2.3%
Cap rate
0.5%
Rent to Value Ratio

Active
$1,600,000
3
bds
|
0
ba
|
2,360
sqft
|
built
2016
25637 W Fm 1097 Rd, Montgomery, TX 77356
$-5,796
Cash flow
-18.9%
Cash-on-Cash Return
1.3%
Cap rate
0.2%
Rent to Value Ratio

Active
$1,395,000
4
bds
|
0
ba
|
3,572
sqft
|
built
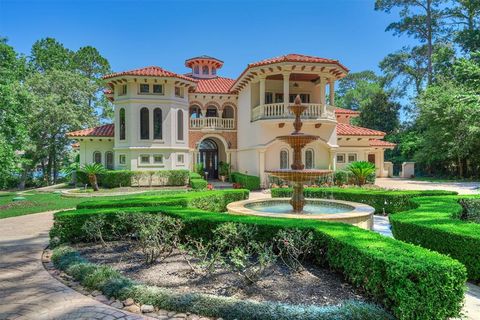
1995
3742 Walden Estates Dr, Montgomery, TX 77356
$-5,348
Cash flow
-20.0%
Cash-on-Cash Return
1.1%
Cap rate
0.3%
Rent to Value Ratio

Active
$275,000
2
bds
|
0
ba
|
866
sqft
|
built
1996
12800 Melville Dr, Montgomery, TX 77356
$-850
Cash flow
-16.1%
Cash-on-Cash Return
2.0%
Cap rate
0.7%
Rent to Value Ratio

Active
$875,000
3
bds
|
0
ba
|
3,233
sqft
|
built
2005
11584 Grandview Dr, Montgomery, TX 77356
$-2,428
Cash flow
-14.5%
Cash-on-Cash Return
2.3%
Cap rate
0.5%
Rent to Value Ratio
Active
$1,100,000
4
bds
|
0
ba
|
3,938
sqft
|
built
2004
11420 Grand Pine Dr, Montgomery, TX 77356
$-1,850
Cash flow
-8.8%
Cash-on-Cash Return
3.7%
Cap rate
0.6%
Rent to Value Ratio

Active
$490,375
3
bds
|
0
ba
|
3,219
sqft
|
built
1997
110 Wick Willow Dr, Montgomery, TX 77356
$-1,016
Cash flow
-10.8%
Cash-on-Cash Return
3.2%
Cap rate
0.6%
Rent to Value Ratio
Active
$315,000
3
bds
|
0
ba
|
1,924
sqft
|
built
2016
114 Mimosa Silk Ct, Montgomery, TX 77316
$-610
Cash flow
-10.1%
Cash-on-Cash Return
3.4%
Cap rate
0.7%
Rent to Value Ratio

Active
$324,900
4
bds
|
0
ba
|
1,877
sqft
|
built
2021
1144 Courteous Creek Dr, Montgomery, TX 77316
$-763
Cash flow
-12.3%
Cash-on-Cash Return
2.9%
Cap rate
0.7%
Rent to Value Ratio
Active
$410,000
4
bds
|
0
ba
|
2,479
sqft
|
built
2021
235 Crest Edge St, Montgomery, TX 77316
$-936
Cash flow
-11.9%
Cash-on-Cash Return
2.9%
Cap rate
0.7%
Rent to Value Ratio
Active
$320,000
4
bds
|
0
ba
|
1,984
sqft
|
built
2004
3722 Northshore Dr, Montgomery, TX 77356
$-896
Cash flow
-14.6%
Cash-on-Cash Return
2.3%
Cap rate
0.6%
Rent to Value Ratio

Active
$449,900
4
bds
|
0
ba
|
2,780
sqft
|
built
2022
20159 Clear Ridge Ln, Montgomery, TX 77316
$-1,087
Cash flow
-12.6%
Cash-on-Cash Return
2.8%
Cap rate
0.7%
Rent to Value Ratio
Active
$1,599,000
4
bds
|
0
ba
|
5,074
sqft
|
built
2016
12838 Lake Shore Dr, Montgomery, TX 77356
$-4,371
Cash flow
-14.3%
Cash-on-Cash Return
2.4%
Cap rate
0.5%
Rent to Value Ratio

Active
$2,950,000
6
bds
|
0
ba
|
8,018
sqft
|
built
2008
19996 Crescent Ct, Montgomery, TX 77356
$-10,796
Cash flow
-19.1%
Cash-on-Cash Return
1.3%
Cap rate
0.3%
Rent to Value Ratio
Active
$230,000
3
bds
|
0
ba
|
1,539
sqft
|
built
1984
10419 Twin Circles Dr, Montgomery, TX 77356
$-166
Cash flow
-3.8%
Cash-on-Cash Return
4.8%
Cap rate
0.8%
Rent to Value Ratio
Active
$727,400
bds
|
0
ba
|
2,279
sqft
|
built
2010
23405 Martha Williams Rd, Montgomery, TX 77356
$-1,578
Cash flow
-11.3%
Cash-on-Cash Return
3.1%
Cap rate
0.5%
Rent to Value Ratio
Active
$800,000
4
bds
|
0
ba
|
4,079
sqft
|
built
2005
90 Greenview St, Montgomery, TX 77356
$-1,749
Cash flow
-11.4%
Cash-on-Cash Return
3.1%
Cap rate
0.6%
Rent to Value Ratio

Active
$599,000
5
bds
|
0
ba
|
2,710
sqft
|
built
2022
221 Sky Top Dr, Montgomery, TX 77316
$-1,132
Cash flow
-9.9%
Cash-on-Cash Return
3.4%
Cap rate
0.7%
Rent to Value Ratio
Active
$578,999
3
bds
|
0
ba
|
3,292
sqft
|
built
2022
55 Ruskin Dr W, Montgomery, TX 77356
$-742
Cash flow
-6.7%
Cash-on-Cash Return
4.1%
Cap rate
0.5%
Rent to Value Ratio
Active
$115,000
1
bds
|
0
ba
|
618
sqft
|
built
1979
12900 Walden Rd, Montgomery, TX 77356
$-168
Cash flow
-7.6%
Cash-on-Cash Return
3.9%
Cap rate
1.0%
Rent to Value Ratio

Active
$109,000
1
bds
|
0
ba
|
489
sqft
|
built
1979
13151 Walden Rd, Montgomery, TX 77356
$-297
Cash flow
-14.2%
Cash-on-Cash Return
2.4%
Cap rate
0.9%
Rent to Value Ratio
Active
$319,000
1
bds
|
0
ba
|
852
sqft
|
built
1978
15575 Marina Dr, Montgomery, TX 77356
$-907
Cash flow
-14.8%
Cash-on-Cash Return
2.3%
Cap rate
0.6%
Rent to Value Ratio

Active
$325,000
3
bds
|
0
ba
|
1,771
sqft
|
built
2022
584 Long Leaf Pine Dr, Montgomery, TX 77316
$-651
Cash flow
-10.5%
Cash-on-Cash Return
3.3%
Cap rate
0.7%
Rent to Value Ratio

Active
$499,000
4
bds
|
0
ba
|
2,424
sqft
|
built
2022
168 Wick Willow Rd, Montgomery, TX 77356
$-985
Cash flow
-10.3%
Cash-on-Cash Return
3.3%
Cap rate
0.6%
Rent to Value Ratio
Active
$79,000
2
bds
|
0
ba
|
800
sqft
|
built
1966
16777 Stinson Ln, Montgomery, TX 77316
$385
Cash flow
25.4%
Cash-on-Cash Return
11.5%
Cap rate
1.6%
Rent to Value Ratio
Active
$255,000
3
bds
|
0
ba
|
1,624
sqft
|
built
1976
118 April Point Dr N, Montgomery, TX 77356
$426
Cash flow
8.7%
Cash-on-Cash Return
7.7%
Cap rate
1.0%
Rent to Value Ratio

Active
$695,000
4
bds
|
0
ba
|
2,890
sqft
|
built
2022
240 Fish Creek Ln, Montgomery, TX 77316
$-1,889
Cash flow
-14.2%
Cash-on-Cash Return
2.4%
Cap rate
0.6%
Rent to Value Ratio

Active
$275,000
3
bds
|
0
ba
|
1,741
sqft
|
built
1975
10190 Dogwood Loop, Montgomery, TX 77316
$-178
Cash flow
-3.4%
Cash-on-Cash Return
4.9%
Cap rate
0.7%
Rent to Value Ratio
Active
$4,500,000
4
bds
|
0
ba
|
8,154
sqft
|
built
2000
786 River Rd, Montgomery, TX 77356
$-16,429
Cash flow
-19.0%
Cash-on-Cash Return
1.3%
Cap rate
0.2%
Rent to Value Ratio
Active
$199,990
4
bds
|
0
ba
|
1,842
sqft
|
built
1988
16350 Eastchase, Montgomery, TX 77316
$-40
Cash flow
-1.0%
Cash-on-Cash Return
5.4%
Cap rate
0.9%
Rent to Value Ratio

Active
$350,000
2
bds
|
0
ba
|
995
sqft
|
built
1996
12800 Melville Dr, Montgomery, TX 77356
$-1,524
Cash flow
-22.7%
Cash-on-Cash Return
0.5%
Cap rate
0.5%
Rent to Value Ratio
Active
$999,000
5
bds
|
0
ba
|
4,987
sqft
|
built
2013
110 Pickerel Pt, Montgomery, TX 77316
$-1,955
Cash flow
-10.2%
Cash-on-Cash Return
3.3%
Cap rate
0.6%
Rent to Value Ratio
Active
$1,695,000
3
bds
|
0
ba
|
1,844
sqft
|
built
1999
6570 N Fm 1486 Rd, Montgomery, TX 77356
$-6,365
Cash flow
-19.6%
Cash-on-Cash Return
1.2%
Cap rate
0.2%
Rent to Value Ratio
Active
$750,000
4
bds
|
0
ba
|
2,922
sqft
|
built
2007
11068 First Lgt, Montgomery, TX 77356
$-2,178
Cash flow
-15.2%
Cash-on-Cash Return
2.2%
Cap rate
0.5%
Rent to Value Ratio
Active
$179,000
3
bds
|
0
ba
|
1,400
sqft
|
built
1971
6090 Skylane Dr, Montgomery, TX 77316
$25
Cash flow
0.7%
Cash-on-Cash Return
5.8%
Cap rate
0.9%
Rent to Value Ratio

Active
$210,000
3
bds
|
0
ba
|
1,400
sqft
|
built
1982
19995 Lakeway Ln, Montgomery, TX 77356
$-396
Cash flow
-9.8%
Cash-on-Cash Return
3.4%
Cap rate
0.5%
Rent to Value Ratio

Active
$3,500,000
bds
|
0
ba
|
0
sqft
|
built
2000
19637 W Fm 1097 Rd, Montgomery, TX 77356
$-15,107
Cash flow
-22.5%
Cash-on-Cash Return
0.5%
Cap rate
0.1%
Rent to Value Ratio
Active
$315,000
3
bds
|
0
ba
|
1,839
sqft
|
built
2004
11 Amelia Ct, Montgomery, TX 77356
$-543
Cash flow
-9.0%
Cash-on-Cash Return
3.6%
Cap rate
0.7%
Rent to Value Ratio

Active
$989,000
4
bds
|
0
ba
|
4,063
sqft
|
built
2004
11409 E Zoe Loop Dr, Montgomery, TX 77316
$-2,470
Cash flow
-13.0%
Cash-on-Cash Return
2.7%
Cap rate
0.5%
Rent to Value Ratio