Montgomery, TX Investment Properties for Sale
Browse homes for sale and investment properties in Montgomery, TX. Refine your search by price, property type, or more.
Best cash flowing properties in Montgomery, TX
Active
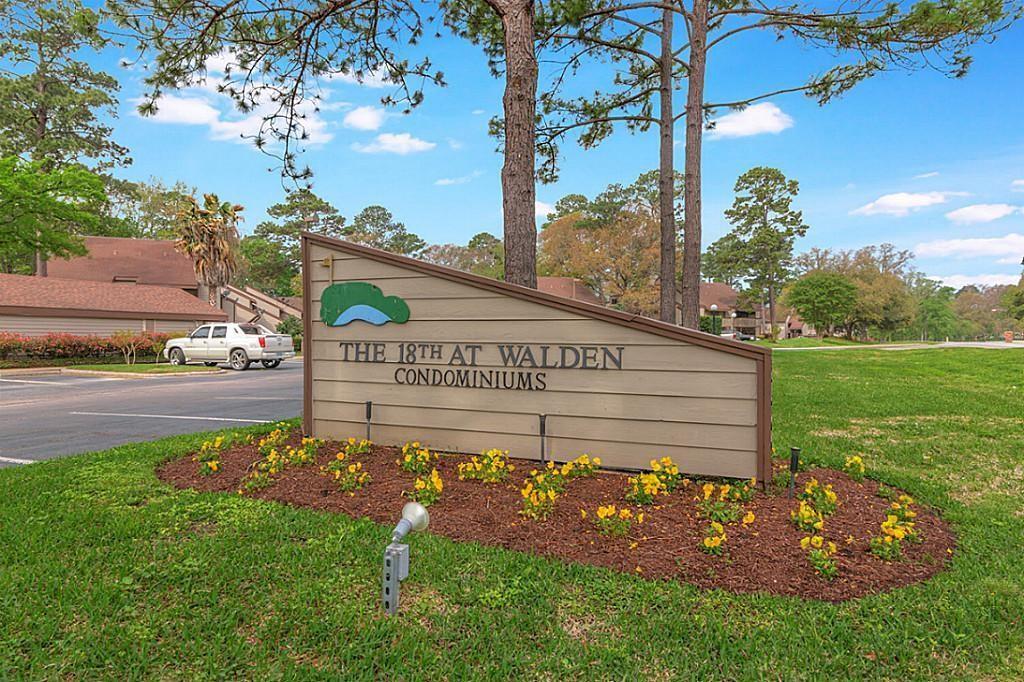
$124,000
2
bds
|
0
ba
|
866
sqft
|
built
1982
12900 Walden Rd, Montgomery, TX 77356
$221
Cash flow
9.3%
Cash-on-Cash Return
8.4%
Cap rate
1.1%
Rent to Value Ratio
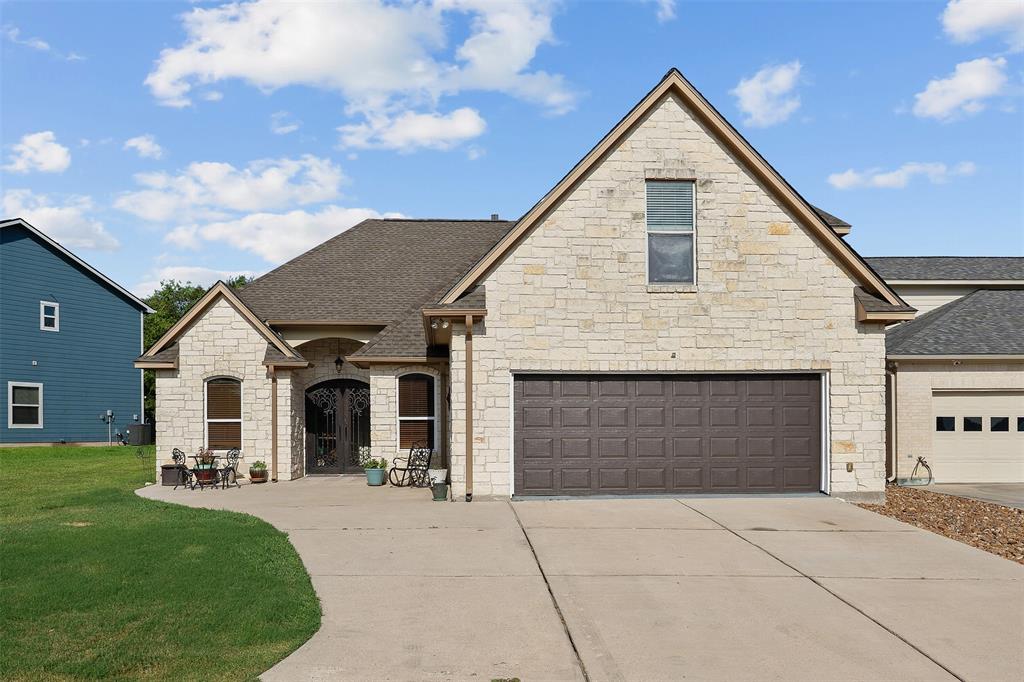
Active
$374,500
3
bds
|
0
ba
|
2,176
sqft
|
built
2012
216 Capetown, Montgomery, TX 77356
$-121
Cash flow
-1.7%
Cash-on-Cash Return
5.9%
Cap rate
0.7%
Rent to Value Ratio
616 out of 691 properties for sale in Montgomery, TX
Limited Results Shown
Create a free account, or log in to reveal all property listings and enjoy the complete experience.

Active
$599,999
5
bds
|
0
ba
|
2,587
sqft
|
built
2022
217 Sky Top Dr, Montgomery, TX 77316
$-1,401
Cash flow
-12.2%
Cash-on-Cash Return
3.5%
Cap rate
0.7%
Rent to Value Ratio

Active
$249,900
3
bds
|
0
ba
|
1,794
sqft
|
built
1979
39 Regency Pt, Montgomery, TX 77356
$-861
Cash flow
-18.0%
Cash-on-Cash Return
2.2%
Cap rate
0.8%
Rent to Value Ratio

Pending
$465,500
3
bds
|
0
ba
|
1,608
sqft
|
built
1998
6 Key Harbor Dr, Montgomery, TX 77356
$-1,796
Cash flow
-20.1%
Cash-on-Cash Return
1.7%
Cap rate
0.5%
Rent to Value Ratio

Active
$585,000
3
bds
|
0
ba
|
1,980
sqft
|
built
1992
125 Capetown, Montgomery, TX 77356
$-2,258
Cash flow
-20.1%
Cash-on-Cash Return
1.7%
Cap rate
0.4%
Rent to Value Ratio

Active
$629,900
3
bds
|
0
ba
|
3,595
sqft
|
built
2017
12122 Hawthorne Dr, Montgomery, TX 77356
$-1,498
Cash flow
-12.4%
Cash-on-Cash Return
3.4%
Cap rate
0.6%
Rent to Value Ratio
Active
$349,000
4
bds
|
0
ba
|
2,087
sqft
|
built
2020
151 Scenic Hills Ct, Montgomery, TX 77356
$-901
Cash flow
-13.5%
Cash-on-Cash Return
3.2%
Cap rate
0.7%
Rent to Value Ratio
Active
$2,750,000
5
bds
|
0
ba
|
7,924
sqft
|
built
2002
18724 Palm Beach Blvd, Montgomery, TX 77356
$-12,065
Cash flow
-22.9%
Cash-on-Cash Return
1.0%
Cap rate
0.3%
Rent to Value Ratio

Active
$340,000
2
bds
|
0
ba
|
1,024
sqft
|
built
1996
12800 Melville Dr, Montgomery, TX 77356
$-1,377
Cash flow
-21.1%
Cash-on-Cash Return
1.4%
Cap rate
0.6%
Rent to Value Ratio
Active
$739,000
4
bds
|
0
ba
|
3,437
sqft
|
built
2022
106 Golden Eye Ct, Montgomery, TX 77316
$-1,789
Cash flow
-12.6%
Cash-on-Cash Return
3.4%
Cap rate
0.7%
Rent to Value Ratio

Active
$270,000
3
bds
|
0
ba
|
1,672
sqft
|
built
1998
243 Fantasy Ln, Montgomery, TX 77356
$-475
Cash flow
-9.2%
Cash-on-Cash Return
4.2%
Cap rate
0.7%
Rent to Value Ratio
Active
$630,000
4
bds
|
0
ba
|
2,718
sqft
|
built
2021
454 Cape Conroe Dr, Montgomery, TX 77356
$-2,135
Cash flow
-17.7%
Cash-on-Cash Return
2.2%
Cap rate
0.4%
Rent to Value Ratio
Active
$1,175,000
4
bds
|
0
ba
|
4,783
sqft
|
built
2006
8408 Grand Lake Estates Dr, Montgomery, TX 77316
$-3,691
Cash flow
-16.4%
Cash-on-Cash Return
2.5%
Cap rate
0.5%
Rent to Value Ratio
Active
$1,539,000
4
bds
|
0
ba
|
4,680
sqft
|
built
2001
18750 E Cool Breeze Ln, Montgomery, TX 77356
$-5,823
Cash flow
-19.7%
Cash-on-Cash Return
1.7%
Cap rate
0.3%
Rent to Value Ratio
Active
$220,000
1
bds
|
0
ba
|
620
sqft
|
built
1996
12800 Melville Dr, Montgomery, TX 77356
$-851
Cash flow
-20.2%
Cash-on-Cash Return
1.6%
Cap rate
0.6%
Rent to Value Ratio
Active
$799,000
4
bds
|
0
ba
|
3,563
sqft
|
built
1998
28655 Deer Run St, Montgomery, TX 77356
$-2,110
Cash flow
-13.8%
Cash-on-Cash Return
3.1%
Cap rate
0.5%
Rent to Value Ratio
Active
$1,219,000
5
bds
|
0
ba
|
5,180
sqft
|
built
2004
18984 Harbor Side Blvd, Montgomery, TX 77356
$-3,137
Cash flow
-13.4%
Cash-on-Cash Return
3.2%
Cap rate
0.5%
Rent to Value Ratio

Active
$350,000
3
bds
|
0
ba
|
1,604
sqft
|
built
2020
106 Emory Birch Dr, Montgomery, TX 77316
$-924
Cash flow
-13.8%
Cash-on-Cash Return
3.1%
Cap rate
0.7%
Rent to Value Ratio

Active
$475,000
3
bds
|
0
ba
|
2,596
sqft
|
built
2012
114 Kohen Ct, Montgomery, TX 77316
$-464
Cash flow
-5.1%
Cash-on-Cash Return
5.1%
Cap rate
0.7%
Rent to Value Ratio
Active
$324,500
3
bds
|
0
ba
|
1,974
sqft
|
built
2021
255 S Spotted Fern Dr, Montgomery, TX 77316
$-871
Cash flow
-14.0%
Cash-on-Cash Return
3.1%
Cap rate
0.7%
Rent to Value Ratio
Active
$725,000
5
bds
|
0
ba
|
3,836
sqft
|
built
2022
117 Everest Dr, Montgomery, TX 77316
$-1,650
Cash flow
-11.9%
Cash-on-Cash Return
3.6%
Cap rate
0.7%
Rent to Value Ratio
Pending
$399,900
3
bds
|
0
ba
|
2,006
sqft
|
built
2016
110 Mayhaven Ct, Montgomery, TX 77316
$-1,146
Cash flow
-15.0%
Cash-on-Cash Return
2.8%
Cap rate
0.6%
Rent to Value Ratio
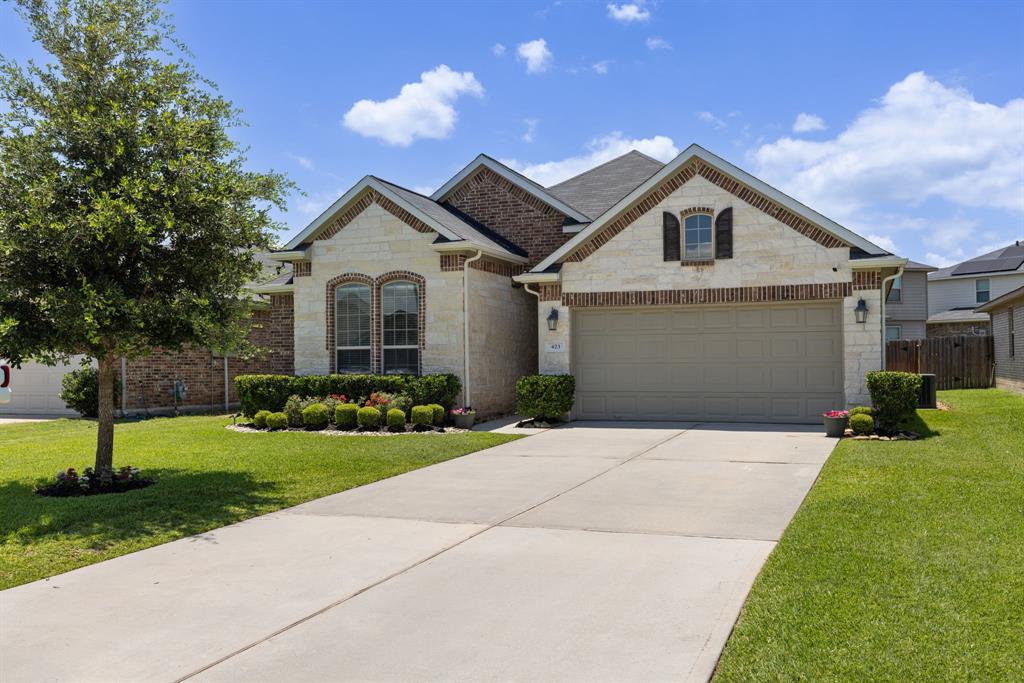
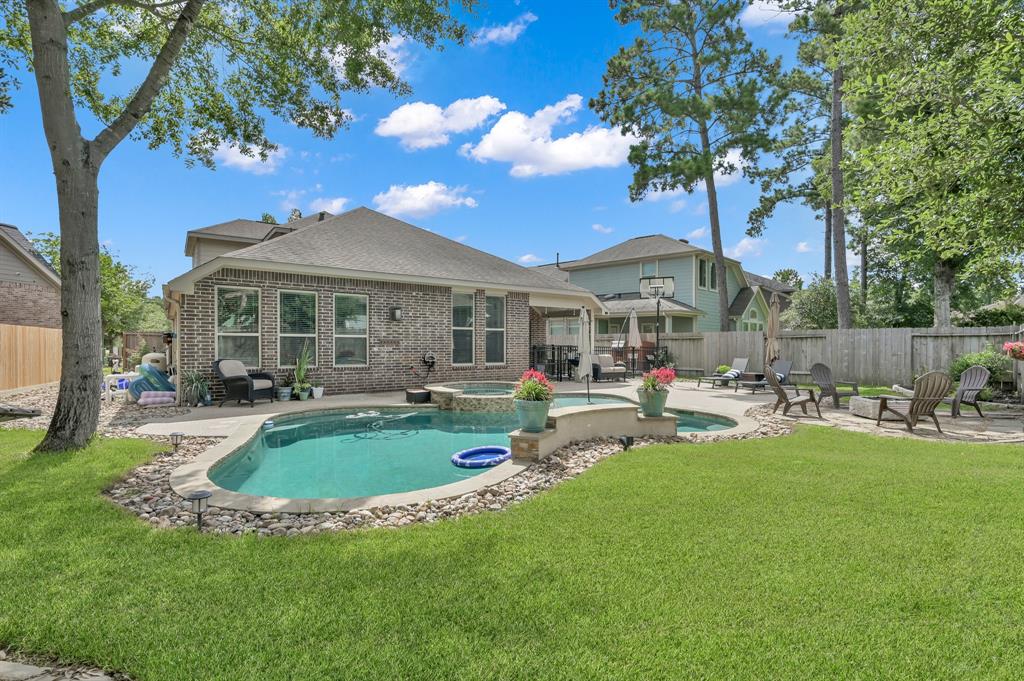
Active
$329,000
4
bds
|
0
ba
|
2,204
sqft
|
built
2019
423 Terra Vista Cir, Montgomery, TX 77356
$-697
Cash flow
-11.1%
Cash-on-Cash Return
3.7%
Cap rate
0.7%
Rent to Value Ratio
Active
$515,000
4
bds
|
0
ba
|
2,494
sqft
|
built
2016
138 Verismo Ct, Montgomery, TX 77316
$-1,359
Cash flow
-13.8%
Cash-on-Cash Return
3.1%
Cap rate
0.6%
Rent to Value Ratio
Active
$595,000
3
bds
|
0
ba
|
3,216
sqft
|
built
1996
1103 N Hunting Tower Run, Montgomery, TX 77316
$-1,564
Cash flow
-13.7%
Cash-on-Cash Return
3.1%
Cap rate
0.5%
Rent to Value Ratio
Active
$299,900
2
bds
|
0
ba
|
969
sqft
|
built
1985
801 River Rd, Montgomery, TX 77356
$-1,080
Cash flow
-18.8%
Cash-on-Cash Return
2.0%
Cap rate
0.6%
Rent to Value Ratio
Active
$750,000
5
bds
|
0
ba
|
3,821
sqft
|
built
2020
404 Christians Ct, Montgomery, TX 77316
$-1,761
Cash flow
-12.3%
Cash-on-Cash Return
3.5%
Cap rate
0.7%
Rent to Value Ratio
Active
$550,000
3
bds
|
0
ba
|
2,885
sqft
|
built
1995
190 Park Way, Montgomery, TX 77356
$-1,221
Cash flow
-11.6%
Cash-on-Cash Return
3.6%
Cap rate
0.7%
Rent to Value Ratio
Active
$799,000
3
bds
|
0
ba
|
2,777
sqft
|
built
2001
15569 Zoe Loop Dr, Montgomery, TX 77316
$-2,214
Cash flow
-14.5%
Cash-on-Cash Return
3.0%
Cap rate
0.5%
Rent to Value Ratio
Active
$649,000
4
bds
|
0
ba
|
2,584
sqft
|
built
2003
18854 Lake Ter, Montgomery, TX 77356
$-2,133
Cash flow
-17.1%
Cash-on-Cash Return
2.3%
Cap rate
0.5%
Rent to Value Ratio
Active
$1,050,000
5
bds
|
0
ba
|
3,891
sqft
|
built
2004
11468 Grand Pine Dr, Montgomery, TX 77356
$-3,300
Cash flow
-16.4%
Cash-on-Cash Return
2.5%
Cap rate
0.5%
Rent to Value Ratio
Active
$850,000
3
bds
|
0
ba
|
1,608
sqft
|
built
1990
17551 W Fm 1097 Rd, Montgomery, TX 77356
$-3,351
Cash flow
-20.6%
Cash-on-Cash Return
1.6%
Cap rate
0.3%
Rent to Value Ratio
Active
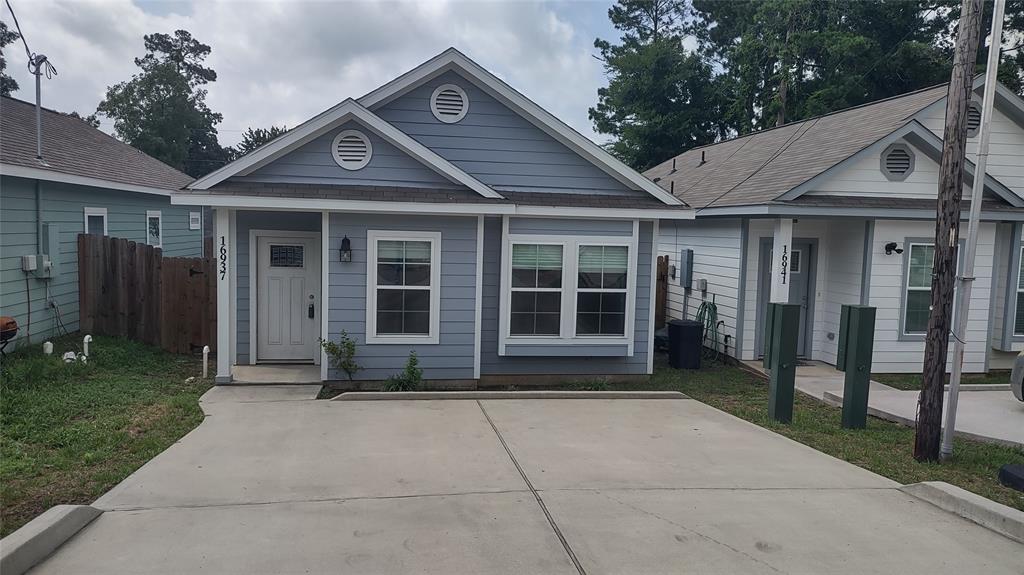
$175,000
3
bds
|
0
ba
|
1,124
sqft
|
built
2021
16937 Glenheath, Montgomery, TX 77316
$-224
Cash flow
-6.7%
Cash-on-Cash Return
4.7%
Cap rate
0.8%
Rent to Value Ratio
Active
$124,000
2
bds
|
0
ba
|
866
sqft
|
built
1982
12900 Walden Rd, Montgomery, TX 77356
$221
Cash flow
9.3%
Cash-on-Cash Return
8.4%
Cap rate
1.1%
Rent to Value Ratio
Active
$374,500
3
bds
|
0
ba
|
2,176
sqft
|
built
2012
216 Capetown, Montgomery, TX 77356
$-121
Cash flow
-1.7%
Cash-on-Cash Return
5.9%
Cap rate
0.7%
Rent to Value Ratio

Active
$123,500
2
bds
|
0
ba
|
964
sqft
|
built
1979
12100 Melville Dr, Montgomery, TX 77356
$-198
Cash flow
-8.4%
Cash-on-Cash Return
4.4%
Cap rate
1.1%
Rent to Value Ratio
Active
$167,500
1
bds
|
0
ba
|
584
sqft
|
built
1974
12600 Melville Dr, Montgomery, TX 77356
$-406
Cash flow
-12.6%
Cash-on-Cash Return
3.4%
Cap rate
0.8%
Rent to Value Ratio
Active
$339,000
3
bds
|
0
ba
|
2,535
sqft
|
built
2020
195 Abner Ln, Montgomery, TX 77356
$-818
Cash flow
-12.6%
Cash-on-Cash Return
3.4%
Cap rate
0.7%
Rent to Value Ratio
Pending
$650,000
3
bds
|
0
ba
|
1,896
sqft
|
built
2022
23495 Henson Rd, Montgomery, TX 77356
$-2,762
Cash flow
-22.2%
Cash-on-Cash Return
1.2%
Cap rate
0.2%
Rent to Value Ratio

Active
$399,900
2
bds
|
0
ba
|
1,620
sqft
|
built
1978
3923 Lakewood Dr, Montgomery, TX 77356
$-1,299
Cash flow
-16.9%
Cash-on-Cash Return
2.4%
Cap rate
0.6%
Rent to Value Ratio
Active
$325,000
2
bds
|
0
ba
|
1,461
sqft
|
built
2008
17040 W Fm 1097 Rd, Montgomery, TX 77356
$-1,049
Cash flow
-16.8%
Cash-on-Cash Return
2.4%
Cap rate
0.7%
Rent to Value Ratio