Montgomery, TX Investment Properties for Sale
Browse homes for sale and investment properties in Montgomery, TX. Refine your search by price, property type, or more.
Best cash flowing properties in Montgomery, TX
Active
$124,000
2
bds
|
0
ba
|
866
sqft
|
built
1982
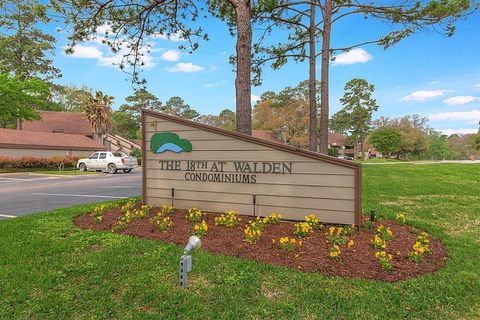
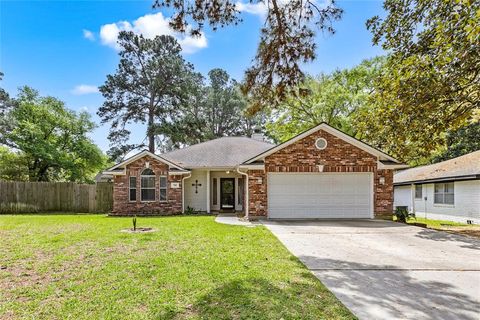
12900 Walden Rd, Montgomery, TX 77356
$283
Cash flow
11.9%
Cash-on-Cash Return
8.4%
Cap rate
1.1%
Rent to Value Ratio

Active
$150,000
2
bds
|
0
ba
|
964
sqft
|
built
1979
12100 Melville Dr, Montgomery, TX 77356
$-94
Cash flow
-3.3%
Cash-on-Cash Return
4.9%
Cap rate
1.1%
Rent to Value Ratio
610 out of 685 properties for sale in Montgomery, TX
Limited Results Shown
Create a free account, or log in to reveal all property listings and enjoy the complete experience.
Active
$439,900
3
bds
|
0
ba
|
1,788
sqft
|
built
2004
17 Regency Pt, Montgomery, TX 77356
$-1,685
Cash flow
-20.0%
Cash-on-Cash Return
1.1%
Cap rate
0.6%
Rent to Value Ratio
Active
$720,000
4
bds
|
0
ba
|
3,761
sqft
|
built
2009
11348 Grand Harbor Blvd, Montgomery, TX 77356
$-1,073
Cash flow
-7.8%
Cash-on-Cash Return
3.9%
Cap rate
0.7%
Rent to Value Ratio

Active
$2,690,000
4
bds
|
0
ba
|
6,418
sqft
|
built
2005
28822 Saddle Oak Dr, Montgomery, TX 77356
$-9,738
Cash flow
-18.9%
Cash-on-Cash Return
1.3%
Cap rate
0.4%
Rent to Value Ratio
Active under contract
$385,000
3
bds
|
0
ba
|
2,429
sqft
|
built
2004
11510 Walden Rd, Montgomery, TX 77356
$-554
Cash flow
-7.5%
Cash-on-Cash Return
4.0%
Cap rate
0.7%
Rent to Value Ratio
Active
$349,900
3
bds
|
0
ba
|
2,238
sqft
|
built
2002
3722 Lovers Ln, Montgomery, TX 77356
$-580
Cash flow
-8.6%
Cash-on-Cash Return
3.7%
Cap rate
0.7%
Rent to Value Ratio

Active
$1,174,900
5
bds
|
0
ba
|
5,226
sqft
|
built
2006
11673 Grandview Dr, Montgomery, TX 77356
$-3,805
Cash flow
-16.9%
Cash-on-Cash Return
1.8%
Cap rate
0.4%
Rent to Value Ratio
Active
$1,999,900
4
bds
|
0
ba
|
5,186
sqft
|
built
1991
457 Edgewood Dr, Montgomery, TX 77356
$-5,486
Cash flow
-14.3%
Cash-on-Cash Return
2.4%
Cap rate
0.5%
Rent to Value Ratio

Active
$2,190,000
7
bds
|
0
ba
|
7,716
sqft
|
built
2008
11503 Renaissance Dr, Montgomery, TX 77356
$-7,673
Cash flow
-18.3%
Cash-on-Cash Return
1.5%
Cap rate
0.3%
Rent to Value Ratio
Active
$249,500
3
bds
|
0
ba
|
1,524
sqft
|
built
2001
234 Fantasy Ln, Montgomery, TX 77356
$-300
Cash flow
-6.3%
Cash-on-Cash Return
4.2%
Cap rate
0.8%
Rent to Value Ratio

Active
$252,500
3
bds
|
0
ba
|
1,874
sqft
|
built
1978
3226 Poe Dr, Montgomery, TX 77356
$-291
Cash flow
-6.0%
Cash-on-Cash Return
4.3%
Cap rate
0.8%
Rent to Value Ratio

Active
$265,000
3
bds
|
0
ba
|
1,707
sqft
|
built
2008
18720 Stewart Hill Dr, Montgomery, TX 77356
$-346
Cash flow
-6.8%
Cash-on-Cash Return
4.1%
Cap rate
0.7%
Rent to Value Ratio

Active
$449,000
4
bds
|
0
ba
|
3,454
sqft
|
built
2007
9926 Crescent Cove Dr, Montgomery, TX 77356
$-796
Cash flow
-9.2%
Cash-on-Cash Return
3.6%
Cap rate
0.7%
Rent to Value Ratio

Active
$495,000
3
bds
|
0
ba
|
2,200
sqft
|
built
1997
32 Laguna Rd, Montgomery, TX 77356
$-975
Cash flow
-10.3%
Cash-on-Cash Return
3.3%
Cap rate
0.6%
Rent to Value Ratio

Active
$499,995
4
bds
|
0
ba
|
2,720
sqft
|
built
2019
236 Bentwood Dr, Montgomery, TX 77356
$-861
Cash flow
-9.0%
Cash-on-Cash Return
3.6%
Cap rate
0.7%
Rent to Value Ratio

Active
$299,000
3
bds
|
0
ba
|
1,719
sqft
|
built
1976
60 April Point Dr N, Montgomery, TX 77356
$-434
Cash flow
-7.6%
Cash-on-Cash Return
3.9%
Cap rate
0.7%
Rent to Value Ratio
Active
$395,000
4
bds
|
0
ba
|
2,464
sqft
|
built
2016
3909 Aspen Dr, Montgomery, TX 77356
$-873
Cash flow
-11.5%
Cash-on-Cash Return
3.0%
Cap rate
0.6%
Rent to Value Ratio

Active
$875,000
4
bds
|
0
ba
|
3,194
sqft
|
built
1998
22 Creekwood Dr, Montgomery, TX 77356
$-2,363
Cash flow
-14.1%
Cash-on-Cash Return
2.4%
Cap rate
0.5%
Rent to Value Ratio
Active
$479,500
3
bds
|
0
ba
|
2,629
sqft
|
built
2012
266 Overland Trce, Montgomery, TX 77316
$-987
Cash flow
-10.7%
Cash-on-Cash Return
3.2%
Cap rate
0.6%
Rent to Value Ratio

Active
$850,000
4
bds
|
0
ba
|
3,674
sqft
|
built
2011
130 Playmoor Pl, Montgomery, TX 77316
$-2,279
Cash flow
-14.0%
Cash-on-Cash Return
2.5%
Cap rate
0.5%
Rent to Value Ratio

Active
$310,000
3
bds
|
0
ba
|
1,540
sqft
|
built
1996
49 Hall Dr N, Montgomery, TX 77316
$-428
Cash flow
-7.2%
Cash-on-Cash Return
4.0%
Cap rate
0.6%
Rent to Value Ratio
Active
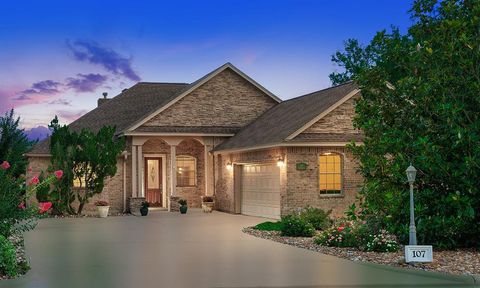
$399,000
3
bds
|
0
ba
|
1,973
sqft
|
built
2006
107 Monterrey Rd, Montgomery, TX 77356
$-969
Cash flow
-12.7%
Cash-on-Cash Return
2.8%
Cap rate
0.6%
Rent to Value Ratio

Active
$299,000
2
bds
|
0
ba
|
969
sqft
|
built
1985
801 River Rd, Montgomery, TX 77356
$-718
Cash flow
-12.5%
Cash-on-Cash Return
2.8%
Cap rate
0.5%
Rent to Value Ratio

Active
$899,000
4
bds
|
0
ba
|
3,000
sqft
|
built
1985
12986 Wood Harbour Dr, Montgomery, TX 77356
$-2,180
Cash flow
-12.7%
Cash-on-Cash Return
2.8%
Cap rate
0.6%
Rent to Value Ratio
Active
$294,900
3
bds
|
0
ba
|
1,907
sqft
|
built
2017
134 Biltmore Loop, Montgomery, TX 77316
$-403
Cash flow
-7.1%
Cash-on-Cash Return
4.0%
Cap rate
0.8%
Rent to Value Ratio
Active
$2,500,000
3
bds
|
0
ba
|
1,584
sqft
|
built
1992
23004 Landrum Village Dr, Montgomery, TX 77316
$-10,502
Cash flow
-21.9%
Cash-on-Cash Return
0.6%
Cap rate
0.1%
Rent to Value Ratio

Active under contract
$600,000
4
bds
|
0
ba
|
3,986
sqft
|
built
2005
103 Leah Dr, Montgomery, TX 77316
$-555
Cash flow
-4.8%
Cash-on-Cash Return
4.6%
Cap rate
0.8%
Rent to Value Ratio
Active
$699,900
4
bds
|
0
ba
|
3,140
sqft
|
built
2000
16 Waterberry Way, Montgomery, TX 77356
$-1,388
Cash flow
-10.3%
Cash-on-Cash Return
3.3%
Cap rate
0.6%
Rent to Value Ratio
Active
$625,000
4
bds
|
0
ba
|
3,299
sqft
|
built
2015
11 Hillsborough Dr E, Montgomery, TX 77356
$-1,566
Cash flow
-13.1%
Cash-on-Cash Return
2.7%
Cap rate
0.5%
Rent to Value Ratio
Active
$550,000
4
bds
|
0
ba
|
2,197
sqft
|
built
2009
649 Old Plantersville Rd, Montgomery, TX 77316
$-1,209
Cash flow
-11.5%
Cash-on-Cash Return
3.0%
Cap rate
0.6%
Rent to Value Ratio
Active
$150,000
2
bds
|
0
ba
|
964
sqft
|
built
1979
12100 Melville Dr, Montgomery, TX 77356
$-94
Cash flow
-3.3%
Cash-on-Cash Return
4.9%
Cap rate
1.1%
Rent to Value Ratio
Active
$516,000
4
bds
|
0
ba
|
2,813
sqft
|
built
2014
120 Brooke Addison Ct, Montgomery, TX 77316
$-1,141
Cash flow
-11.5%
Cash-on-Cash Return
3.0%
Cap rate
0.6%
Rent to Value Ratio
Active
$260,000
3
bds
|
0
ba
|
1,638
sqft
|
built
2000
110 Rustling Wind Dr, Montgomery, TX 77356
$-433
Cash flow
-8.7%
Cash-on-Cash Return
3.7%
Cap rate
0.8%
Rent to Value Ratio
Active
$275,000
4
bds
|
0
ba
|
1,829
sqft
|
built
2022
907 Crystal River Rd, Montgomery, TX 77316
$-378
Cash flow
-7.2%
Cash-on-Cash Return
4.0%
Cap rate
0.7%
Rent to Value Ratio
Active
$450,000
2
bds
|
0
ba
|
1,200
sqft
|
built
1991
7711 Boars Head Pl, Montgomery, TX 77316
$-1,277
Cash flow
-14.8%
Cash-on-Cash Return
2.3%
Cap rate
0.3%
Rent to Value Ratio

Active
$139,900
2
bds
|
0
ba
|
698
sqft
|
built
1979
13151 Walden Rd, Montgomery, TX 77356
$-492
Cash flow
-18.3%
Cash-on-Cash Return
1.5%
Cap rate
0.9%
Rent to Value Ratio
Active
$124,000
2
bds
|
0
ba
|
866
sqft
|
built
1982
12900 Walden Rd, Montgomery, TX 77356
$283
Cash flow
11.9%
Cash-on-Cash Return
8.4%
Cap rate
1.1%
Rent to Value Ratio

Active
$123,500
2
bds
|
0
ba
|
964
sqft
|
built
1979
12100 Melville Dr, Montgomery, TX 77356
$-135
Cash flow
-5.7%
Cash-on-Cash Return
4.4%
Cap rate
1.1%
Rent to Value Ratio
Active
$167,500
1
bds
|
0
ba
|
584
sqft
|
built
1974
12600 Melville Dr, Montgomery, TX 77356
$-322
Cash flow
-10.0%
Cash-on-Cash Return
3.4%
Cap rate
0.8%
Rent to Value Ratio
Active
$339,000
3
bds
|
0
ba
|
2,535
sqft
|
built
2020
195 Abner Ln, Montgomery, TX 77356
$-647
Cash flow
-10.0%
Cash-on-Cash Return
3.4%
Cap rate
0.7%
Rent to Value Ratio

Pending
$650,000
3
bds
|
0
ba
|
1,896
sqft
|
built
2022
23495 Henson Rd, Montgomery, TX 77356
$-2,434
Cash flow
-19.5%
Cash-on-Cash Return
1.2%
Cap rate
0.2%
Rent to Value Ratio