Montgomery, TX Investment Properties for Sale
Browse homes for sale and investment properties in Montgomery, TX. Refine your search by price, property type, or more.
Best cash flowing properties in Montgomery, TX
Active
$229,500
2
bds
|
0
ba
|
1,146
sqft
|
built
2018
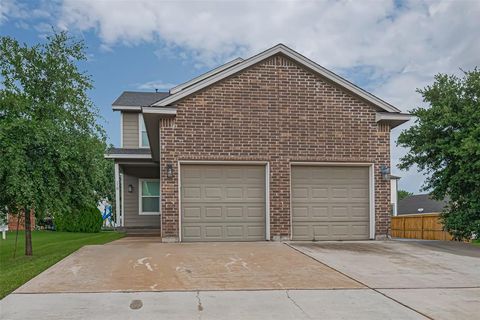
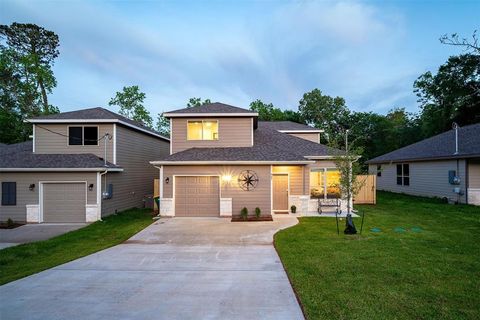
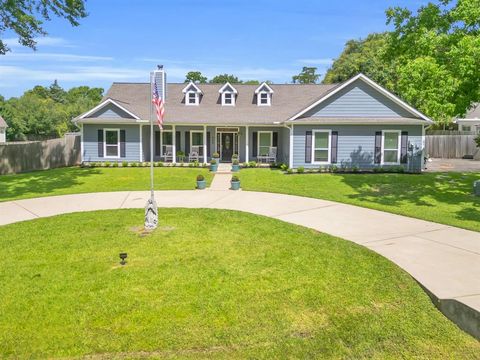
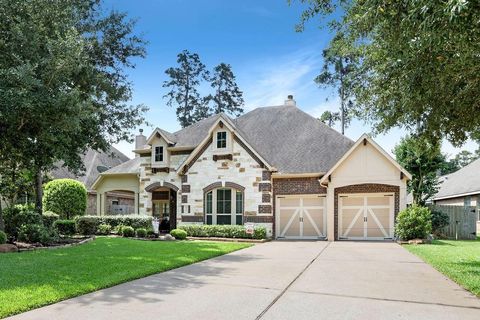
278 Capetown, Montgomery, TX 77356
$-21
Cash flow
-0.5%
Cash-on-Cash Return
6.2%
Cap rate
1.0%
Rent to Value Ratio
Active
$220,000
3
bds
|
0
ba
|
1,450
sqft
|
built
1970
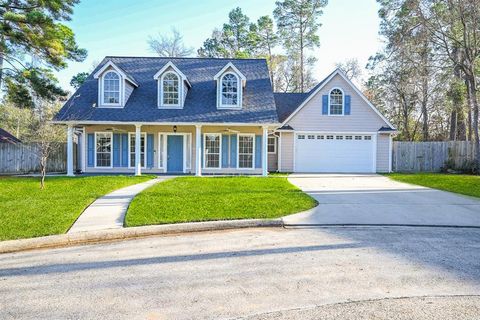
408 Commanche Rd, Montgomery, TX 77316
$-183
Cash flow
-4.3%
Cash-on-Cash Return
5.3%
Cap rate
0.6%
Rent to Value Ratio
590 out of 735 properties for sale in Montgomery, TX
Limited Results Shown
Create a free account, or log in to reveal all property listings and enjoy the complete experience.

Active
$699,900
4
bds
|
0
ba
|
3,408
sqft
|
built
2004
34 Eastwood Dr, Montgomery, TX 77356
$-1,861
Cash flow
-13.9%
Cash-on-Cash Return
3.1%
Cap rate
0.6%
Rent to Value Ratio

Active
$899,000
4
bds
|
0
ba
|
3,000
sqft
|
built
1985
12986 Wood Harbour Dr, Montgomery, TX 77356
$-2,619
Cash flow
-15.2%
Cash-on-Cash Return
2.8%
Cap rate
0.6%
Rent to Value Ratio

Active
$1,150,000
3
bds
|
0
ba
|
2,571
sqft
|
built
2002
25350 Taylor St, Montgomery, TX 77356
$-5,345
Cash flow
-24.2%
Cash-on-Cash Return
0.7%
Cap rate
0.2%
Rent to Value Ratio

Active
$1,174,900
5
bds
|
0
ba
|
5,226
sqft
|
built
2006
11673 Grandview Dr, Montgomery, TX 77356
$-4,379
Cash flow
-19.4%
Cash-on-Cash Return
1.8%
Cap rate
0.4%
Rent to Value Ratio

Active
$875,000
4
bds
|
0
ba
|
3,194
sqft
|
built
1998
22 Creekwood Dr, Montgomery, TX 77356
$-2,790
Cash flow
-16.6%
Cash-on-Cash Return
2.4%
Cap rate
0.5%
Rent to Value Ratio

Active
$849,000
3
bds
|
0
ba
|
2,516
sqft
|
built
2009
140 Port Au Prince Ct, Montgomery, TX 77316
$-2,834
Cash flow
-17.4%
Cash-on-Cash Return
2.3%
Cap rate
0.4%
Rent to Value Ratio

Active
$499,995
4
bds
|
0
ba
|
2,720
sqft
|
built
2019
236 Bentwood Dr, Montgomery, TX 77356
$-1,105
Cash flow
-11.5%
Cash-on-Cash Return
3.6%
Cap rate
0.7%
Rent to Value Ratio

Active
$950,000
4
bds
|
0
ba
|
3,566
sqft
|
built
2010
8483 Majestic Lake Ct, Montgomery, TX 77316
$-2,998
Cash flow
-16.5%
Cash-on-Cash Return
2.5%
Cap rate
0.5%
Rent to Value Ratio

Active
$299,000
2
bds
|
0
ba
|
969
sqft
|
built
1985
801 River Rd, Montgomery, TX 77356
$-864
Cash flow
-15.1%
Cash-on-Cash Return
2.8%
Cap rate
0.5%
Rent to Value Ratio

Active
$949,500
4
bds
|
0
ba
|
4,320
sqft
|
built
1996
118 Waterfront Dr, Montgomery, TX 77356
$-2,416
Cash flow
-13.3%
Cash-on-Cash Return
3.2%
Cap rate
0.6%
Rent to Value Ratio

Active
$744,500
4
bds
|
0
ba
|
3,006
sqft
|
built
2005
18989 Harbor Side Blvd, Montgomery, TX 77356
$-2,352
Cash flow
-16.5%
Cash-on-Cash Return
2.5%
Cap rate
0.5%
Rent to Value Ratio

Active
$1,130,000
5
bds
|
0
ba
|
4,836
sqft
|
built
2006
11427 Grand Pine Dr, Montgomery, TX 77356
$-2,790
Cash flow
-12.9%
Cash-on-Cash Return
3.3%
Cap rate
0.6%
Rent to Value Ratio

Active
$2,690,000
4
bds
|
0
ba
|
6,418
sqft
|
built
2005
28822 Saddle Oak Dr, Montgomery, TX 77356
$-11,052
Cash flow
-21.4%
Cash-on-Cash Return
1.3%
Cap rate
0.4%
Rent to Value Ratio
Active
$516,000
4
bds
|
0
ba
|
2,813
sqft
|
built
2014
120 Brooke Addison Ct, Montgomery, TX 77316
$-1,393
Cash flow
-14.1%
Cash-on-Cash Return
3.0%
Cap rate
0.6%
Rent to Value Ratio

Active
$1,095,000
5
bds
|
0
ba
|
4,183
sqft
|
built
2006
11432 Grand Pine Dr, Montgomery, TX 77356
$-2,455
Cash flow
-11.7%
Cash-on-Cash Return
3.6%
Cap rate
0.6%
Rent to Value Ratio

Active
$1,350,000
3
bds
|
0
ba
|
3,368
sqft
|
built
2017
8794 Grand Lake Estates Dr, Montgomery, TX 77316
$-3,475
Cash flow
-13.4%
Cash-on-Cash Return
3.2%
Cap rate
0.5%
Rent to Value Ratio

Active
$385,000
3
bds
|
0
ba
|
1,737
sqft
|
built
2023
296 N Cascade Heights Dr, Montgomery, TX 77316
$-1,081
Cash flow
-14.6%
Cash-on-Cash Return
2.9%
Cap rate
0.6%
Rent to Value Ratio
Active
$339,900
3
bds
|
0
ba
|
2,105
sqft
|
built
2022
938 Youth Water Rd, Montgomery, TX 77316
$-913
Cash flow
-14.0%
Cash-on-Cash Return
3.0%
Cap rate
0.8%
Rent to Value Ratio
Active
$275,000
4
bds
|
0
ba
|
1,829
sqft
|
built
2022
907 Crystal River Rd, Montgomery, TX 77316
$-513
Cash flow
-9.7%
Cash-on-Cash Return
4.0%
Cap rate
0.7%
Rent to Value Ratio

Active
$325,000
4
bds
|
0
ba
|
1,880
sqft
|
built
2022
1672 Happy Valley St, Montgomery, TX 77316
$-799
Cash flow
-12.8%
Cash-on-Cash Return
3.3%
Cap rate
0.8%
Rent to Value Ratio
Active
$249,500
3
bds
|
0
ba
|
1,524
sqft
|
built
2001
234 Fantasy Ln, Montgomery, TX 77356
$-422
Cash flow
-8.8%
Cash-on-Cash Return
4.2%
Cap rate
0.8%
Rent to Value Ratio
Active
$220,000
3
bds
|
0
ba
|
1,450
sqft
|
built
1970
408 Commanche Rd, Montgomery, TX 77316
$-183
Cash flow
-4.3%
Cash-on-Cash Return
5.3%
Cap rate
0.6%
Rent to Value Ratio

Active
$850,000
4
bds
|
0
ba
|
3,674
sqft
|
built
2011
130 Playmoor Pl, Montgomery, TX 77316
$-2,695
Cash flow
-16.5%
Cash-on-Cash Return
2.5%
Cap rate
0.5%
Rent to Value Ratio
Active
$699,900
4
bds
|
0
ba
|
3,140
sqft
|
built
2000
16 Waterberry Way, Montgomery, TX 77356
$-1,730
Cash flow
-12.9%
Cash-on-Cash Return
3.3%
Cap rate
0.6%
Rent to Value Ratio
Active
$439,900
3
bds
|
0
ba
|
1,788
sqft
|
built
2004
17 Regency Pt, Montgomery, TX 77356
$-1,900
Cash flow
-22.5%
Cash-on-Cash Return
1.1%
Cap rate
0.6%
Rent to Value Ratio

Active
$478,900
4
bds
|
0
ba
|
2,949
sqft
|
built
2007
36 Fairfield Dr, Montgomery, TX 77356
$-1,044
Cash flow
-11.4%
Cash-on-Cash Return
3.6%
Cap rate
0.7%
Rent to Value Ratio

Active
$1,450,000
4
bds
|
0
ba
|
4,038
sqft
|
built
1991
61 Sarasota Cir N, Montgomery, TX 77356
$-5,934
Cash flow
-21.4%
Cash-on-Cash Return
1.4%
Cap rate
0.3%
Rent to Value Ratio
Active
$550,000
4
bds
|
0
ba
|
2,197
sqft
|
built
2009
649 Old Plantersville Rd, Montgomery, TX 77316
$-1,477
Cash flow
-14.0%
Cash-on-Cash Return
3.0%
Cap rate
0.6%
Rent to Value Ratio
Active
$359,900
4
bds
|
0
ba
|
2,419
sqft
|
built
2001
3206 Meadowlark Ln, Montgomery, TX 77356
$-697
Cash flow
-10.1%
Cash-on-Cash Return
3.9%
Cap rate
0.7%
Rent to Value Ratio

Active
$4,200,000
6
bds
|
0
ba
|
4,948
sqft
|
built
2006
2289 Old Dobbin Rd, Montgomery, TX 77316
$-16,682
Cash flow
-20.7%
Cash-on-Cash Return
1.5%
Cap rate
0.2%
Rent to Value Ratio
Active
$2,500,000
3
bds
|
0
ba
|
1,584
sqft
|
built
1992
23004 Landrum Village Dr, Montgomery, TX 77316
$-11,723
Cash flow
-24.5%
Cash-on-Cash Return
0.6%
Cap rate
0.1%
Rent to Value Ratio
Active
$260,000
3
bds
|
0
ba
|
1,638
sqft
|
built
2000
110 Rustling Wind Dr, Montgomery, TX 77356
$-560
Cash flow
-11.2%
Cash-on-Cash Return
3.7%
Cap rate
0.8%
Rent to Value Ratio
Active
$479,500
3
bds
|
0
ba
|
2,629
sqft
|
built
2012
266 Overland Trce, Montgomery, TX 77316
$-1,221
Cash flow
-13.3%
Cash-on-Cash Return
3.2%
Cap rate
0.6%
Rent to Value Ratio
Active
$245,000
3
bds
|
0
ba
|
1,370
sqft
|
built
1976
17 April Point Dr N, Montgomery, TX 77356
$-531
Cash flow
-11.3%
Cash-on-Cash Return
3.7%
Cap rate
0.7%
Rent to Value Ratio

Active
$1,294,000
5
bds
|
0
ba
|
4,410
sqft
|
built
2004
15471 Castlebrook Ct, Montgomery, TX 77316
$-3,636
Cash flow
-14.7%
Cash-on-Cash Return
2.9%
Cap rate
0.6%
Rent to Value Ratio
Active
$395,000
4
bds
|
0
ba
|
2,464
sqft
|
built
2016
3909 Aspen Dr, Montgomery, TX 77356
$-1,066
Cash flow
-14.1%
Cash-on-Cash Return
3.0%
Cap rate
0.6%
Rent to Value Ratio
Active
$319,000
3
bds
|
0
ba
|
2,009
sqft
|
built
2021
1308 Mainland Shores Ln, Montgomery, TX 77316
$-834
Cash flow
-13.6%
Cash-on-Cash Return
3.1%
Cap rate
0.8%
Rent to Value Ratio
Active
$569,000
3
bds
|
0
ba
|
2,618
sqft
|
built
2022
41 Monterrey Ct, Montgomery, TX 77356
$-1,382
Cash flow
-12.7%
Cash-on-Cash Return
3.4%
Cap rate
0.6%
Rent to Value Ratio
Active
$229,500
2
bds
|
0
ba
|
1,146
sqft
|
built
2018
278 Capetown, Montgomery, TX 77356
$-21
Cash flow
-0.5%
Cash-on-Cash Return
6.2%
Cap rate
1.0%
Rent to Value Ratio

Active
$1,750,000
4
bds
|
0
ba
|
2,335
sqft
|
built
2017
26150 Bluejack National Blvd, Montgomery, TX 77316
$-9,167
Cash flow
-27.3%
Cash-on-Cash Return
0.0%
Cap rate
0.3%
Rent to Value Ratio