Holmes County Investment Properties for Sale
Browse homes for sale and investment properties in Holmes County. Refine your search by price, property type, or more.
Best cash flowing properties in Holmes County
Active
$128,000
3
bds
|
2
ba
|
0
sqft
|
built
1970
626 N Lexington St, Durant, MS 39063
$280
Cash flow
11.4%
Cash-on-Cash Return
8.3%
Cap rate
1.3%
Rent to Value Ratio

Active
$245,000
4
bds
|
2
ba
|
0
sqft
|
built
1998
869 B Parks Rd, Pickens, MS 39146
$221
Cash flow
4.7%
Cash-on-Cash Return
6.8%
Cap rate
0.8%
Rent to Value Ratio
9 out of 13 properties for sale in Holmes County
Limited Results Shown
Create a free account, or log in to reveal all property listings and enjoy the complete experience.
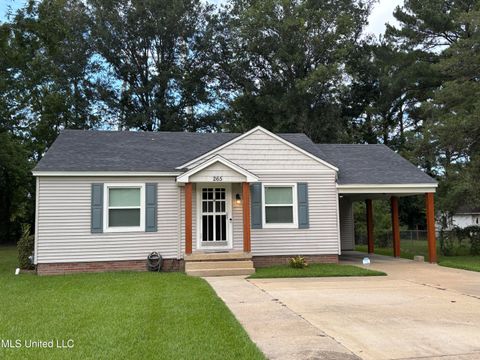
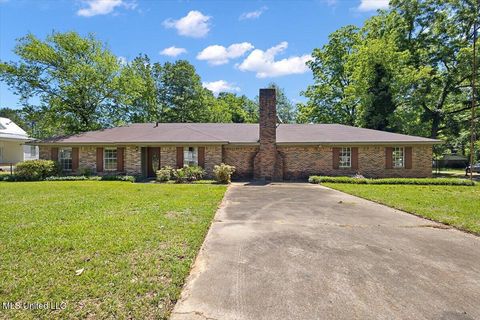
Active
$145,000
3
bds
|
2
ba
|
0
sqft
|
built
1950
265 Lamar St, Durant, MS 39063
$47
Cash flow
1.7%
Cash-on-Cash Return
6.1%
Cap rate
0.8%
Rent to Value Ratio

Active
$460,000
3
bds
|
1
ba
|
0
sqft
|
built
1955
3295 Sand Hill Rd, Lexington, MS 39095
$-291
Cash flow
-3.3%
Cash-on-Cash Return
4.9%
Cap rate
0.6%
Rent to Value Ratio

Active
$798,500
5
bds
|
5
ba
|
0
sqft
|
built
1880
315 North St, Lexington, MS 39095
$-1,754
Cash flow
-11.5%
Cash-on-Cash Return
3.0%
Cap rate
0.5%
Rent to Value Ratio

Active
$330,000
4
bds
|
3
ba
|
0
sqft
|
built
1986
24929 Highway 12, Lexington, MS 39095
$-207
Cash flow
-3.3%
Cash-on-Cash Return
4.9%
Cap rate
0.7%
Rent to Value Ratio
Active
$240,000
4
bds
|
4
ba
|
0
sqft
|
built
1975
187 N Lexington St, Durant, MS 39063
$143
Cash flow
3.1%
Cash-on-Cash Return
6.4%
Cap rate
1.0%
Rent to Value Ratio

Active
$700,000
5
bds
|
2
ba
|
0
sqft
|
built
2006
106 Crockrell Rd, Lexington, MS 39095
$-1,453
Cash flow
-10.8%
Cash-on-Cash Return
3.2%
Cap rate
0.4%
Rent to Value Ratio

Active
$469,000
4
bds
|
2
ba
|
0
sqft
|
built
1920
9767 Rosebank Mt Olive Rd, Lexington, MS 39095
$-420
Cash flow
-4.7%
Cash-on-Cash Return
4.6%
Cap rate
0.6%
Rent to Value Ratio