Hinds County Investment Properties for Sale
Browse homes for sale and investment properties in Hinds County. Refine your search by price, property type, or more.
Best cash flowing properties in Hinds County
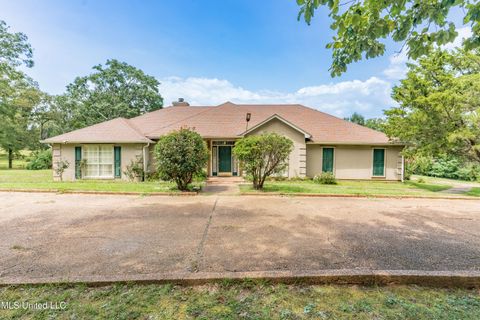
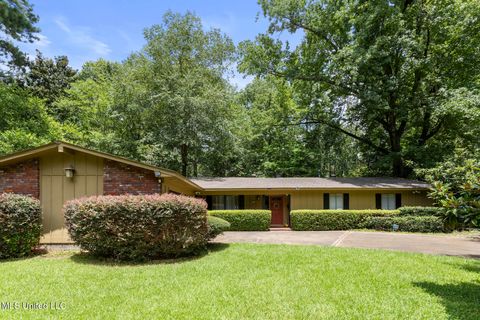
Active
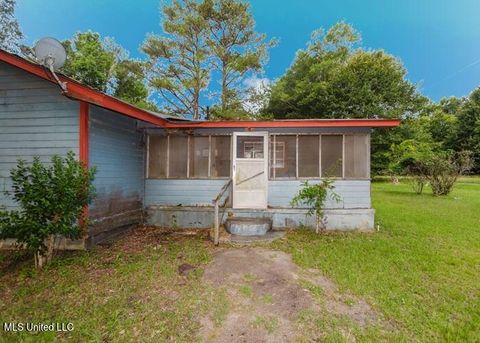
$10,600
3
bds
|
2
ba
|
0
sqft
|
built
1967
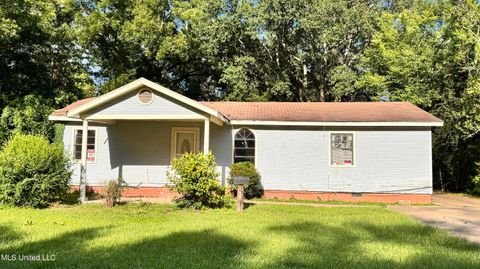
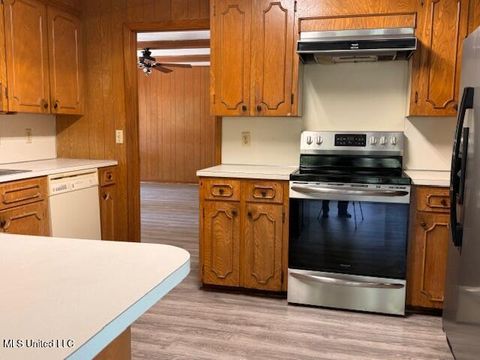
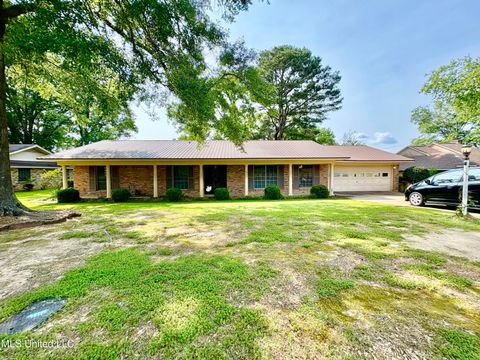
1157 Bunyard Rd, Clinton, MS 39056
$1,072
Cash flow
117.8%
Cash-on-Cash Return
121.4%
Cap rate
15.1%
Rent to Value Ratio
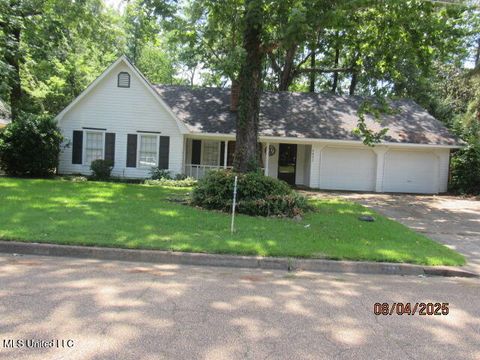
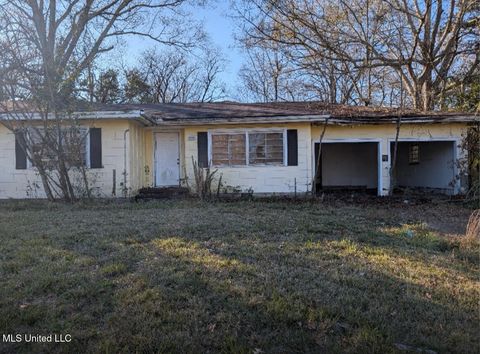
Active
$54,900
3
bds
|
2
ba
|
0
sqft
|
built
1959
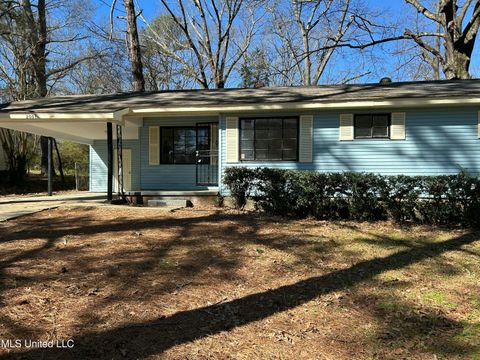
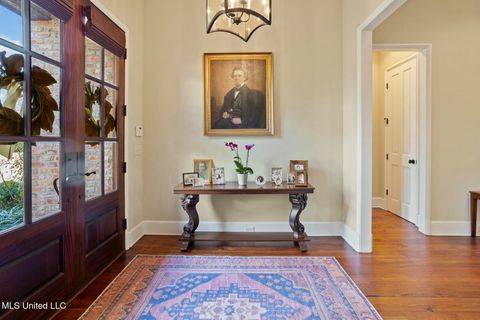
151 Queen Joanna Ln, Jackson, MS 39209
$874
Cash flow
18.5%
Cash-on-Cash Return
19.1%
Cap rate
2.6%
Rent to Value Ratio
372 out of 648 properties for sale in Hinds County
Limited Results Shown
Create a free account, or log in to reveal all property listings and enjoy the complete experience.

Active
$184,900
2
bds
|
2
ba
|
0
sqft
|
built
1955
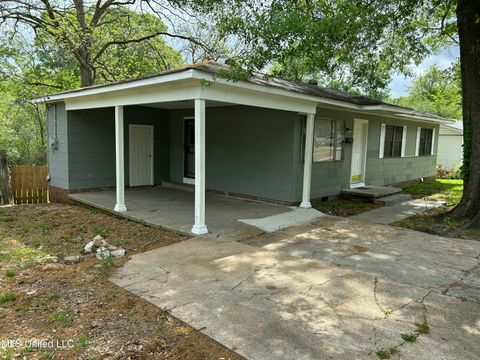
213 Mount Salus Rd, Clinton, MS 39056
$268
Cash flow
7.6%
Cash-on-Cash Return
7.4%
Cap rate
1.0%
Rent to Value Ratio

Active
$92,000
3
bds
|
2
ba
|
0
sqft
|
built
1971
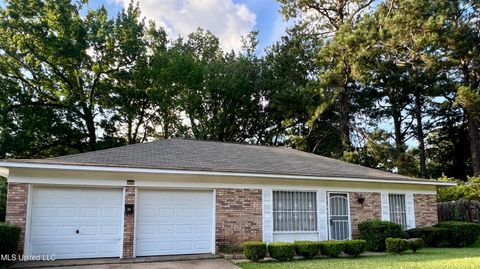
4668 Norway Dr, Jackson, MS 39206
$629
Cash flow
35.7%
Cash-on-Cash Return
13.9%
Cap rate
2.0%
Rent to Value Ratio
Active
$56,000
3
bds
|
2
ba
|
0
sqft
|
built
1973
613 Upper Darby Rd, Jackson, MS 39212
$811
Cash flow
16.9%
Cash-on-Cash Return
17.4%
Cap rate
2.5%
Rent to Value Ratio

Active
$235,900
3
bds
|
2
ba
|
0
sqft
|
built
1999
4954 Brookwood Pl, Jackson, MS 39272
$311
Cash flow
6.9%
Cash-on-Cash Return
7.3%
Cap rate
1.0%
Rent to Value Ratio

Active
$139,000
3
bds
|
2
ba
|
0
sqft
|
built
1970
4832 Woodmont Dr, Jackson, MS 39206
$364
Cash flow
13.7%
Cash-on-Cash Return
8.8%
Cap rate
1.2%
Rent to Value Ratio
Active
$228,000
3
bds
|
3
ba
|
0
sqft
|
built
1973
5967 Huntview Dr, Jackson, MS 39206
$395
Cash flow
9.0%
Cash-on-Cash Return
7.8%
Cap rate
1.0%
Rent to Value Ratio
Active
$225,000
4
bds
|
2
ba
|
0
sqft
|
built
1977
1505 Rosemont Dr, Clinton, MS 39056
$-314
Cash flow
-7.3%
Cash-on-Cash Return
4.0%
Cap rate
0.6%
Rent to Value Ratio

Active
$284,000
3
bds
|
4
ba
|
0
sqft
|
built
1980
1618 Pear Orchard Pl, Jackson, MS 39211
$-199
Cash flow
-3.7%
Cash-on-Cash Return
4.8%
Cap rate
0.9%
Rent to Value Ratio

Active
$189,900
4
bds
|
2
ba
|
0
sqft
|
built
1958
1645 Meadowbrook Rd, Jackson, MS 39211
$229
Cash flow
6.3%
Cash-on-Cash Return
7.1%
Cap rate
1.1%
Rent to Value Ratio

Active
$165,000
4
bds
|
2
ba
|
0
sqft
|
built
1967
5730 Sedgwick Dr, Jackson, MS 39211
$240
Cash flow
7.6%
Cash-on-Cash Return
7.4%
Cap rate
1.1%
Rent to Value Ratio

Active
$381,500
4
bds
|
3
ba
|
0
sqft
|
built
2003
2033 Elizabeth Chapman Dr, Jackson, MS 39212
$92
Cash flow
1.3%
Cash-on-Cash Return
6.0%
Cap rate
0.8%
Rent to Value Ratio
Active
$85,000
3
bds
|
1
ba
|
0
sqft
|
built
1956
4570 Ritchey Dr, Jackson, MS 39209
$429
Cash flow
26.3%
Cash-on-Cash Return
11.7%
Cap rate
1.5%
Rent to Value Ratio

Active
$139,900
2
bds
|
1
ba
|
0
sqft
|
built
1979
21 Park Crest Pl, Jackson, MS 39211
$-153
Cash flow
-5.7%
Cash-on-Cash Return
4.4%
Cap rate
1.0%
Rent to Value Ratio
Active
$285,000
3
bds
|
2
ba
|
0
sqft
|
built
1971
5846 Clubview Dr, Jackson, MS 39211
$-141
Cash flow
-2.6%
Cash-on-Cash Return
5.1%
Cap rate
0.6%
Rent to Value Ratio

Active
$95,000
3
bds
|
2
ba
|
0
sqft
|
built
1972
1002 Monroe St, Jackson, MS 39202
$-4
Cash flow
-0.2%
Cash-on-Cash Return
5.6%
Cap rate
1.2%
Rent to Value Ratio
Active
$160,000
4
bds
|
3
ba
|
0
sqft
|
built
1967
865 Fairfax Cir, Jackson, MS 39211
$210
Cash flow
6.8%
Cash-on-Cash Return
7.3%
Cap rate
1.1%
Rent to Value Ratio
Active
$49,800
3
bds
|
2
ba
|
0
sqft
|
built
1950
3158 Monticello Dr, Jackson, MS 39212
$668
Cash flow
15.6%
Cash-on-Cash Return
16.1%
Cap rate
2.2%
Rent to Value Ratio
Active
$65,000
3
bds
|
1
ba
|
0
sqft
|
built
1955
2001 Paden St, Jackson, MS 39204
$537
Cash flow
9.6%
Cash-on-Cash Return
9.9%
Cap rate
1.4%
Rent to Value Ratio
Active
$65,000
3
bds
|
1
ba
|
0
sqft
|
built
1959
1110 Barbara Ann Dr, Jackson, MS 39204
$602
Cash flow
10.8%
Cash-on-Cash Return
11.1%
Cap rate
1.5%
Rent to Value Ratio

Active
$170,000
3
bds
|
3
ba
|
0
sqft
|
built
1960
5726 Fernwood Dr, Jackson, MS 39206
$505
Cash flow
15.5%
Cash-on-Cash Return
9.2%
Cap rate
1.3%
Rent to Value Ratio
Active
$124,900
3
bds
|
2
ba
|
0
sqft
|
built
1967
1320 Dorgan St, Jackson, MS 39204
$179
Cash flow
7.5%
Cash-on-Cash Return
7.4%
Cap rate
1.0%
Rent to Value Ratio
Active
$140,000
3
bds
|
2
ba
|
0
sqft
|
built
1967
1119 Primrose St, Jackson, MS 39212
$343
Cash flow
12.8%
Cash-on-Cash Return
8.6%
Cap rate
1.1%
Rent to Value Ratio
Active
$199,500
4
bds
|
2
ba
|
0
sqft
|
built
1967
145 Swan Lake Dr, Jackson, MS 39212
$-138
Cash flow
-3.6%
Cash-on-Cash Return
4.8%
Cap rate
0.8%
Rent to Value Ratio
Active
$799,000
4
bds
|
4
ba
|
0
sqft
|
built
2010
5 Pecan Tree Pl, Jackson, MS 39211
$-1,409
Cash flow
-9.2%
Cash-on-Cash Return
3.6%
Cap rate
0.6%
Rent to Value Ratio
Active
$148,000
3
bds
|
2
ba
|
0
sqft
|
built
1973
138 William Mc Kinley Cir, Jackson, MS 39213
$-54
Cash flow
-1.9%
Cash-on-Cash Return
5.2%
Cap rate
0.7%
Rent to Value Ratio
Active
$499,900
6
bds
|
7
ba
|
0
sqft
|
built
1993
100 Green Oak Cv, Clinton, MS 39056
$-1,028
Cash flow
-10.7%
Cash-on-Cash Return
3.2%
Cap rate
0.4%
Rent to Value Ratio

Active
$239,000
4
bds
|
3
ba
|
0
sqft
|
built
1971
603 Herndon Hl, Clinton, MS 39056
$259
Cash flow
5.7%
Cash-on-Cash Return
7.0%
Cap rate
1.0%
Rent to Value Ratio

Active
$35,000
3
bds
|
1
ba
|
0
sqft
|
built
1960
1557 Maria Dr, Jackson, MS 39204
$672
Cash flow
22.4%
Cash-on-Cash Return
23.0%
Cap rate
3.1%
Rent to Value Ratio
Active
$255,500
3
bds
|
2
ba
|
0
sqft
|
built
1977
1431 Tracewood Dr, Jackson, MS 39211
$115
Cash flow
2.3%
Cash-on-Cash Return
6.2%
Cap rate
0.9%
Rent to Value Ratio

Active
$349,900
4
bds
|
3
ba
|
0
sqft
|
built
2006
114 Rockbridge Xing, Clinton, MS 39056
$76
Cash flow
1.1%
Cash-on-Cash Return
5.9%
Cap rate
0.8%
Rent to Value Ratio
Active
$165,000
3
bds
|
2
ba
|
0
sqft
|
built
1942
1054 Madison St, Jackson, MS 39202
$309
Cash flow
9.8%
Cash-on-Cash Return
7.9%
Cap rate
1.1%
Rent to Value Ratio
Active
$50,000
3
bds
|
1
ba
|
0
sqft
|
built
1952
624 W Hillsdale Dr, Jackson, MS 39209
$724
Cash flow
16.9%
Cash-on-Cash Return
17.4%
Cap rate
2.2%
Rent to Value Ratio

Active
$160,000
3
bds
|
2
ba
|
0
sqft
|
built
1960
3246 Longwood Dr, Jackson, MS 39212
$144
Cash flow
4.7%
Cash-on-Cash Return
6.8%
Cap rate
0.9%
Rent to Value Ratio
Active
$199,000
3
bds
|
2
ba
|
0
sqft
|
built
1967
5120 Reddoch Dr, Jackson, MS 39211
$65
Cash flow
1.7%
Cash-on-Cash Return
6.1%
Cap rate
0.9%
Rent to Value Ratio
Active
$15,000
3
bds
|
2
ba
|
0
sqft
|
built
1950
949 Terrace Ave, Jackson, MS 39209
$828
Cash flow
64.3%
Cash-on-Cash Return
66.2%
Cap rate
9.3%
Rent to Value Ratio
Active
$155,000
3
bds
|
2
ba
|
0
sqft
|
built
1972
3432 Dundee Ln, Jackson, MS 39212
$405
Cash flow
13.6%
Cash-on-Cash Return
8.8%
Cap rate
1.1%
Rent to Value Ratio
Active
$265,000
4
bds
|
2
ba
|
0
sqft
|
built
1942
4304 Council Cir, Jackson, MS 39206
$90
Cash flow
1.8%
Cash-on-Cash Return
6.1%
Cap rate
0.8%
Rent to Value Ratio

Active
$495,000
4
bds
|
3
ba
|
0
sqft
|
built
2000
140 Oak View Dr, Terry, MS 39170
$-439
Cash flow
-4.6%
Cash-on-Cash Return
4.6%
Cap rate
0.6%
Rent to Value Ratio