Muncie, IN Investment Properties for Sale
Browse homes for sale and investment properties in Muncie, IN. Refine your search by price, property type, or more.
Best cash flowing properties in Muncie, IN

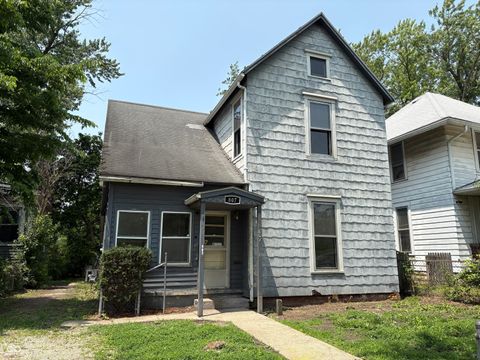
Active
$69,000
3
bds
|
1
ba
|
1,204
sqft
|
built
1892
818 S Grant St, Muncie, IN 47302
$897
Cash flow
15.1%
Cash-on-Cash Return
15.6%
Cap rate
1.9%
Rent to Value Ratio
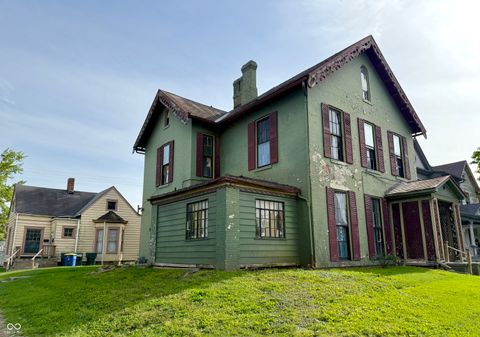
Active
$35,000
3
bds
|
1
ba
|
1,464
sqft
|
built
1898
1325 N Gavin St, Muncie, IN 47303
$828
Cash flow
27.6%
Cash-on-Cash Return
28.4%
Cap rate
3.4%
Rent to Value Ratio
58 out of 63 properties for sale in Muncie, IN
Limited Results Shown
Create a free account, or log in to reveal all property listings and enjoy the complete experience.

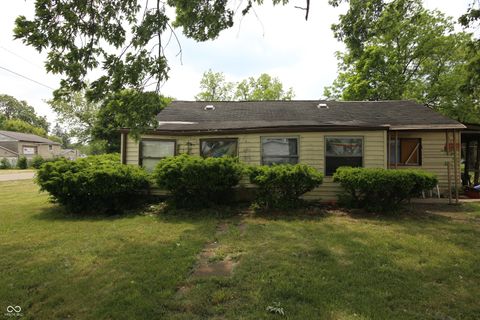
Active
$100,000
2
bds
|
1
ba
|
1,440
sqft
|
built
1948
1619 E 20th St, Muncie, IN 47302
$237
Cash flow
12.4%
Cash-on-Cash Return
9.1%
Cap rate
1.1%
Rent to Value Ratio
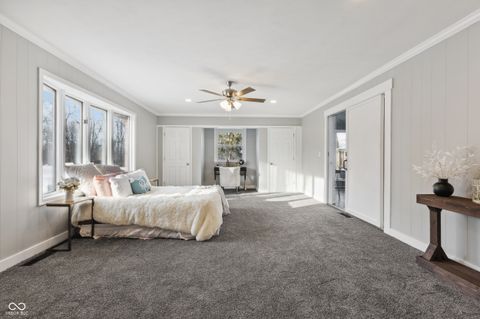
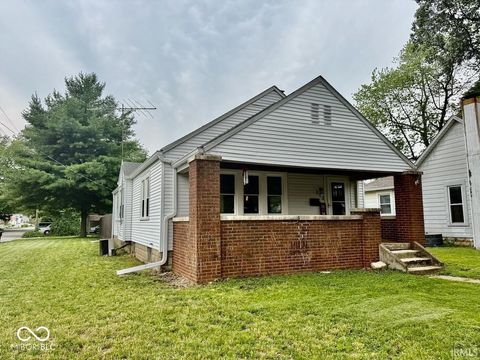
Active
$78,900
4
bds
|
1
ba
|
1,584
sqft
|
built
1895
807 N Elm St, Muncie, IN 47305
$485
Cash flow
32.1%
Cash-on-Cash Return
13.6%
Cap rate
1.6%
Rent to Value Ratio

Active
$150,000
4
bds
|
3
ba
|
3,220
sqft
|
built
1896
1225 S Monroe St, Muncie, IN 47302
$252
Cash flow
8.8%
Cash-on-Cash Return
8.3%
Cap rate
1.0%
Rent to Value Ratio
Active
$110,000
2
bds
|
0
ba
|
0
sqft
|
built
1880
621 E Main St, Muncie, IN 47305
$185
Cash flow
8.8%
Cash-on-Cash Return
8.3%
Cap rate
1.0%
Rent to Value Ratio
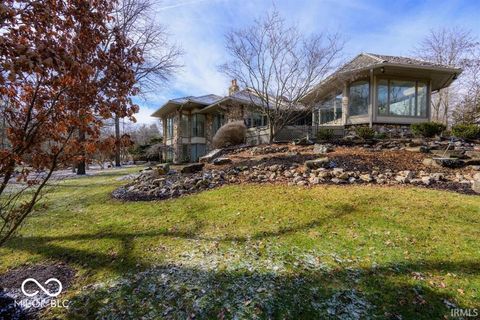
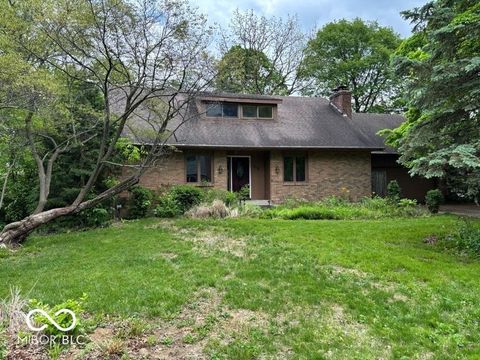
Active
$499,900
6
bds
|
4
ba
|
4,538
sqft
|
built
1969
8810 W Tulip Tree Dr, Muncie, IN 47304
$81
Cash flow
0.8%
Cash-on-Cash Return
6.5%
Cap rate
0.8%
Rent to Value Ratio
Active
$1,180,000
5
bds
|
7
ba
|
9,837
sqft
|
built
1993
5400 W Deer Run Ct, Muncie, IN 47304
$-3,166
Cash flow
-14.0%
Cash-on-Cash Return
3.0%
Cap rate
0.4%
Rent to Value Ratio
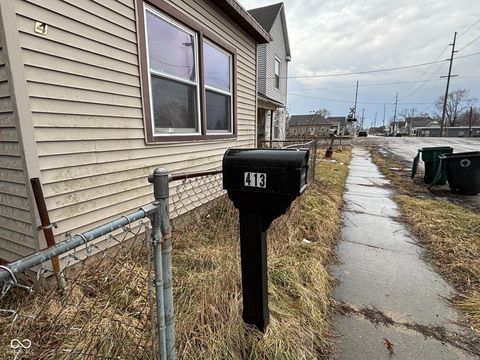
Active
$34,900
3
bds
|
2
ba
|
1,584
sqft
|
built
1895
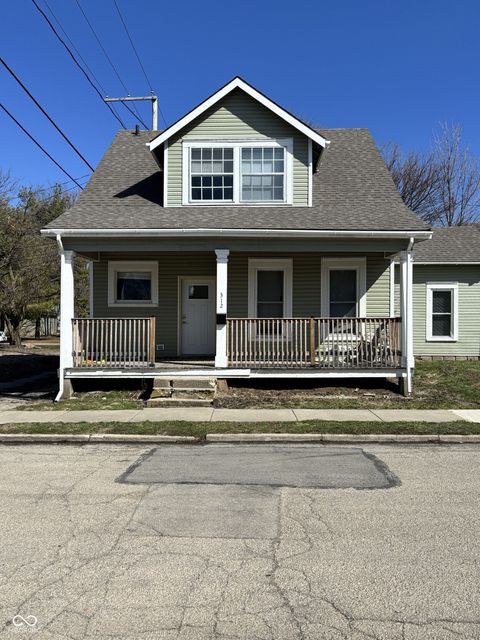
413 W 8th St, Muncie, IN 47302
$828
Cash flow
27.6%
Cash-on-Cash Return
28.5%
Cap rate
3.4%
Rent to Value Ratio

Active
$85,000
2
bds
|
1
ba
|
760
sqft
|
built
1948
1601 S Biltmore Ave, Muncie, IN 47302
$660
Cash flow
40.5%
Cash-on-Cash Return
15.6%
Cap rate
1.9%
Rent to Value Ratio
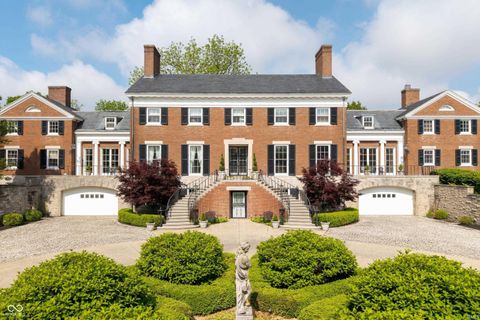
Active
$1,299,000
9
bds
|
9
ba
|
11,148
sqft
|
built
1938
4601 W Legacy Dr, Muncie, IN 47304
$-3,432
Cash flow
-13.8%
Cash-on-Cash Return
3.1%
Cap rate
0.4%
Rent to Value Ratio

Active
$100,000
2
bds
|
1
ba
|
936
sqft
|
built
1956
1618 E 24th St, Muncie, IN 47302
$237
Cash flow
12.4%
Cash-on-Cash Return
9.1%
Cap rate
1.1%
Rent to Value Ratio

Active
$75,000
3
bds
|
1
ba
|
1,215
sqft
|
built
1896
1708 W 7th St, Muncie, IN 47302
$436
Cash flow
30.3%
Cash-on-Cash Return
13.2%
Cap rate
1.6%
Rent to Value Ratio

Active
$800,000
2
bds
|
2
ba
|
2,074
sqft
|
built
1961
9100 S US Highway 35, Muncie, IN 47302
$-2,383
Cash flow
-15.5%
Cash-on-Cash Return
2.7%
Cap rate
0.3%
Rent to Value Ratio
Active
$69,000
3
bds
|
1
ba
|
1,204
sqft
|
built
1892
818 S Grant St, Muncie, IN 47302
$897
Cash flow
15.1%
Cash-on-Cash Return
15.6%
Cap rate
1.9%
Rent to Value Ratio
Active
$147,500
2
bds
|
1
ba
|
1,168
sqft
|
built
1928
313 S Brittain Ave, Muncie, IN 47303
$127
Cash flow
4.5%
Cash-on-Cash Return
7.3%
Cap rate
0.9%
Rent to Value Ratio
Active
$134,999
3
bds
|
2
ba
|
1,170
sqft
|
built
1940
2009 N New York Ave, Muncie, IN 47304
$192
Cash flow
7.4%
Cash-on-Cash Return
8.0%
Cap rate
1.0%
Rent to Value Ratio
Active
$69,900
4
bds
|
2
ba
|
1,624
sqft
|
built
1890
1809 E 13th St, Muncie, IN 47302
$759
Cash flow
12.7%
Cash-on-Cash Return
13.0%
Cap rate
1.6%
Rent to Value Ratio
Active
$795,000
6
bds
|
4
ba
|
8,741
sqft
|
built
1902
825 E Washington St, Muncie, IN 47305
$-1,666
Cash flow
-10.9%
Cash-on-Cash Return
3.7%
Cap rate
0.5%
Rent to Value Ratio
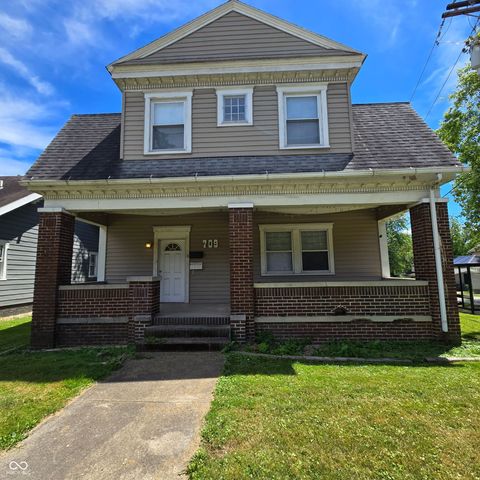
Active
$114,900
3
bds
|
1
ba
|
961
sqft
|
built
1884
709 S Vine St, Muncie, IN 47302
$297
Cash flow
13.5%
Cash-on-Cash Return
9.4%
Cap rate
1.1%
Rent to Value Ratio

Active
$107,000
2
bds
|
1
ba
|
728
sqft
|
built
1939
2015 S Hackley St, Muncie, IN 47302
$407
Cash flow
19.8%
Cash-on-Cash Return
10.8%
Cap rate
1.3%
Rent to Value Ratio
Active
$239,000
3
bds
|
2
ba
|
1,899
sqft
|
built
1972
10928 W Jackson St, Muncie, IN 47304
$-6
Cash flow
-0.1%
Cash-on-Cash Return
6.2%
Cap rate
0.8%
Rent to Value Ratio
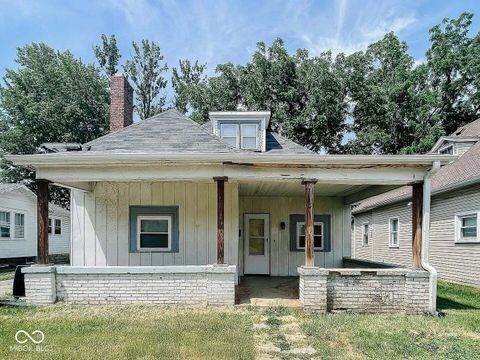
Active
$92,900
3
bds
|
1
ba
|
844
sqft
|
built
1920
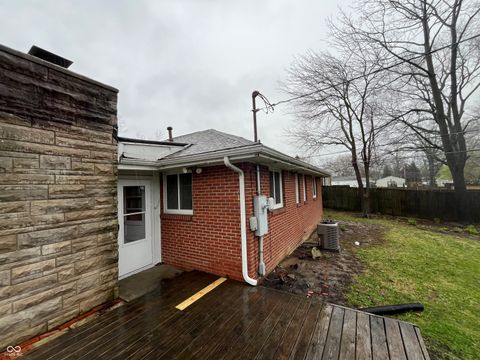
605 W 10th St, Muncie, IN 47302
$274
Cash flow
15.4%
Cash-on-Cash Return
9.8%
Cap rate
1.2%
Rent to Value Ratio
Active
$79,000
3
bds
|
2
ba
|
1,372
sqft
|
built
1899
711 W Centennial Ave, Muncie, IN 47303
$485
Cash flow
32.0%
Cash-on-Cash Return
13.6%
Cap rate
1.6%
Rent to Value Ratio
Active
$35,000
3
bds
|
1
ba
|
1,464
sqft
|
built
1898
1325 N Gavin St, Muncie, IN 47303
$828
Cash flow
27.6%
Cash-on-Cash Return
28.4%
Cap rate
3.4%
Rent to Value Ratio
Active
$15,000
3
bds
|
2
ba
|
0
sqft
|
built
1925
904 N Penn St, Muncie, IN 47303
$552
Cash flow
42.9%
Cash-on-Cash Return
44.2%
Cap rate
5.3%
Rent to Value Ratio
Active
$364,900
4
bds
|
3
ba
|
2,072
sqft
|
built
2020
425 S Bridge Water Ln, Muncie, IN 47304
$-356
Cash flow
-5.1%
Cash-on-Cash Return
5.1%
Cap rate
0.6%
Rent to Value Ratio
Active
$37,500
bds
|
1
ba
|
720
sqft
|
built
1967
1214 N Penn St, Muncie, IN 47303
$621
Cash flow
19.3%
Cash-on-Cash Return
19.9%
Cap rate
2.4%
Rent to Value Ratio
Active
$528,000
3
bds
|
2
ba
|
2,570
sqft
|
built
2003
6089 W Hellis Dr, Muncie, IN 47304
$-825
Cash flow
-8.2%
Cash-on-Cash Return
4.4%
Cap rate
0.5%
Rent to Value Ratio
Active
$169,000
2
bds
|
1
ba
|
792
sqft
|
built
1951
405 E Cowing Dr, Muncie, IN 47303
$84
Cash flow
2.6%
Cash-on-Cash Return
6.9%
Cap rate
0.8%
Rent to Value Ratio
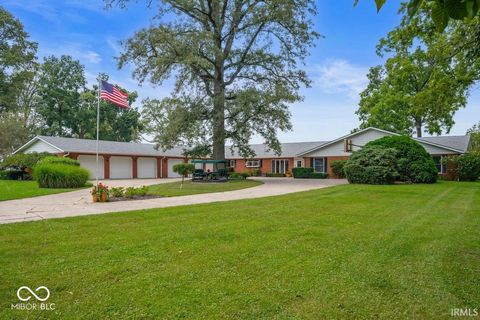
Active
$180,500
3
bds
|
4
ba
|
3,333
sqft
|
built
1938
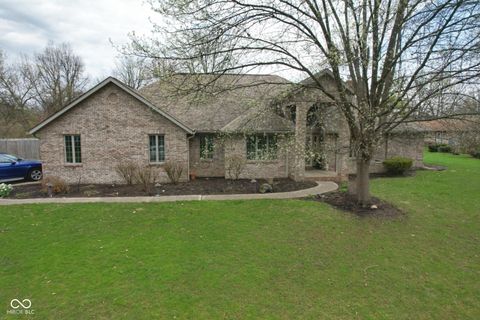
310 S Shady Ln, Muncie, IN 47304
$438
Cash flow
12.7%
Cash-on-Cash Return
9.2%
Cap rate
1.1%
Rent to Value Ratio
Active
$850,000
4
bds
|
5
ba
|
4,970
sqft
|
built
1970
3000 E County Road 400 N, Muncie, IN 47303
$-1,954
Cash flow
-12.0%
Cash-on-Cash Return
3.5%
Cap rate
0.4%
Rent to Value Ratio
Active
$139,900
3
bds
|
2
ba
|
2,436
sqft
|
built
1904
709 W Riverside Ave, Muncie, IN 47303
$443
Cash flow
16.5%
Cash-on-Cash Return
10.1%
Cap rate
1.2%
Rent to Value Ratio

Active
$16,900
3
bds
|
1
ba
|
1,000
sqft
|
built
1951
3812 S Ebright St, Muncie, IN 47302
$759
Cash flow
52.3%
Cash-on-Cash Return
53.9%
Cap rate
6.5%
Rent to Value Ratio
Active
$129,900
3
bds
|
2
ba
|
1,249
sqft
|
built
1890
712 W Queen St, Muncie, IN 47303
$288
Cash flow
11.6%
Cash-on-Cash Return
8.9%
Cap rate
1.1%
Rent to Value Ratio
Active
$110,000
4
bds
|
2
ba
|
1,736
sqft
|
built
1910
312 S Gharkey St, Muncie, IN 47305
$185
Cash flow
8.8%
Cash-on-Cash Return
8.3%
Cap rate
1.0%
Rent to Value Ratio

Active
$129,900
3
bds
|
2
ba
|
1,008
sqft
|
built
1929
2209 W 9th St, Muncie, IN 47302
$426
Cash flow
17.1%
Cash-on-Cash Return
10.2%
Cap rate
1.2%
Rent to Value Ratio
Active
$176,500
3
bds
|
3
ba
|
1,712
sqft
|
built
1951
1509 N Mann Ave, Muncie, IN 47304
$183
Cash flow
5.4%
Cash-on-Cash Return
7.5%
Cap rate
0.9%
Rent to Value Ratio
Active
$479,000
4
bds
|
4
ba
|
4,443
sqft
|
built
1994
4808 N Camelot Dr, Muncie, IN 47304
$-569
Cash flow
-6.2%
Cash-on-Cash Return
4.8%
Cap rate
0.6%
Rent to Value Ratio
Active
$155,000
3
bds
|
1
ba
|
1,050
sqft
|
built
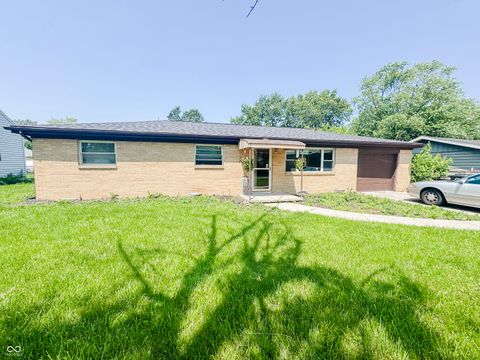
1960
3613 N Locust St, Muncie, IN 47304
$295
Cash flow
9.9%
Cash-on-Cash Return
8.5%
Cap rate
1.0%
Rent to Value Ratio
Active
$159,000
3
bds
|
1
ba
|
1,242
sqft
|
built
1935
921 W Carson St, Muncie, IN 47303
$136
Cash flow
4.5%
Cash-on-Cash Return
7.3%
Cap rate
0.9%
Rent to Value Ratio

Active
$799,900
3
bds
|
4
ba
|
4,671
sqft
|
built
1964
5707 S Burlington Dr, Muncie, IN 47302
$-2,451
Cash flow
-16.0%
Cash-on-Cash Return
2.6%
Cap rate
0.3%
Rent to Value Ratio