Johnston County Investment Properties for Sale
Browse homes for sale and investment properties in Johnston County. Refine your search by price, property type, or more.
Best cash flowing properties in Johnston County

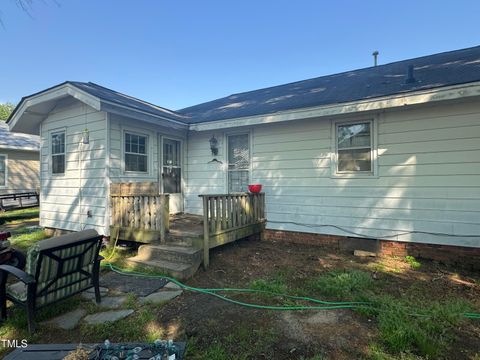
Active
$185,000
3
bds
|
2
ba
|
1,056
sqft
|
built
1965
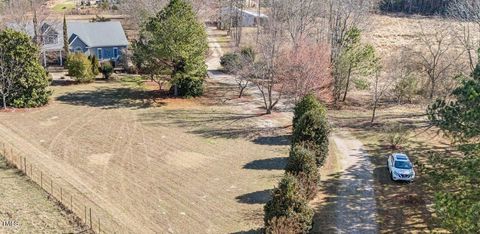
8535 US Highway 301 S, Four Oaks, NC 27524
$282
Cash flow
8.0%
Cash-on-Cash Return
7.5%
Cap rate
1.0%
Rent to Value Ratio
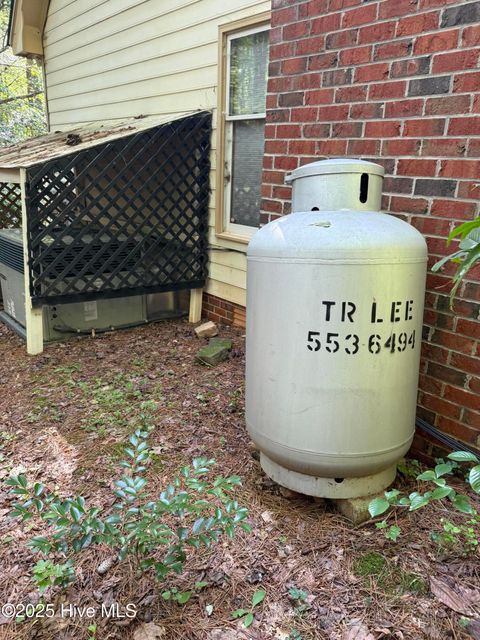
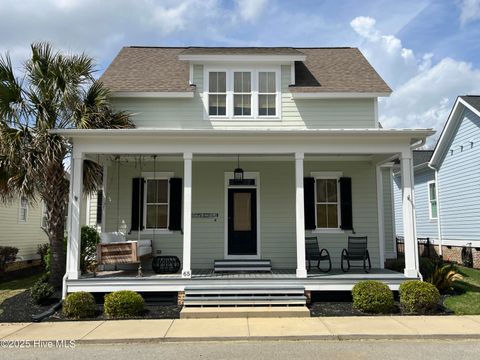
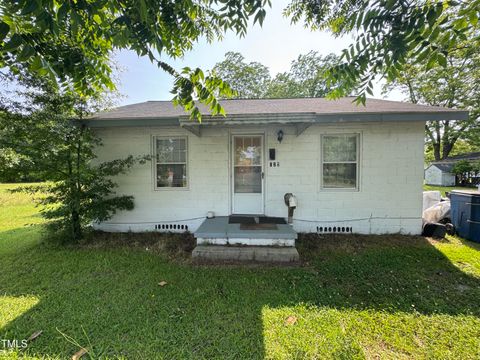
Active
$179,000
3
bds
|
1
ba
|
1,342
sqft
|
built
1940
212 S 6th St, Smithfield, NC 27577
$190
Cash flow
5.5%
Cash-on-Cash Return
7.0%
Cap rate
0.9%
Rent to Value Ratio
32 out of 478 properties for sale in Johnston County
Limited Results Shown
Create a free account, or log in to reveal all property listings and enjoy the complete experience.
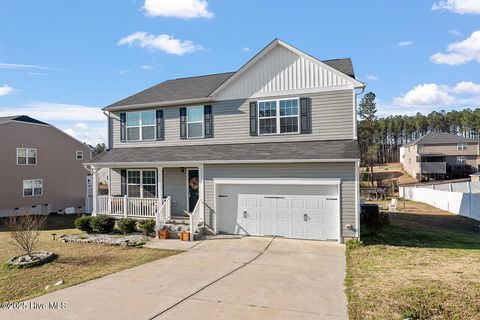
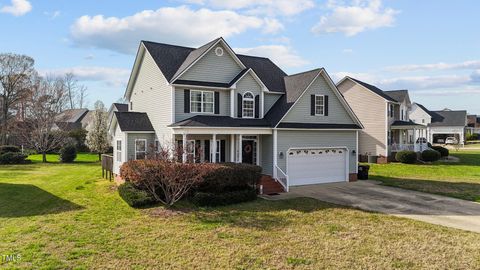
Active
$375,000
3
bds
|
3
ba
|
2,886
sqft
|
built
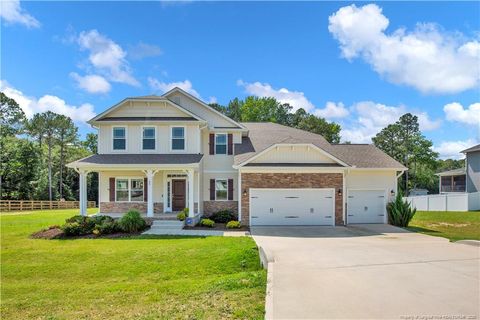
1986
2037 Deer Trl, Clayton, NC 27527
$-516
Cash flow
-7.2%
Cash-on-Cash Return
4.0%
Cap rate
0.6%
Rent to Value Ratio
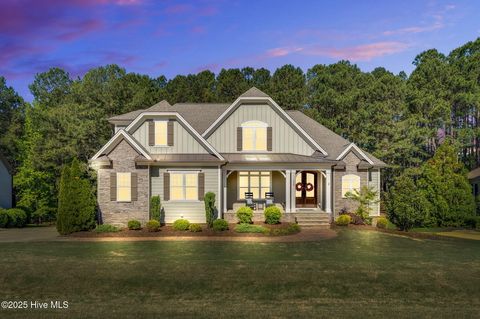
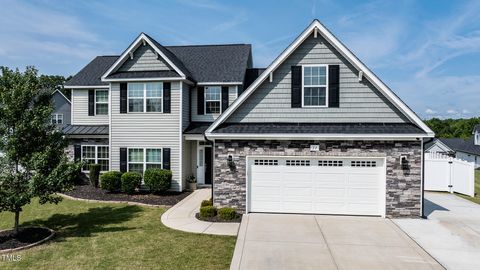
Active
$385,000
3
bds
|
3
ba
|
2,825
sqft
|
built
2017
59 Nevada Ct, Clayton, NC 27527
$-478
Cash flow
-6.5%
Cash-on-Cash Return
4.2%
Cap rate
0.6%
Rent to Value Ratio
Active
$1,119,900
4
bds
|
4
ba
|
4,988
sqft
|
built
2014
128 Paraggi Ct, Clayton, NC 27527
$-3,185
Cash flow
-14.8%
Cash-on-Cash Return
2.3%
Cap rate
0.4%
Rent to Value Ratio
Active
$609,000
4
bds
|
3
ba
|
3,179
sqft
|
built
2015
65 Oglethorpe Ave, Clayton, NC 27527
$-1,056
Cash flow
-9.0%
Cash-on-Cash Return
3.6%
Cap rate
0.4%
Rent to Value Ratio
Active
$299,900
3
bds
|
3
ba
|
2,377
sqft
|
built
1962
539 N Oneil St, Clayton, NC 27520
$-190
Cash flow
-3.3%
Cash-on-Cash Return
4.9%
Cap rate
0.7%
Rent to Value Ratio
Active
$530,000
6
bds
|
4
ba
|
0
sqft
|
built
1929
509 W Main St, Selma, NC 27576
$-1,611
Cash flow
-15.9%
Cash-on-Cash Return
2.0%
Cap rate
0.2%
Rent to Value Ratio

Active
$345,000
3
bds
|
2
ba
|
1,926
sqft
|
built
1900
8179 Nc Highway 39, Middlesex, NC 27557
$-253
Cash flow
-3.8%
Cash-on-Cash Return
4.8%
Cap rate
0.6%
Rent to Value Ratio
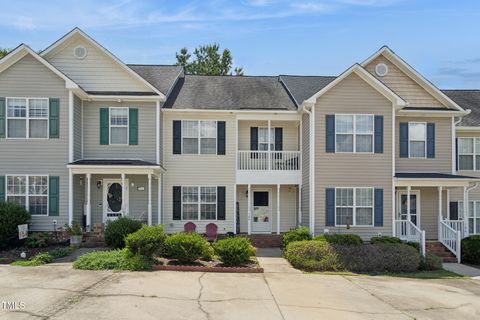
Active
$252,900
3
bds
|
3
ba
|
1,348
sqft
|
built
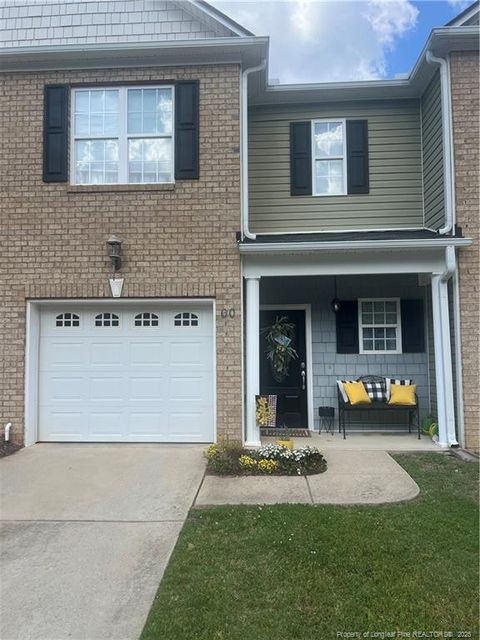
2007
106 Gatwick Ct, Clayton, NC 27520
$-258
Cash flow
-5.3%
Cash-on-Cash Return
4.5%
Cap rate
0.6%
Rent to Value Ratio
Active
$398,499
3
bds
|
3
ba
|
2,209
sqft
|
built
2007
323 Windgate Dr, Clayton, NC 27527
$-580
Cash flow
-7.6%
Cash-on-Cash Return
3.9%
Cap rate
0.6%
Rent to Value Ratio
Active
$475,000
10
bds
|
4
ba
|
3,910
sqft
|
built
1932
429 Bridge St, Smithfield, NC 27577
$-3,135
Cash flow
-34.4%
Cash-on-Cash Return
-2.2%
Cap rate
0.3%
Rent to Value Ratio
Active
$500,000
5
bds
|
4
ba
|
2,972
sqft
|
built
2017
77 Redpine Ct, Clayton, NC 27520
$-718
Cash flow
-7.5%
Cash-on-Cash Return
4.0%
Cap rate
0.6%
Rent to Value Ratio
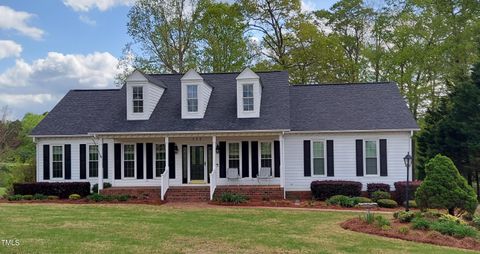
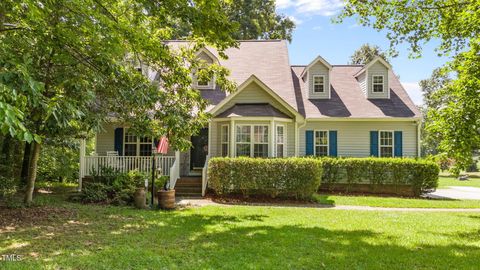
Active
$549,000
3
bds
|
2
ba
|
2,936
sqft
|
built
1997
117 Linwood Ln, Clayton, NC 27527
$-1,079
Cash flow
-10.3%
Cash-on-Cash Return
3.3%
Cap rate
0.5%
Rent to Value Ratio
Active
$419,900
3
bds
|
3
ba
|
2,071
sqft
|
built
1998
148 Gasper Ct, Clayton, NC 27527
$-653
Cash flow
-8.1%
Cash-on-Cash Return
3.8%
Cap rate
0.5%
Rent to Value Ratio
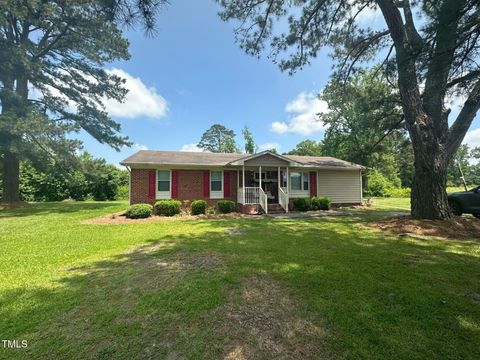
Active
$219,000
3
bds
|
2
ba
|
1,885
sqft
|
built
1974
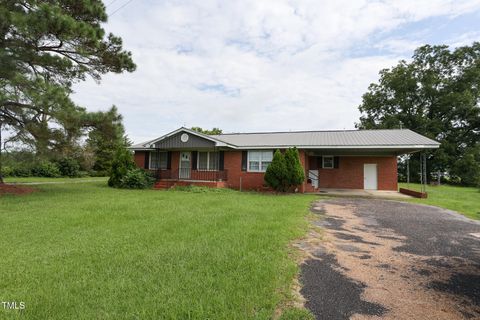
625 Revell Rd, Selma, NC 27576
$187
Cash flow
4.5%
Cash-on-Cash Return
6.7%
Cap rate
0.9%
Rent to Value Ratio
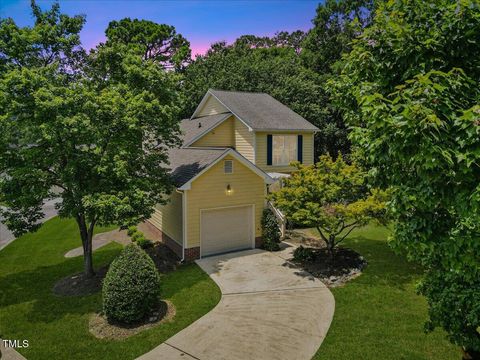
Active
$314,999
3
bds
|
3
ba
|
1,754
sqft
|
built
1994
20 Nicklaus Way, Clayton, NC 27520
$-500
Cash flow
-8.3%
Cash-on-Cash Return
3.8%
Cap rate
0.6%
Rent to Value Ratio

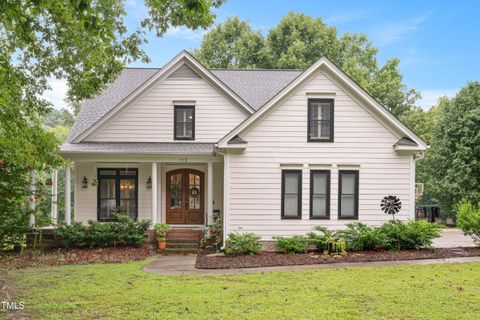
Active
$405,000
3
bds
|
3
ba
|
1,861
sqft
|
built
2000
303 Norwood Dr, Clayton, NC 27527
$-669
Cash flow
-8.6%
Cash-on-Cash Return
3.7%
Cap rate
0.5%
Rent to Value Ratio
Active
$550,000
3
bds
|
3
ba
|
2,803
sqft
|
built
1999
113 Claire Dr, Clayton, NC 27520
$-1,065
Cash flow
-10.1%
Cash-on-Cash Return
3.4%
Cap rate
0.5%
Rent to Value Ratio
Active
$350,000
3
bds
|
2
ba
|
1,338
sqft
|
built
2020
140 Rivercamp St, Clayton, NC 27527
$-688
Cash flow
-10.3%
Cash-on-Cash Return
3.3%
Cap rate
0.5%
Rent to Value Ratio
Active
$369,500
4
bds
|
3
ba
|
2,683
sqft
|
built
1978
411 E 2nd St, Kenly, NC 27542
$-543
Cash flow
-7.7%
Cash-on-Cash Return
3.9%
Cap rate
0.5%
Rent to Value Ratio
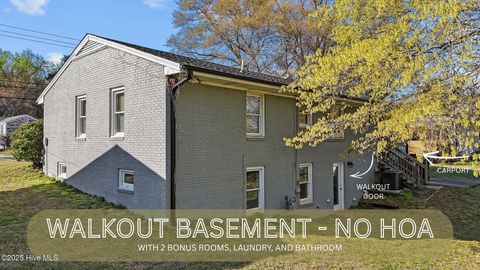
Active
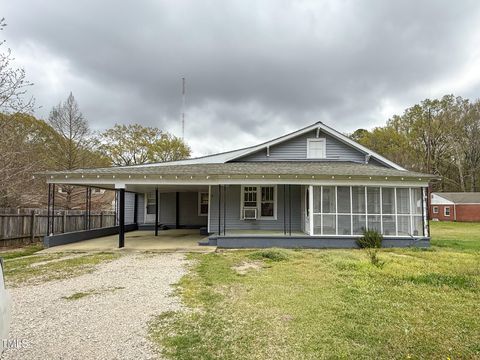
$190,000
3
bds
|
2
ba
|
1,512
sqft
|
built
1940
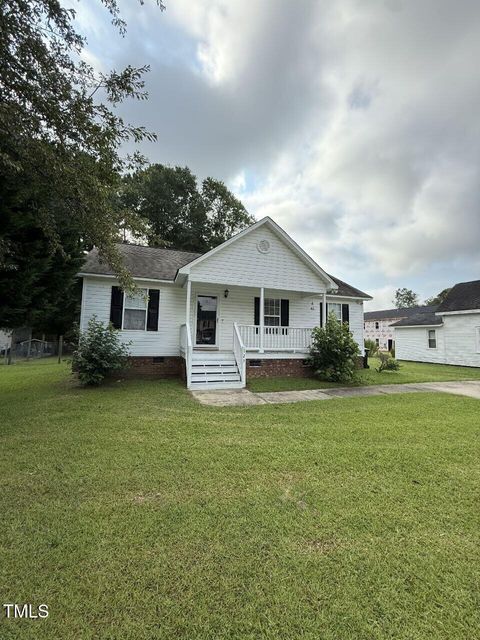
1324 Buffalo Rd, Smithfield, NC 27577
$130
Cash flow
3.6%
Cash-on-Cash Return
6.5%
Cap rate
0.8%
Rent to Value Ratio
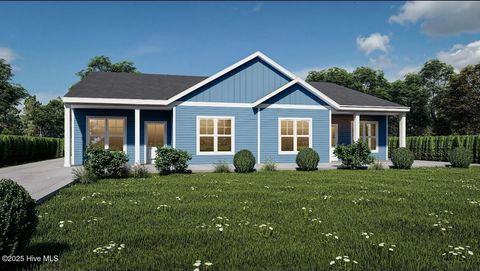
Active
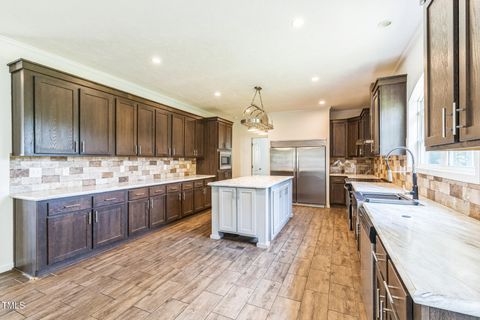
$334,900
4
bds
|
3
ba
|
2,280
sqft
|
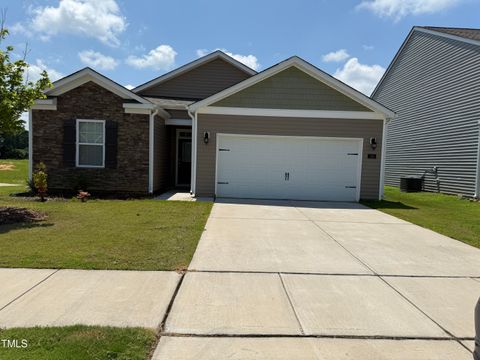
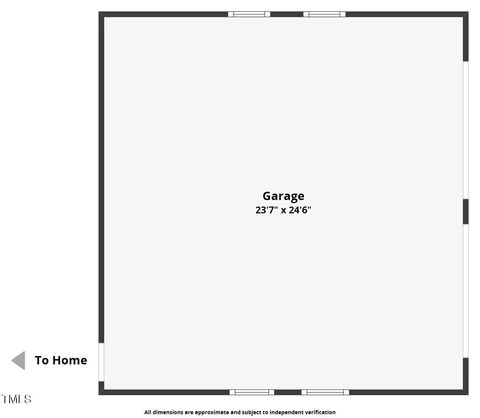
built
2020
589 Atkinson Mill Rd, Selma, NC 27576
$0
Cash flow
n/a
Cash-on-Cash Return
n/a
Cap rate
n/a
Rent to Value Ratio
Active
$275,000
3
bds
|
3
ba
|
1,792
sqft
|
built
2007
60 Hill Shore Ln, Clayton, NC 27527
$-239
Cash flow
-4.5%
Cash-on-Cash Return
4.6%
Cap rate
0.7%
Rent to Value Ratio
Active
$575,000
4
bds
|
4
ba
|
3,435
sqft
|
built
2010
304 Nelson Ln, Clayton, NC 27527
$-1,455
Cash flow
-13.2%
Cash-on-Cash Return
2.6%
Cap rate
0.4%
Rent to Value Ratio
Active
$600,000
3
bds
|
3
ba
|
3,590
sqft
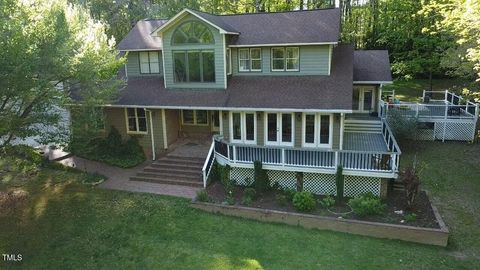
|
built
1989
2000 Mountain Laurel Dr, Clayton, NC 27527
$-1,254
Cash flow
-10.9%
Cash-on-Cash Return
3.2%
Cap rate
0.5%
Rent to Value Ratio
Active
$305,900
3
bds
|
2
ba
|
1,290
sqft
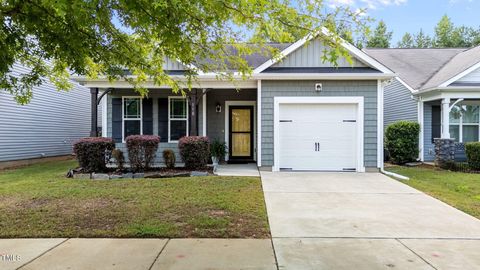
|
built
2016
118 Balboa Pkwy, Clayton, NC 27520
$-530
Cash flow
-9.0%
Cash-on-Cash Return
3.6%
Cap rate
0.6%
Rent to Value Ratio
Active
$890,000
3
bds
|
2
ba
|
2,118
sqft
|
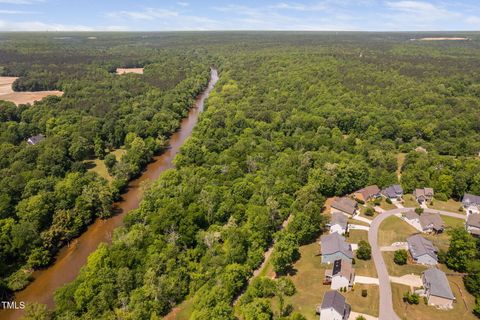
built
2004
2490 Earpsboro Rd, Zebulon, NC 27597
$-2,917
Cash flow
-17.1%
Cash-on-Cash Return
1.7%
Cap rate
0.2%
Rent to Value Ratio
Active
$574,000
5
bds
|
4
ba
|
3,629
sqft
|
built
2022
66 S Hawks Ridge Ln, Smithfield, NC 27577
$-809
Cash flow
-7.4%
Cash-on-Cash Return
4.0%
Cap rate
0.5%
Rent to Value Ratio
Active
$175,000
3
bds
|
2
ba
|
1,452
sqft
|
built
1970
904 Langston Rd, Newton Grove, NC 28366
$182
Cash flow
5.4%
Cash-on-Cash Return
6.9%
Cap rate
0.9%
Rent to Value Ratio
Active
$225,000
3
bds
|
2
ba
|
1,026
sqft
|
built
2004
125 Temple St, Four Oaks, NC 27524
$-61
Cash flow
-1.4%
Cash-on-Cash Return
5.4%
Cap rate
0.7%
Rent to Value Ratio
Active
$473,900
3
bds
|
3
ba
|
2,556
sqft
|
built
2023
67 Cedarbrook Dr, Benson, NC 27504
$-704
Cash flow
-7.8%
Cash-on-Cash Return
3.9%
Cap rate
0.5%
Rent to Value Ratio