North Las Vegas, NV Investment Properties for Sale
Browse homes for sale and investment properties in North Las Vegas, NV. Refine your search by price, property type, or more.
Best cash flowing properties in North Las Vegas, NV

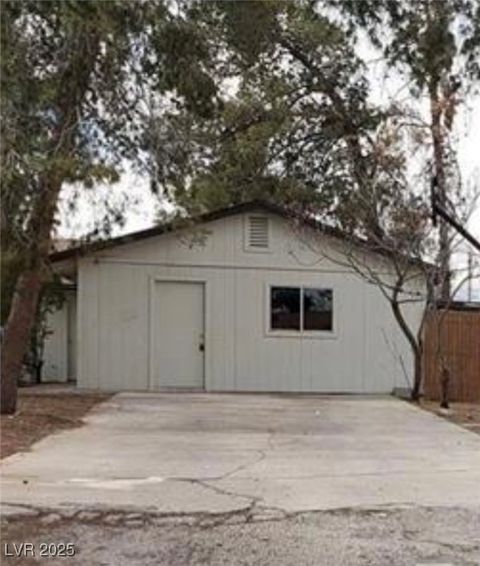
Active
$194,900
3
bds
|
2
ba
|
1,154
sqft
|
built
1971
2525 Donna St, North Las Vegas, NV 89030
$-247
Cash flow
-6.6%
Cash-on-Cash Return
4.7%
Cap rate
0.7%
Rent to Value Ratio

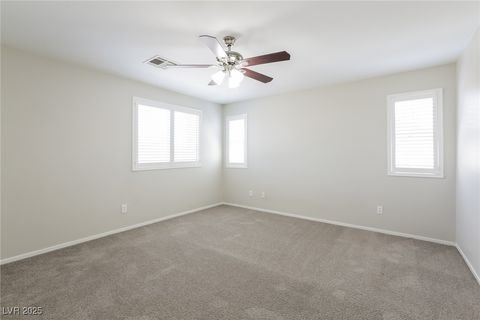
Active
$248,000
3
bds
|
2
ba
|
1,235
sqft
|
built
1971
3535 Mercury St, North Las Vegas, NV 89030
$-416
Cash flow
-8.8%
Cash-on-Cash Return
4.3%
Cap rate
0.6%
Rent to Value Ratio
580 out of 598 properties for sale in North Las Vegas, NV
Limited Results Shown
Create a free account, or log in to reveal all property listings and enjoy the complete experience.
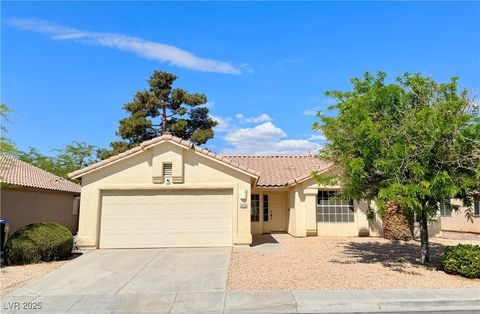
Active
$399,000
4
bds
|
3
ba
|
2,121
sqft
|
built
2020
104 Pollentia Ave, North Las Vegas, NV 89084
$-939
Cash flow
-12.3%
Cash-on-Cash Return
3.4%
Cap rate
0.6%
Rent to Value Ratio

Active
$619,998
4
bds
|
3
ba
|
2,260
sqft
|
built
2021
3817 Grazing Gazelle Ave, North Las Vegas, NV 89084
$-1,970
Cash flow
-16.6%
Cash-on-Cash Return
2.5%
Cap rate
0.4%
Rent to Value Ratio
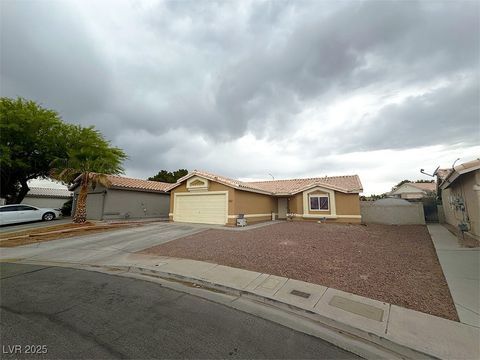
Active
$387,000
3
bds
|
2
ba
|
1,415
sqft
|
built
2021
617 Abrazar Ave, North Las Vegas, NV 89081
$-899
Cash flow
-12.1%
Cash-on-Cash Return
3.5%
Cap rate
0.6%
Rent to Value Ratio
Active
$449,999
4
bds
|
2
ba
|
1,846
sqft
|
built
2004
6013 Aqua Blue Ct, North Las Vegas, NV 89031
$-1,050
Cash flow
-12.2%
Cash-on-Cash Return
3.5%
Cap rate
0.5%
Rent to Value Ratio

Active
$499,999
4
bds
|
3
ba
|
1,957
sqft
|
built
2000
1906 Desert Sage Ave, North Las Vegas, NV 89031
$-1,072
Cash flow
-11.2%
Cash-on-Cash Return
3.7%
Cap rate
0.5%
Rent to Value Ratio

Active
$237,500
2
bds
|
2
ba
|
1,151
sqft
|
built
2000
1881 W Alexander Rd, North Las Vegas, NV 89032
$-618
Cash flow
-13.6%
Cash-on-Cash Return
3.1%
Cap rate
0.6%
Rent to Value Ratio
Active
$495,000
4
bds
|
3
ba
|
2,415
sqft
|
built
2020
7733 Rosebark Cliffs St, North Las Vegas, NV 89084
$-1,276
Cash flow
-13.4%
Cash-on-Cash Return
3.2%
Cap rate
0.5%
Rent to Value Ratio
Active
$645,000
3
bds
|
3
ba
|
2,582
sqft
|
built
2019
1608 Rock Ridge Pl, North Las Vegas, NV 89084
$-1,904
Cash flow
-15.4%
Cash-on-Cash Return
2.7%
Cap rate
0.4%
Rent to Value Ratio

Active
$399,999
4
bds
|
3
ba
|
1,892
sqft
|
built
2009
1512 Groom Ave, North Las Vegas, NV 89081
$-822
Cash flow
-10.7%
Cash-on-Cash Return
3.8%
Cap rate
0.6%
Rent to Value Ratio
Active
$485,000
4
bds
|
2
ba
|
1,917
sqft
|
built
2016
4837 Skyraider St, North Las Vegas, NV 89031
$-1,297
Cash flow
-14.0%
Cash-on-Cash Return
3.1%
Cap rate
0.5%
Rent to Value Ratio
Active
$544,999
2
bds
|
0
ba
|
1,932
sqft
|
built
1959
2412 Bassler St, North Las Vegas, NV 89030
$-2,221
Cash flow
-21.3%
Cash-on-Cash Return
1.4%
Cap rate
0.2%
Rent to Value Ratio
Active
$815,000
6
bds
|
5
ba
|
4,443
sqft
|
built
2024
7855 Skyler Falls Ln, North Las Vegas, NV 89084
$-3,226
Cash flow
-20.7%
Cash-on-Cash Return
1.5%
Cap rate
0.3%
Rent to Value Ratio

Active
$455,000
3
bds
|
2
ba
|
1,914
sqft
|
built
2022
3440 Ernest St, North Las Vegas, NV 89032
$-596
Cash flow
-6.8%
Cash-on-Cash Return
4.7%
Cap rate
0.7%
Rent to Value Ratio

Active
$459,000
3
bds
|
3
ba
|
2,036
sqft
|
built
2017
7175 Steubling Glen St, North Las Vegas, NV 89084
$-1,310
Cash flow
-14.9%
Cash-on-Cash Return
2.8%
Cap rate
0.5%
Rent to Value Ratio

Active
$513,000
4
bds
|
2
ba
|
2,179
sqft
|
built
2004
4119 Amberdale Ave, North Las Vegas, NV 89031
$-1,021
Cash flow
-10.4%
Cash-on-Cash Return
3.9%
Cap rate
0.5%
Rent to Value Ratio
Active
$655,000
4
bds
|
3
ba
|
2,582
sqft
|
built
2018
6834 Moorland St, North Las Vegas, NV 89084
$-2,156
Cash flow
-17.2%
Cash-on-Cash Return
2.3%
Cap rate
0.4%
Rent to Value Ratio

Active
$455,000
3
bds
|
2
ba
|
1,585
sqft
|
built
2019
1634 Deep Valley Ave, North Las Vegas, NV 89084
$-1,252
Cash flow
-14.4%
Cash-on-Cash Return
3.0%
Cap rate
0.5%
Rent to Value Ratio
Active
$430,000
3
bds
|
2
ba
|
1,701
sqft
|
built
2001
1829 Fighting Falcon Ln, North Las Vegas, NV 89031
$-1,052
Cash flow
-12.8%
Cash-on-Cash Return
3.3%
Cap rate
0.5%
Rent to Value Ratio

Active
$400,000
4
bds
|
2
ba
|
1,442
sqft
|
built
1996
2103 Falcon Crest Ave, North Las Vegas, NV 89031
$-817
Cash flow
-10.7%
Cash-on-Cash Return
3.8%
Cap rate
0.5%
Rent to Value Ratio
Active
$435,000
3
bds
|
2
ba
|
1,805
sqft
|
built
2008
5521 Moss Landing St, North Las Vegas, NV 89031
$-1,127
Cash flow
-13.5%
Cash-on-Cash Return
3.2%
Cap rate
0.5%
Rent to Value Ratio
Active
$299,900
2
bds
|
2
ba
|
1,410
sqft
|
built
2004
5855 Valley Dr, North Las Vegas, NV 89031
$-687
Cash flow
-12.0%
Cash-on-Cash Return
3.5%
Cap rate
0.6%
Rent to Value Ratio
Active
$379,900
3
bds
|
3
ba
|
1,492
sqft
|
built
2022
6437 Butterfly Sky St, North Las Vegas, NV 89084
$-1,278
Cash flow
-17.6%
Cash-on-Cash Return
2.2%
Cap rate
0.5%
Rent to Value Ratio
Active
$425,000
4
bds
|
2
ba
|
1,868
sqft
|
built
2000
4313 Beach Cliff Ave, North Las Vegas, NV 89031
$-1,021
Cash flow
-12.5%
Cash-on-Cash Return
3.4%
Cap rate
0.5%
Rent to Value Ratio

Active
$529,900
4
bds
|
3
ba
|
2,560
sqft
|
built
2004
6437 Boatbill St, North Las Vegas, NV 89084
$-1,081
Cash flow
-10.6%
Cash-on-Cash Return
3.8%
Cap rate
0.5%
Rent to Value Ratio
Active
$481,000
3
bds
|
3
ba
|
2,480
sqft
|
built
2008
3820 Alpine Track Ave, North Las Vegas, NV 89032
$-900
Cash flow
-9.8%
Cash-on-Cash Return
4.0%
Cap rate
0.6%
Rent to Value Ratio

Active
$450,000
4
bds
|
3
ba
|
2,259
sqft
|
built
2003
1019 Felix Palm Ave, North Las Vegas, NV 89032
$-852
Cash flow
-9.9%
Cash-on-Cash Return
4.0%
Cap rate
0.6%
Rent to Value Ratio
Active
$499,900
4
bds
|
3
ba
|
2,403
sqft
|
built
2002
5738 Bear Springs St, North Las Vegas, NV 89031
$-1,431
Cash flow
-14.9%
Cash-on-Cash Return
2.8%
Cap rate
0.4%
Rent to Value Ratio

Active
$399,999
3
bds
|
2
ba
|
2,057
sqft
|
built
2006
5832 Elphin Ct, North Las Vegas, NV 89031
$-803
Cash flow
-10.5%
Cash-on-Cash Return
3.9%
Cap rate
0.6%
Rent to Value Ratio
Active
$399,900
3
bds
|
2
ba
|
1,690
sqft
|
built
1997
3523 Calf Roper Ct, North Las Vegas, NV 89032
$-845
Cash flow
-11.0%
Cash-on-Cash Return
3.7%
Cap rate
0.5%
Rent to Value Ratio

Active
$385,000
3
bds
|
2
ba
|
1,220
sqft
|
built
2002
6314 Shadow Moon Pl, North Las Vegas, NV 89031
$-821
Cash flow
-11.1%
Cash-on-Cash Return
3.7%
Cap rate
0.5%
Rent to Value Ratio
Active
$408,000
4
bds
|
2
ba
|
1,402
sqft
|
built
1996
5135 Shimmering Peak Way, North Las Vegas, NV 89031
$-1,011
Cash flow
-12.9%
Cash-on-Cash Return
3.3%
Cap rate
0.4%
Rent to Value Ratio
Active
$624,900
4
bds
|
2
ba
|
1,794
sqft
|
built
1978
4341 San Mateo St, North Las Vegas, NV 89032
$-2,416
Cash flow
-20.2%
Cash-on-Cash Return
1.6%
Cap rate
0.2%
Rent to Value Ratio
Active
$359,900
3
bds
|
3
ba
|
1,364
sqft
|
built
2007
6319 Blushing Willow St, North Las Vegas, NV 89081
$-999
Cash flow
-14.5%
Cash-on-Cash Return
2.9%
Cap rate
0.4%
Rent to Value Ratio

Active
$364,900
3
bds
|
4
ba
|
1,841
sqft
|
built
2015
4650 Ranch House Rd, North Las Vegas, NV 89031
$-1,068
Cash flow
-15.3%
Cash-on-Cash Return
2.8%
Cap rate
0.5%
Rent to Value Ratio
Active
$675,500
4
bds
|
3
ba
|
2,562
sqft
|
built
2004
6712 Tattler Dr, North Las Vegas, NV 89084
$-1,997
Cash flow
-15.4%
Cash-on-Cash Return
2.7%
Cap rate
0.4%
Rent to Value Ratio
Active
$624,499
4
bds
|
3
ba
|
2,748
sqft
|
built
2021
6602 Windy Palm St, North Las Vegas, NV 89086
$-1,899
Cash flow
-15.9%
Cash-on-Cash Return
2.6%
Cap rate
0.4%
Rent to Value Ratio

Active
$549,950
6
bds
|
4
ba
|
3,057
sqft
|
built
2015
4361 Duck Harbor Ave, North Las Vegas, NV 89031
$-1,387
Cash flow
-13.2%
Cash-on-Cash Return
3.2%
Cap rate
0.5%
Rent to Value Ratio
Active
$529,900
5
bds
|
3
ba
|
2,944
sqft
|
built
2021
934 Twincrest Ave, North Las Vegas, NV 89032
$-1,404
Cash flow
-13.8%
Cash-on-Cash Return
3.1%
Cap rate
0.5%
Rent to Value Ratio