Clark County Investment Properties for Sale
Browse homes for sale and investment properties in Clark County. Refine your search by price, property type, or more.
Best cash flowing properties in Clark County
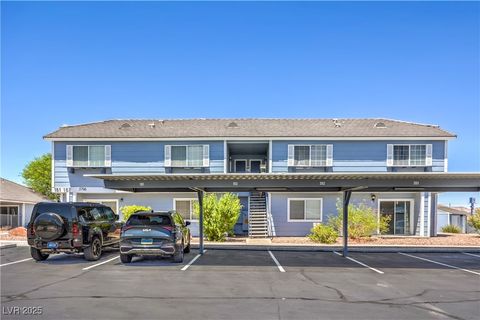
Active
$165,000
2
bds
|
2
ba
|
872
sqft
|
built
2001
5796 Ambassador Ave, Las Vegas, NV 89122
$-265
Cash flow
-8.4%
Cash-on-Cash Return
3.8%
Cap rate
0.7%
Rent to Value Ratio
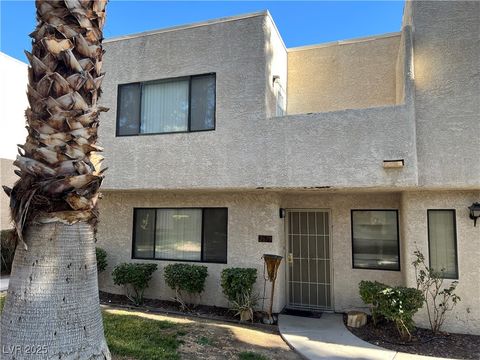
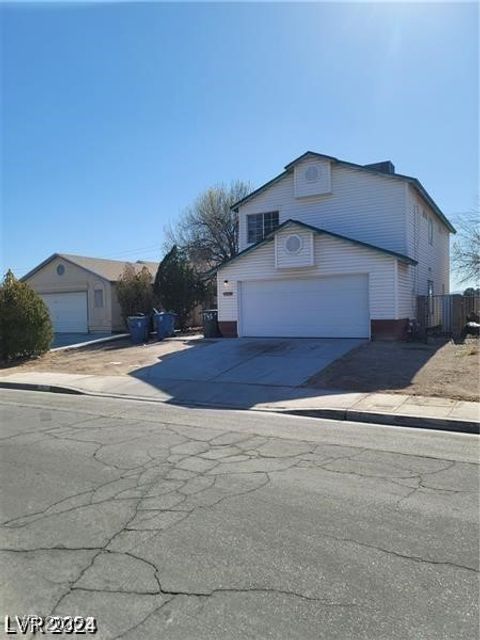
Active
$277,500
3
bds
|
3
ba
|
1,550
sqft
|
built
1988
2679 Jacyra Ave, Las Vegas, NV 89121
$-335
Cash flow
-6.3%
Cash-on-Cash Return
4.2%
Cap rate
0.6%
Rent to Value Ratio
6,426 out of 6,647 properties for sale in Clark County
Limited Results Shown
Create a free account, or log in to reveal all property listings and enjoy the complete experience.
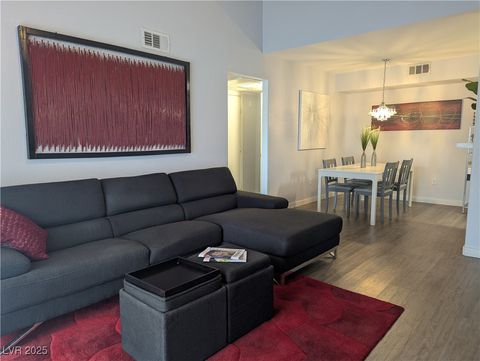
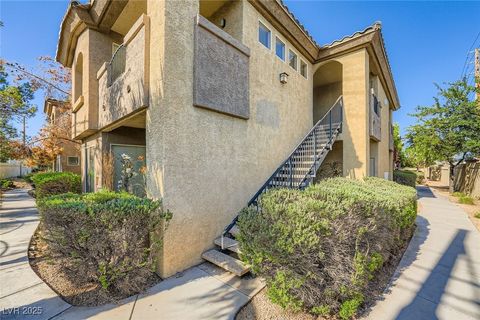
Active
$230,000
1
bds
|
1
ba
|
700
sqft
|
built
2001
6650 W Warm Springs Rd, Las Vegas, NV 89118
$-461
Cash flow
-10.5%
Cash-on-Cash Return
3.3%
Cap rate
0.5%
Rent to Value Ratio
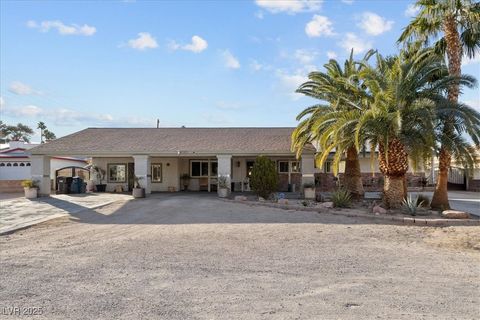
Active
$784,999
3
bds
|
2
ba
|
2,628
sqft
|
built
1973
4365 Topaz St, Las Vegas, NV 89121
$-1,414
Cash flow
-9.4%
Cash-on-Cash Return
3.5%
Cap rate
0.5%
Rent to Value Ratio
Active
$199,999
3
bds
|
2
ba
|
1,074
sqft
|
built
1987
2983 Juniper Hills Blvd, Las Vegas, NV 89142
$-386
Cash flow
-10.1%
Cash-on-Cash Return
3.4%
Cap rate
0.7%
Rent to Value Ratio
Active
$315,000
2
bds
|
2
ba
|
1,291
sqft
|
built
1998
2325 Windmill Pkwy, Henderson, NV 89074
$-649
Cash flow
-10.7%
Cash-on-Cash Return
3.2%
Cap rate
0.6%
Rent to Value Ratio
Active
$288,000
1
bds
|
1
ba
|
680
sqft
|
built
1990
4200 S Valley View Blvd, Las Vegas, NV 89103
$-618
Cash flow
-11.2%
Cash-on-Cash Return
3.1%
Cap rate
0.6%
Rent to Value Ratio
Active
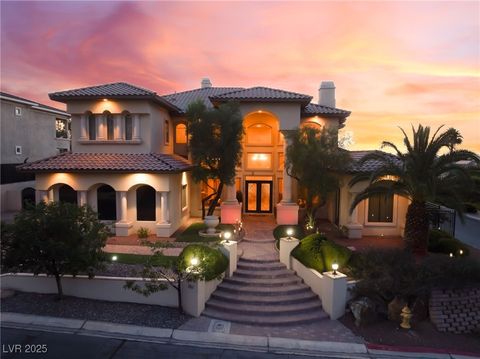
$794,900
4
bds
|
3
ba
|
3,402
sqft
|
built
2003
4021 Mountain Trek St, Las Vegas, NV 89129
$-1,937
Cash flow
-12.7%
Cash-on-Cash Return
2.8%
Cap rate
0.4%
Rent to Value Ratio

Active
$525,000
3
bds
|
2
ba
|
1,744
sqft
|
built
2000
3029 Paseo Hills Way, Henderson, NV 89052
$-1,287
Cash flow
-12.8%
Cash-on-Cash Return
2.7%
Cap rate
0.4%
Rent to Value Ratio
Active
$450,000
3
bds
|
3
ba
|
1,947
sqft
|
built
2022
6952 Crescent Gold St, North Las Vegas, NV 89086
$-1,031
Cash flow
-12.0%
Cash-on-Cash Return
2.9%
Cap rate
0.6%
Rent to Value Ratio
Active
$290,000
2
bds
|
2
ba
|
1,177
sqft
|
built
1996
6480 Annie Oakley Dr, Las Vegas, NV 89120
$-482
Cash flow
-8.7%
Cash-on-Cash Return
3.7%
Cap rate
0.6%
Rent to Value Ratio
Active
$155,900
1
bds
|
1
ba
|
697
sqft
|
built
1995
3041 Casey Dr, Las Vegas, NV 89120
$-338
Cash flow
-11.3%
Cash-on-Cash Return
3.1%
Cap rate
0.7%
Rent to Value Ratio
Active
$421,000
4
bds
|
3
ba
|
1,813
sqft
|
built
2007
6622 Colorado Spruce St, Las Vegas, NV 89149
$-856
Cash flow
-10.6%
Cash-on-Cash Return
3.2%
Cap rate
0.5%
Rent to Value Ratio
Active
$224,000
2
bds
|
2
ba
|
947
sqft
|
built
1998
4400 S Jones Blvd, Las Vegas, NV 89103
$-443
Cash flow
-10.3%
Cash-on-Cash Return
3.3%
Cap rate
0.6%
Rent to Value Ratio

Active
$249,900
2
bds
|
2
ba
|
893
sqft
|
built
1999
5055 W Hacienda Ave, Las Vegas, NV 89118
$-528
Cash flow
-11.0%
Cash-on-Cash Return
3.1%
Cap rate
0.6%
Rent to Value Ratio
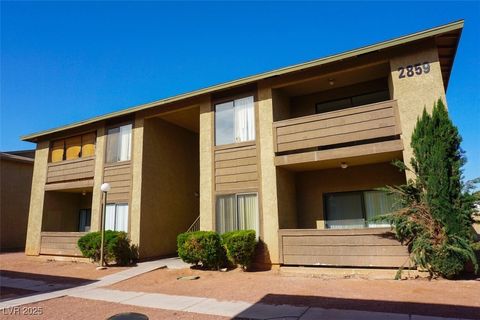
Active
$599,000
8
bds
|
0
ba
|
3,672
sqft
|
built
1984
2859 Wheelwright Dr, Las Vegas, NV 89121
$-2,084
Cash flow
-18.2%
Cash-on-Cash Return
1.5%
Cap rate
0.2%
Rent to Value Ratio
Active
$530,000
3
bds
|
3
ba
|
1,834
sqft
|
built
2023
55 Strada Fontana, Henderson, NV 89011
$-1,158
Cash flow
-11.4%
Cash-on-Cash Return
3.1%
Cap rate
0.5%
Rent to Value Ratio
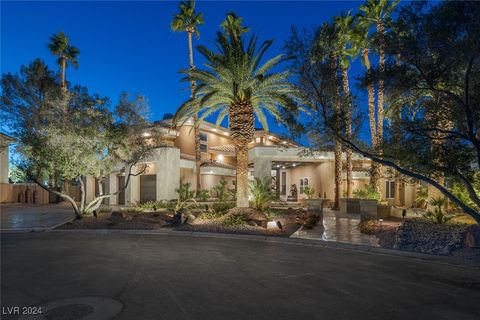
Active
$3,999,999
4
bds
|
7
ba
|
6,670
sqft
|
built
1996
4927 Spanish Heights Dr, Las Vegas, NV 89148
$-13,477
Cash flow
-17.6%
Cash-on-Cash Return
1.6%
Cap rate
0.3%
Rent to Value Ratio
Active
$314,998
2
bds
|
2
ba
|
1,062
sqft
|
built
1992
270 E Flamingo Rd, Las Vegas, NV 89169
$-842
Cash flow
-13.9%
Cash-on-Cash Return
2.5%
Cap rate
0.6%
Rent to Value Ratio
Active
$378,900
2
bds
|
2
ba
|
902
sqft
|
built
1990
4200 S Valley View Blvd, Las Vegas, NV 89103
$-1,164
Cash flow
-16.0%
Cash-on-Cash Return
2.0%
Cap rate
0.4%
Rent to Value Ratio
Active
$388,888
3
bds
|
2
ba
|
1,942
sqft
|
built
1989
3987 Saddlewood Ct, Las Vegas, NV 89121
$-920
Cash flow
-12.3%
Cash-on-Cash Return
2.8%
Cap rate
0.5%
Rent to Value Ratio
Active
$938,000
4
bds
|
3
ba
|
2,545
sqft
|
built
2003
6245 Galileo Dr, Las Vegas, NV 89149
$-2,388
Cash flow
-13.3%
Cash-on-Cash Return
2.6%
Cap rate
0.4%
Rent to Value Ratio
Active
$6,950,000
5
bds
|
8
ba
|
8,940
sqft
|
built
2008
11 Misty Peaks Ct, Las Vegas, NV 89135
$-30,680
Cash flow
-23.0%
Cash-on-Cash Return
0.4%
Cap rate
0.1%
Rent to Value Ratio
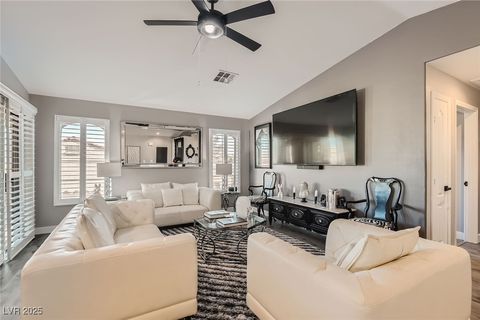
Active
$485,000
4
bds
|
3
ba
|
1,883
sqft
|
built
1994
3440 Meridale Dr, Las Vegas, NV 89117
$-873
Cash flow
-9.4%
Cash-on-Cash Return
3.5%
Cap rate
0.5%
Rent to Value Ratio
Active
$585,000
3
bds
|
2
ba
|
2,490
sqft
|
built
1972
6949 Blacksmith Ct, Las Vegas, NV 89145
$-1,192
Cash flow
-10.6%
Cash-on-Cash Return
3.2%
Cap rate
0.4%
Rent to Value Ratio
Active
$414,900
4
bds
|
3
ba
|
2,332
sqft
|
built
1988
2111 River City Dr, Laughlin, NV 89029
$-397
Cash flow
-5.0%
Cash-on-Cash Return
4.5%
Cap rate
0.6%
Rent to Value Ratio
Active
$2,270,000
4
bds
|
5
ba
|
5,321
sqft
|
built
2005
761 Romano Ln, Henderson, NV 89012
$-4,624
Cash flow
-10.6%
Cash-on-Cash Return
3.2%
Cap rate
0.5%
Rent to Value Ratio
Active
$1,500,000
3
bds
|
2
ba
|
2,194
sqft
|
built
2020
5315 N Fort Apache Rd, Las Vegas, NV 89149
$-5,612
Cash flow
-19.5%
Cash-on-Cash Return
1.2%
Cap rate
0.2%
Rent to Value Ratio
Active
$429,900
3
bds
|
3
ba
|
1,494
sqft
|
built
1989
1745 Starridge Way, Las Vegas, NV 89142
$-1,031
Cash flow
-12.5%
Cash-on-Cash Return
2.8%
Cap rate
0.4%
Rent to Value Ratio
Active
$315,000
2
bds
|
2
ba
|
1,083
sqft
|
built
2002
7250 Diamond Canyon Ln, Las Vegas, NV 89149
$-717
Cash flow
-11.9%
Cash-on-Cash Return
2.9%
Cap rate
0.6%
Rent to Value Ratio
Active
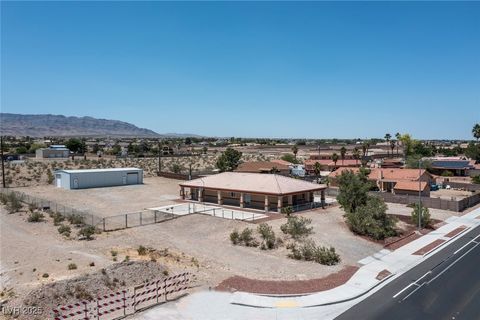
$730,000
4
bds
|
2
ba
|
2,056
sqft
|
built
1977
4300 Thom Blvd, Las Vegas, NV 89130
$-2,172
Cash flow
-15.5%
Cash-on-Cash Return
2.1%
Cap rate
0.3%
Rent to Value Ratio

Active
$529,900
3
bds
|
3
ba
|
1,770
sqft
|
built
2008
1168 Aspen Cliff Dr, Henderson, NV 89011
$-1,337
Cash flow
-13.2%
Cash-on-Cash Return
2.7%
Cap rate
0.4%
Rent to Value Ratio
Active
$700,000
5
bds
|
3
ba
|
3,159
sqft
|
built
1998
268 Copper Glow Ct, Henderson, NV 89074
$-984
Cash flow
-7.3%
Cash-on-Cash Return
4.0%
Cap rate
0.6%
Rent to Value Ratio
Active
$204,999
1
bds
|
1
ba
|
700
sqft
|
built
2004
6955 N Durango Dr, Las Vegas, NV 89149
$-390
Cash flow
-9.9%
Cash-on-Cash Return
3.4%
Cap rate
0.6%
Rent to Value Ratio

Active
$425,000
4
bds
|
3
ba
|
2,022
sqft
|
built
2022
247 Desoto Falls St, Indian Springs, NV 89018
$-899
Cash flow
-11.0%
Cash-on-Cash Return
3.1%
Cap rate
0.5%
Rent to Value Ratio

Active
$479,990
3
bds
|
3
ba
|
1,625
sqft
|
built
2023
9934 Iron Creek Ave, Las Vegas, NV 89178
$-1,284
Cash flow
-14.0%
Cash-on-Cash Return
2.5%
Cap rate
0.4%
Rent to Value Ratio
Active
$425,000
3
bds
|
3
ba
|
1,266
sqft
|
built
2006
552 Brompton St, Las Vegas, NV 89178
$-910
Cash flow
-11.2%
Cash-on-Cash Return
3.1%
Cap rate
0.4%
Rent to Value Ratio

Active
$1,450,000
4
bds
|
4
ba
|
3,646
sqft
|
built
2017
6110 Pebble Glen Ct, Las Vegas, NV 89149
$-3,778
Cash flow
-13.6%
Cash-on-Cash Return
2.6%
Cap rate
0.4%
Rent to Value Ratio
Active
$684,900
6
bds
|
4
ba
|
3,093
sqft
|
built
1994
7736 Foredawn Dr, Las Vegas, NV 89123
$-1,345
Cash flow
-10.2%
Cash-on-Cash Return
3.3%
Cap rate
0.5%
Rent to Value Ratio
Active
$1,499,000
4
bds
|
5
ba
|
4,250
sqft
|
built
2019
11944 Dolcemente Ln, Las Vegas, NV 89138
$-4,190
Cash flow
-14.6%
Cash-on-Cash Return
2.3%
Cap rate
0.4%
Rent to Value Ratio