Clark County Investment Properties for Sale
Browse homes for sale and investment properties in Clark County. Refine your search by price, property type, or more.
Best cash flowing properties in Clark County
Active
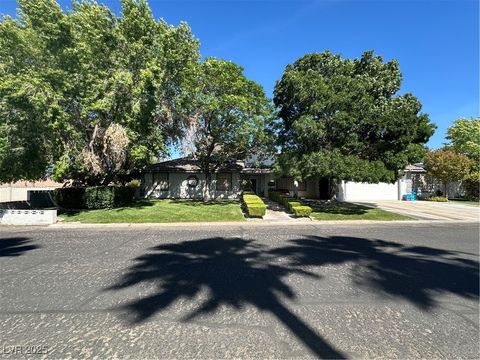
$420,000
4
bds
|
2
ba
|
2,121
sqft
|
built
1975
1009 Greenbank St, Las Vegas, NV 89110
$-489
Cash flow
-6.1%
Cash-on-Cash Return
4.3%
Cap rate
0.5%
Rent to Value Ratio
Active
$195,000
1
bds
|
1
ba
|
756
sqft
|
built
1988
213 N Lamb Blvd, Las Vegas, NV 89110
$-532
Cash flow
-14.2%
Cash-on-Cash Return
2.4%
Cap rate
0.5%
Rent to Value Ratio
5,941 out of 6,144 properties for sale in Clark County
Limited Results Shown
Create a free account, or log in to reveal all property listings and enjoy the complete experience.
Active
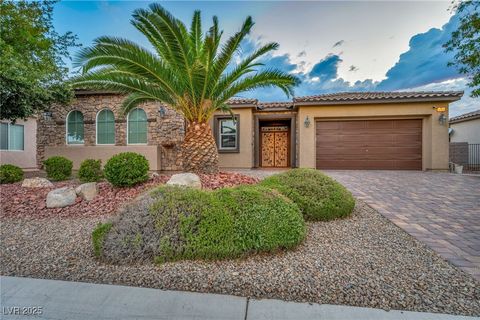
$865,000
5
bds
|
4
ba
|
4,340
sqft
|
built
2011
9669 Black Coyote Ct, Las Vegas, NV 89139
$-2,141
Cash flow
-12.9%
Cash-on-Cash Return
2.7%
Cap rate
0.4%
Rent to Value Ratio
Active
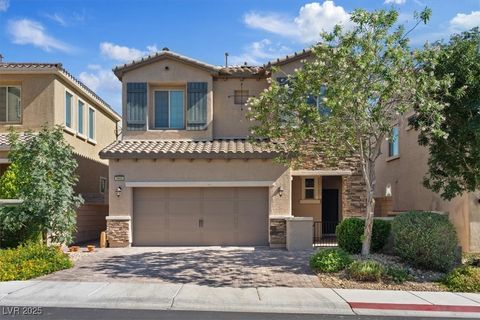
$279,999
2
bds
|
2
ba
|
959
sqft
|
built
1995
7400 W Flamingo Rd, Las Vegas, NV 89147
$-673
Cash flow
-12.5%
Cash-on-Cash Return
2.8%
Cap rate
0.5%
Rent to Value Ratio
Active
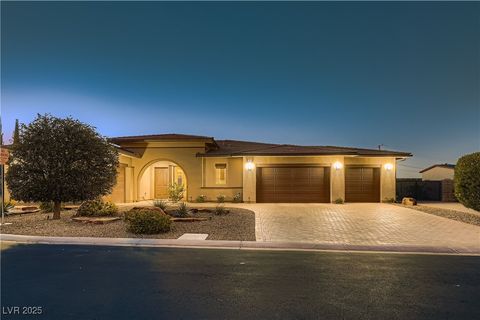
$499,999
3
bds
|
2
ba
|
1,824
sqft
|
built
2007
7558 Schuders Ave, Las Vegas, NV 89178
$-1,264
Cash flow
-13.2%
Cash-on-Cash Return
2.6%
Cap rate
0.4%
Rent to Value Ratio
Active
$490,000
5
bds
|
3
ba
|
1,967
sqft
|
built
2009
11428 Belmont Lake Dr, Las Vegas, NV 89135
$-1,013
Cash flow
-10.8%
Cash-on-Cash Return
3.2%
Cap rate
0.5%
Rent to Value Ratio
Active
$765,650
4
bds
|
3
ba
|
2,619
sqft
|
built
2009
6614 Collingsworth St, Las Vegas, NV 89131
$-1,792
Cash flow
-12.2%
Cash-on-Cash Return
2.9%
Cap rate
0.4%
Rent to Value Ratio
Active
$949,990
4
bds
|
5
ba
|
3,752
sqft
|
built
2005
5111 Crown Cypress St, Las Vegas, NV 89149
$-2,495
Cash flow
-13.7%
Cash-on-Cash Return
2.5%
Cap rate
0.4%
Rent to Value Ratio
Active
$975,000
6
bds
|
4
ba
|
3,822
sqft
|
built
1992
8355 Florine Ave, Las Vegas, NV 89129
$-2,257
Cash flow
-12.1%
Cash-on-Cash Return
2.9%
Cap rate
0.4%
Rent to Value Ratio
Active
$775,000
3
bds
|
3
ba
|
2,879
sqft
|
built
2012
8705 Lavender Ridge St, Las Vegas, NV 89131
$-2,152
Cash flow
-14.5%
Cash-on-Cash Return
2.3%
Cap rate
0.4%
Rent to Value Ratio
Active
$499,900
3
bds
|
3
ba
|
1,733
sqft
|
built
2017
9668 Canyon Landing Ave, Las Vegas, NV 89166
$-1,391
Cash flow
-14.5%
Cash-on-Cash Return
2.3%
Cap rate
0.4%
Rent to Value Ratio
Active
$1,575,000
3
bds
|
3
ba
|
3,088
sqft
|
built
2016
7876 Wheeler Creek Ct, Las Vegas, NV 89113
$-3,410
Cash flow
-11.3%
Cash-on-Cash Return
3.1%
Cap rate
0.4%
Rent to Value Ratio
Active
$720,000
4
bds
|
4
ba
|
3,111
sqft
|
built
2016
6161 Andover Wood Rd, Las Vegas, NV 89113
$-1,606
Cash flow
-11.6%
Cash-on-Cash Return
3.0%
Cap rate
0.5%
Rent to Value Ratio
Active
$420,000
3
bds
|
3
ba
|
1,707
sqft
|
built
2012
7558 Crooked Branch St, Las Vegas, NV 89143
$-755
Cash flow
-9.4%
Cash-on-Cash Return
3.5%
Cap rate
0.5%
Rent to Value Ratio
Active
$739,999
4
bds
|
3
ba
|
2,581
sqft
|
built
2010
7461 Suzanne Elaine Ct, Las Vegas, NV 89131
$-1,708
Cash flow
-12.0%
Cash-on-Cash Return
2.9%
Cap rate
0.4%
Rent to Value Ratio
Active
$824,000
4
bds
|
4
ba
|
3,015
sqft
|
built
2002
10616 Eagle Nest St, Las Vegas, NV 89141
$-1,610
Cash flow
-10.2%
Cash-on-Cash Return
3.3%
Cap rate
0.5%
Rent to Value Ratio
Active
$544,900
4
bds
|
3
ba
|
2,518
sqft
|
built
2014
10668 Berkshire Woods Ave, Las Vegas, NV 89166
$-1,055
Cash flow
-10.1%
Cash-on-Cash Return
3.4%
Cap rate
0.5%
Rent to Value Ratio
Active
$909,900
3
bds
|
3
ba
|
3,289
sqft
|
built
2001
7651 Man O War St, Las Vegas, NV 89131
$-1,401
Cash flow
-8.0%
Cash-on-Cash Return
3.8%
Cap rate
0.6%
Rent to Value Ratio
Active
$727,000
3
bds
|
3
ba
|
2,480
sqft
|
built
2005
520 Ivy Spring St, Las Vegas, NV 89138
$-1,446
Cash flow
-10.4%
Cash-on-Cash Return
3.3%
Cap rate
0.5%
Rent to Value Ratio
Active
$730,000
4
bds
|
3
ba
|
3,231
sqft
|
built
2012
7426 Olmstead St, Las Vegas, NV 89166
$-1,989
Cash flow
-14.2%
Cash-on-Cash Return
2.4%
Cap rate
0.4%
Rent to Value Ratio
Active
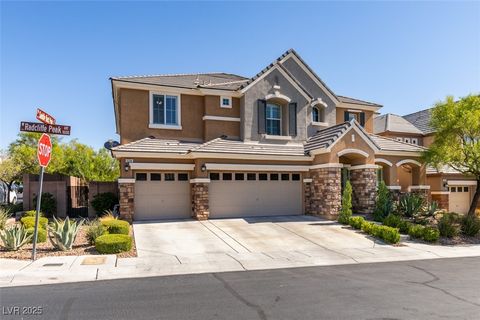
$725,000
5
bds
|
3
ba
|
3,496
sqft
|
built
2010
10244 Radcliffe Peak Ave, Las Vegas, NV 89166
$-1,484
Cash flow
-10.7%
Cash-on-Cash Return
3.2%
Cap rate
0.5%
Rent to Value Ratio
Active
$585,000
3
bds
|
3
ba
|
2,459
sqft
|
built
2004
10978 Dornoch Castle St, Las Vegas, NV 89141
$-1,476
Cash flow
-13.2%
Cash-on-Cash Return
2.7%
Cap rate
0.4%
Rent to Value Ratio
Active
$1,380,000
4
bds
|
4
ba
|
4,347
sqft
|
built
2006
8465 Picket Ridge Ct, Las Vegas, NV 89143
$-4,487
Cash flow
-17.0%
Cash-on-Cash Return
1.8%
Cap rate
0.3%
Rent to Value Ratio
Active
$450,000
3
bds
|
2
ba
|
1,461
sqft
|
built
1999
9921 Rose Charmont St, Las Vegas, NV 89183
$-939
Cash flow
-10.9%
Cash-on-Cash Return
3.2%
Cap rate
0.4%
Rent to Value Ratio
Active
$700,000
5
bds
|
3
ba
|
3,748
sqft
|
built
2004
9380 Arrowhead Bluff Ave, Las Vegas, NV 89149
$-1,384
Cash flow
-10.3%
Cash-on-Cash Return
3.3%
Cap rate
0.5%
Rent to Value Ratio
Active
$525,000
3
bds
|
3
ba
|
1,616
sqft
|
built
2011
1787 Solvang Mill Dr, Las Vegas, NV 89135
$-889
Cash flow
-8.8%
Cash-on-Cash Return
3.6%
Cap rate
0.5%
Rent to Value Ratio
Active
$350,000
3
bds
|
2
ba
|
1,348
sqft
|
built
2003
4971 Droubay Dr, Las Vegas, NV 89122
$-651
Cash flow
-9.7%
Cash-on-Cash Return
3.4%
Cap rate
0.5%
Rent to Value Ratio
Active
$589,000
3
bds
|
2
ba
|
1,756
sqft
|
built
1970
3551 E Rochelle Ave, Las Vegas, NV 89121
$-1,324
Cash flow
-11.7%
Cash-on-Cash Return
3.0%
Cap rate
0.4%
Rent to Value Ratio
Active
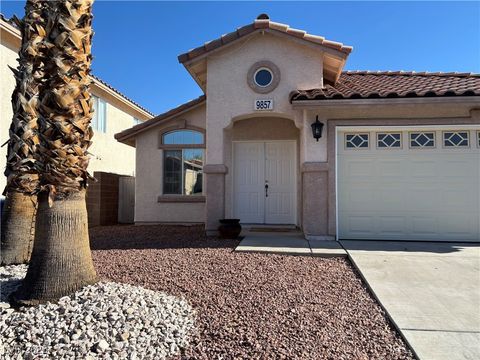
$469,990
3
bds
|
2
ba
|
1,582
sqft
|
built
1995
9857 Pioneer Ave, Las Vegas, NV 89117
$-988
Cash flow
-11.0%
Cash-on-Cash Return
3.2%
Cap rate
0.4%
Rent to Value Ratio
Active
$2,800,000
5
bds
|
4
ba
|
4,107
sqft
|
built
2005
2006 Country Cove Ct, Las Vegas, NV 89135
$-8,112
Cash flow
-15.1%
Cash-on-Cash Return
2.2%
Cap rate
0.3%
Rent to Value Ratio
Active
$330,000
3
bds
|
2
ba
|
1,198
sqft
|
built
1998
5155 Briar Patch Way, Las Vegas, NV 89118
$-649
Cash flow
-10.3%
Cash-on-Cash Return
3.3%
Cap rate
0.5%
Rent to Value Ratio
Active
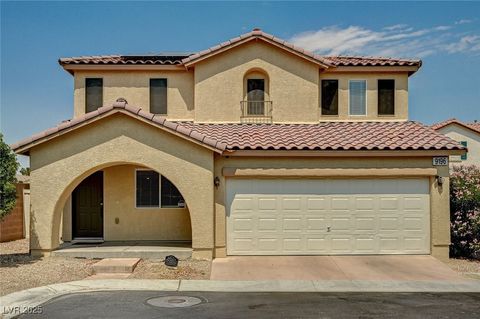
$385,000
3
bds
|
3
ba
|
1,476
sqft
|
built
2004
9196 Starling Wing Pl, Las Vegas, NV 89143
$-779
Cash flow
-10.6%
Cash-on-Cash Return
3.3%
Cap rate
0.5%
Rent to Value Ratio
Active
$530,000
3
bds
|
3
ba
|
1,727
sqft
|
built
2000
1613 Changing Seasons St, Las Vegas, NV 89144
$-1,282
Cash flow
-12.6%
Cash-on-Cash Return
2.8%
Cap rate
0.4%
Rent to Value Ratio
Active
$449,000
3
bds
|
3
ba
|
1,568
sqft
|
built
2007
10320 Bluff Valley Ct, Las Vegas, NV 89178
$-1,030
Cash flow
-12.0%
Cash-on-Cash Return
2.9%
Cap rate
0.4%
Rent to Value Ratio
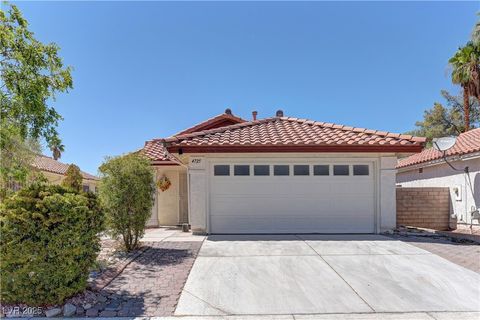
Active
$450,000
3
bds
|
2
ba
|
1,452
sqft
|
built
1988
4725 Cosley Dr, Las Vegas, NV 89147
$-934
Cash flow
-10.8%
Cash-on-Cash Return
3.2%
Cap rate
0.4%
Rent to Value Ratio
Active
$1,950,000
4
bds
|
5
ba
|
3,601
sqft
|
built
2000
2620 Grassy Spring Pl, Las Vegas, NV 89135
$-5,414
Cash flow
-14.5%
Cash-on-Cash Return
2.3%
Cap rate
0.4%
Rent to Value Ratio
Active
$335,000
2
bds
|
2
ba
|
1,100
sqft
|
built
1998
1500 Cardinal Peak Ln, Las Vegas, NV 89144
$-863
Cash flow
-13.4%
Cash-on-Cash Return
2.6%
Cap rate
0.5%
Rent to Value Ratio
Active
$1,279,000
3
bds
|
3
ba
|
2,042
sqft
|
built
2006
9220 Tesoras Dr, Las Vegas, NV 89144
$-4,263
Cash flow
-17.4%
Cash-on-Cash Return
1.7%
Cap rate
0.4%
Rent to Value Ratio
Active
$275,000
2
bds
|
2
ba
|
1,155
sqft
|
built
2005
19 E Agate Ave, Las Vegas, NV 89123
$-727
Cash flow
-13.8%
Cash-on-Cash Return
2.5%
Cap rate
0.6%
Rent to Value Ratio
Active
$465,000
3
bds
|
3
ba
|
1,665
sqft
|
built
2014
3766 Odessa Falls Ave, Las Vegas, NV 89141
$-1,188
Cash flow
-13.3%
Cash-on-Cash Return
2.6%
Cap rate
0.4%
Rent to Value Ratio