Clark County Investment Properties for Sale
Browse homes for sale and investment properties in Clark County. Refine your search by price, property type, or more.
Best cash flowing properties in Clark County
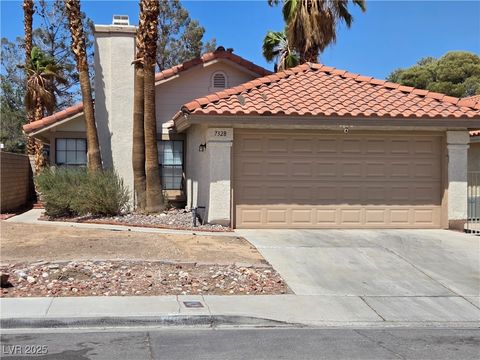
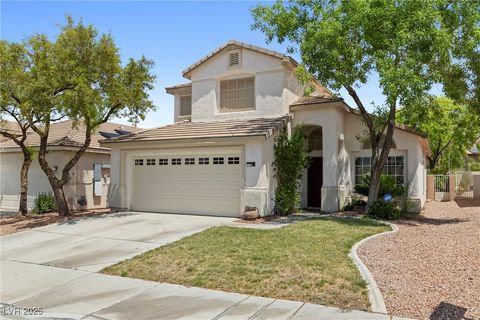
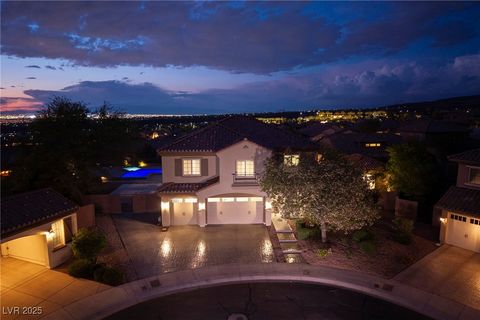
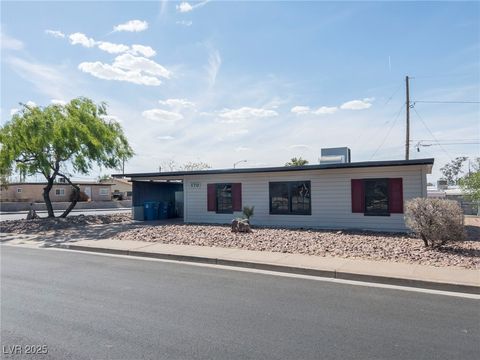
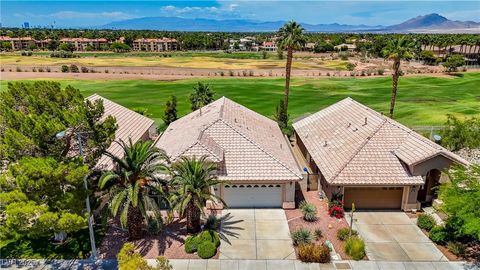
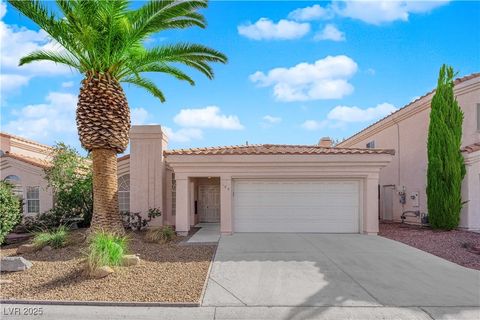
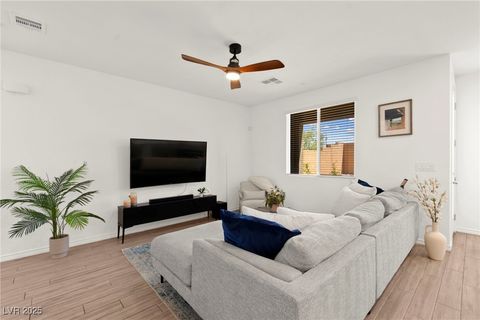
Active
$385,000
2
bds
|
2
ba
|
1,050
sqft
|
built
1987
7328 Coffeyville Ave, Las Vegas, NV 89147
$216
Cash flow
2.9%
Cash-on-Cash Return
6.4%
Cap rate
0.8%
Rent to Value Ratio
Active
$148,000
1
bds
|
1
ba
|
462
sqft
|
built
1986
460 Elm Dr, Las Vegas, NV 89169
$-225
Cash flow
-7.9%
Cash-on-Cash Return
3.9%
Cap rate
0.7%
Rent to Value Ratio
6,536 out of 6,758 properties for sale in Clark County
Limited Results Shown
Create a free account, or log in to reveal all property listings and enjoy the complete experience.

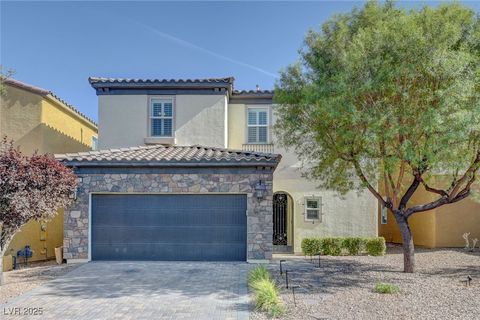
Active
$575,000
5
bds
|
3
ba
|
2,466
sqft
|
built
2021
4274 Tarim St, Las Vegas, NV 89147
$-1,487
Cash flow
-13.5%
Cash-on-Cash Return
2.6%
Cap rate
0.4%
Rent to Value Ratio
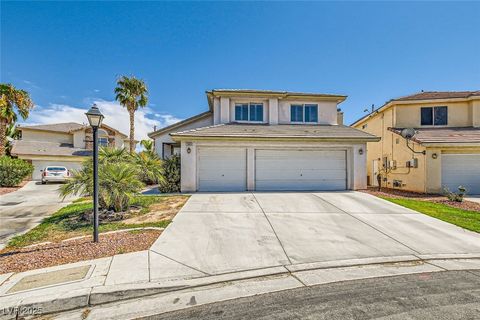
Active
$519,000
3
bds
|
3
ba
|
1,883
sqft
|
built
1986
9021 Feather River Ct, Las Vegas, NV 89117
$-1,157
Cash flow
-11.6%
Cash-on-Cash Return
3.0%
Cap rate
0.4%
Rent to Value Ratio
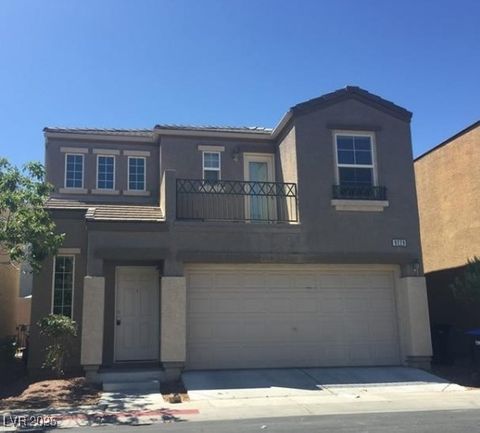
Active
$1,750,000
6
bds
|
5
ba
|
5,883
sqft
|
built
2000
1016 Sable Mist Ct, Las Vegas, NV 89144
$-6,597
Cash flow
-19.7%
Cash-on-Cash Return
1.2%
Cap rate
0.2%
Rent to Value Ratio
Active
$515,000
4
bds
|
3
ba
|
1,812
sqft
|
built
2001
981 Leadville Meadows Dr, Henderson, NV 89052
$-1,090
Cash flow
-11.0%
Cash-on-Cash Return
3.1%
Cap rate
0.4%
Rent to Value Ratio
Active
$325,000
3
bds
|
1
ba
|
898
sqft
|
built
1955
604 N Minnesota St, Las Vegas, NV 89107
$-540
Cash flow
-8.7%
Cash-on-Cash Return
3.7%
Cap rate
0.5%
Rent to Value Ratio
Active
$810,000
2
bds
|
3
ba
|
2,190
sqft
|
built
1989
8460 Carmel Ridge Ct, Las Vegas, NV 89113
$-2,932
Cash flow
-18.9%
Cash-on-Cash Return
1.3%
Cap rate
0.4%
Rent to Value Ratio
Active
$2,150,000
6
bds
|
6
ba
|
7,259
sqft
|
built
1998
2086 Troon Dr, Henderson, NV 89074
$-6,149
Cash flow
-14.9%
Cash-on-Cash Return
2.2%
Cap rate
0.4%
Rent to Value Ratio
Active
$1,495,000
7
bds
|
6
ba
|
4,077
sqft
|
built
2008
2900 Valvent Ct, Henderson, NV 89044
$-3,619
Cash flow
-12.6%
Cash-on-Cash Return
2.8%
Cap rate
0.4%
Rent to Value Ratio
Active
$499,900
3
bds
|
2
ba
|
1,635
sqft
|
built
2003
169 Pioneer Peak Pl, Las Vegas, NV 89138
$-1,272
Cash flow
-13.3%
Cash-on-Cash Return
2.6%
Cap rate
0.5%
Rent to Value Ratio

Active
$1,200,000
4
bds
|
4
ba
|
4,372
sqft
|
built
2013
6373 Bridal Cave Ave, Las Vegas, NV 89131
$-3,231
Cash flow
-14.0%
Cash-on-Cash Return
2.4%
Cap rate
0.4%
Rent to Value Ratio

Active
$570,000
4
bds
|
3
ba
|
2,310
sqft
|
built
2005
9772 Splendor Sky Ave, Las Vegas, NV 89148
$-1,170
Cash flow
-10.7%
Cash-on-Cash Return
3.2%
Cap rate
0.4%
Rent to Value Ratio
Active
$379,999
3
bds
|
3
ba
|
1,503
sqft
|
built
1983
4612 Supreme Ct, Las Vegas, NV 89110
$-577
Cash flow
-7.9%
Cash-on-Cash Return
3.9%
Cap rate
0.5%
Rent to Value Ratio
Active
$335,000
2
bds
|
2
ba
|
1,080
sqft
|
built
1994
6370 Canyon Vista Ct, Las Vegas, NV 89156
$-495
Cash flow
-7.7%
Cash-on-Cash Return
3.9%
Cap rate
0.5%
Rent to Value Ratio
Active
$329,900
3
bds
|
1
ba
|
1,034
sqft
|
built
1942
170 Copper St, Henderson, NV 89015
$-422
Cash flow
-6.7%
Cash-on-Cash Return
4.1%
Cap rate
0.5%
Rent to Value Ratio

Active
$4,995,000
4
bds
|
5
ba
|
8,081
sqft
|
built
2000
942 Villa Grande Way, Boulder City, NV 89005
$-23,269
Cash flow
-24.3%
Cash-on-Cash Return
0.1%
Cap rate
0.1%
Rent to Value Ratio
Active
$445,000
5
bds
|
3
ba
|
2,384
sqft
|
built
2007
5651 Bettors Luck Ct, Las Vegas, NV 89122
$-807
Cash flow
-9.5%
Cash-on-Cash Return
3.5%
Cap rate
0.5%
Rent to Value Ratio
Active
$1,675,000
6
bds
|
6
ba
|
5,325
sqft
|
built
2006
3910 W Pebble Rd, Las Vegas, NV 89139
$-5,046
Cash flow
-15.7%
Cash-on-Cash Return
2.1%
Cap rate
0.3%
Rent to Value Ratio
Active
$140,000
1
bds
|
1
ba
|
675
sqft
|
built
1996
1830 N Pecos Rd, Las Vegas, NV 89115
$-270
Cash flow
-10.1%
Cash-on-Cash Return
3.4%
Cap rate
0.7%
Rent to Value Ratio
Active
$520,000
3
bds
|
2
ba
|
1,692
sqft
|
built
1996
2149 Eaglepath Cir, Henderson, NV 89074
$-1,305
Cash flow
-13.1%
Cash-on-Cash Return
2.7%
Cap rate
0.4%
Rent to Value Ratio
Active
$525,000
3
bds
|
3
ba
|
2,003
sqft
|
built
2013
599 Wounded Star Ave, Las Vegas, NV 89178
$-1,140
Cash flow
-11.3%
Cash-on-Cash Return
3.1%
Cap rate
0.5%
Rent to Value Ratio
Active
$589,990
5
bds
|
3
ba
|
2,674
sqft
|
built
2001
2635 Regency Cove Ct, Las Vegas, NV 89121
$-1,209
Cash flow
-10.7%
Cash-on-Cash Return
3.2%
Cap rate
0.5%
Rent to Value Ratio
Active
$399,900
3
bds
|
3
ba
|
1,421
sqft
|
built
2005
9229 Millikan Ave, Las Vegas, NV 89148
$-737
Cash flow
-9.6%
Cash-on-Cash Return
3.5%
Cap rate
0.5%
Rent to Value Ratio
Active
$389,900
2
bds
|
2
ba
|
1,334
sqft
|
built
1993
104 Hutton Ln, Las Vegas, NV 89145
$-814
Cash flow
-10.9%
Cash-on-Cash Return
3.2%
Cap rate
0.5%
Rent to Value Ratio
Active
$539,900
3
bds
|
3
ba
|
1,529
sqft
|
built
1998
9801 Bradford Summit St, Las Vegas, NV 89183
$-1,225
Cash flow
-11.8%
Cash-on-Cash Return
3.0%
Cap rate
0.4%
Rent to Value Ratio
Active
$509,900
5
bds
|
3
ba
|
2,381
sqft
|
built
2000
7612 Certitude Ave, Las Vegas, NV 89131
$-1,178
Cash flow
-12.1%
Cash-on-Cash Return
2.9%
Cap rate
0.4%
Rent to Value Ratio
Active
$349,999
2
bds
|
2
ba
|
1,294
sqft
|
built
2004
104 Masserta Ct, Las Vegas, NV 89183
$-464
Cash flow
-6.9%
Cash-on-Cash Return
4.1%
Cap rate
0.6%
Rent to Value Ratio
Active
$375,000
3
bds
|
4
ba
|
1,689
sqft
|
built
2007
10067 Sand Key St, Las Vegas, NV 89178
$-902
Cash flow
-12.5%
Cash-on-Cash Return
2.8%
Cap rate
0.5%
Rent to Value Ratio
Active
$284,500
2
bds
|
3
ba
|
1,320
sqft
|
built
1969
747 Greenbriar Townhouse Way, Las Vegas, NV 89121
$-461
Cash flow
-8.5%
Cash-on-Cash Return
3.7%
Cap rate
0.6%
Rent to Value Ratio
Active
$990,000
5
bds
|
3
ba
|
4,449
sqft
|
built
2007
8431 Jeremiah Grove St, Las Vegas, NV 89123
$-2,821
Cash flow
-14.9%
Cash-on-Cash Return
2.3%
Cap rate
0.4%
Rent to Value Ratio
Active
$1,100,000
4
bds
|
5
ba
|
3,369
sqft
|
built
2009
2800 Proust Ct, Henderson, NV 89044
$-3,329
Cash flow
-15.8%
Cash-on-Cash Return
2.0%
Cap rate
0.4%
Rent to Value Ratio
Active
$474,900
3
bds
|
3
ba
|
1,623
sqft
|
built
2022
9743 Mojave Mountain St, Las Vegas, NV 89166
$-1,268
Cash flow
-13.9%
Cash-on-Cash Return
2.5%
Cap rate
0.5%
Rent to Value Ratio
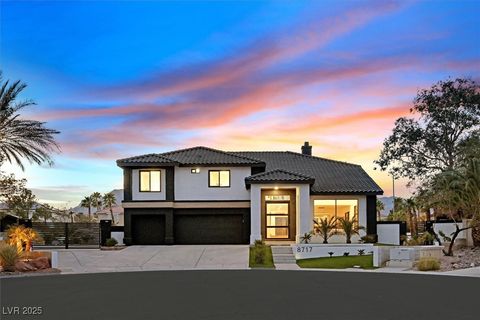
Active
$2,100,000
6
bds
|
5
ba
|
4,946
sqft
|
built
2000
8717 Kingship Ct, Las Vegas, NV 89129
$-7,851
Cash flow
-19.5%
Cash-on-Cash Return
1.2%
Cap rate
0.2%
Rent to Value Ratio
Active
$169,950
1
bds
|
1
ba
|
774
sqft
|
built
2001
5655 E Sahara Ave, Las Vegas, NV 89142
$-297
Cash flow
-9.1%
Cash-on-Cash Return
3.6%
Cap rate
0.8%
Rent to Value Ratio
Active
$749,000
3
bds
|
3
ba
|
3,161
sqft
|
built
1995
7968 Marbella Cir, Las Vegas, NV 89128
$-1,863
Cash flow
-13.0%
Cash-on-Cash Return
2.7%
Cap rate
0.4%
Rent to Value Ratio
Active
$1,399,000
4
bds
|
5
ba
|
3,792
sqft
|
built
2003
2846 Barrow Downs St, Las Vegas, NV 89135
$-4,655
Cash flow
-17.4%
Cash-on-Cash Return
1.7%
Cap rate
0.3%
Rent to Value Ratio
Active
$480,000
4
bds
|
3
ba
|
1,638
sqft
|
built
1981
4121 Satinwood Dr, Las Vegas, NV 89147
$-639
Cash flow
-6.9%
Cash-on-Cash Return
4.1%
Cap rate
0.5%
Rent to Value Ratio
Active
$258,000
3
bds
|
2
ba
|
1,109
sqft
|
built
1989
3151 Soaring Gulls Dr, Las Vegas, NV 89128
$-602
Cash flow
-12.2%
Cash-on-Cash Return
2.9%
Cap rate
0.6%
Rent to Value Ratio
Active
$679,000
5
bds
|
4
ba
|
2,846
sqft
|
built
2006
10373 Hawk Ravine St, Las Vegas, NV 89178
$-1,492
Cash flow
-11.5%
Cash-on-Cash Return
3.0%
Cap rate
0.5%
Rent to Value Ratio