Clark County Investment Properties for Sale
Browse homes for sale and investment properties in Clark County. Refine your search by price, property type, or more.
Best cash flowing properties in Clark County
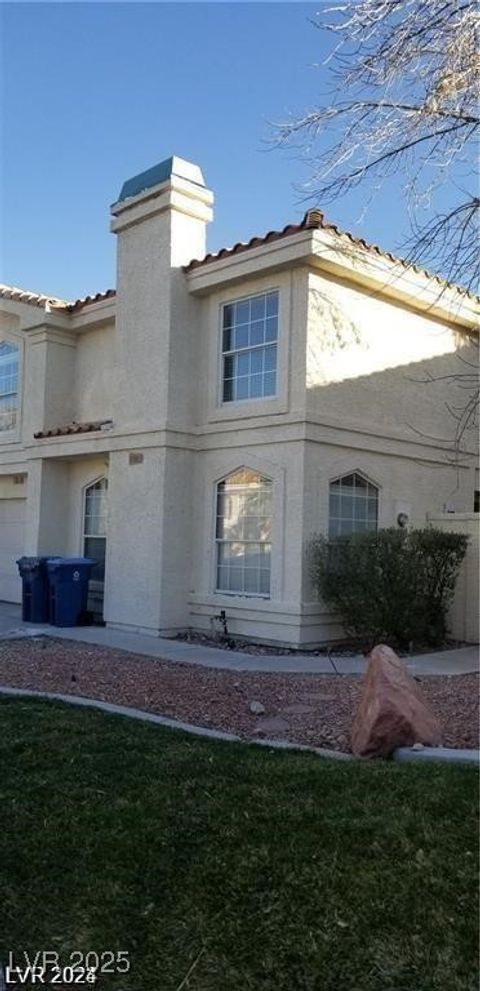
Active
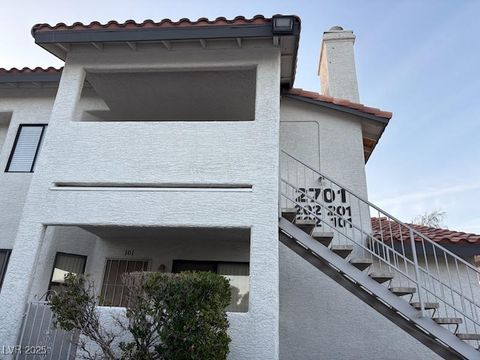
$249,888
2
bds
|
2
ba
|
1,136
sqft
|
built
1987
2701 Beaver Creek Ct, Las Vegas, NV 89117
$24
Cash flow
0.5%
Cash-on-Cash Return
5.8%
Cap rate
0.9%
Rent to Value Ratio
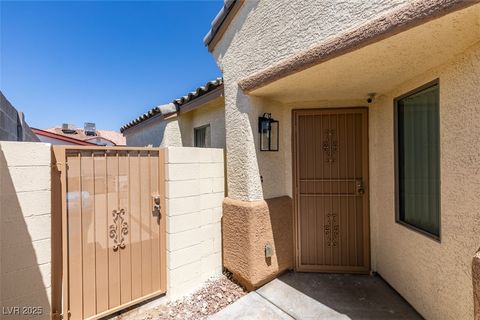
Active
$135,000
1
bds
|
1
ba
|
607
sqft
|
built
1989
3135 S Mojave Rd, Las Vegas, NV 89121
$-382
Cash flow
-14.8%
Cash-on-Cash Return
2.3%
Cap rate
0.8%
Rent to Value Ratio
5,398 out of 5,578 properties for sale in Clark County
Limited Results Shown
Create a free account, or log in to reveal all property listings and enjoy the complete experience.
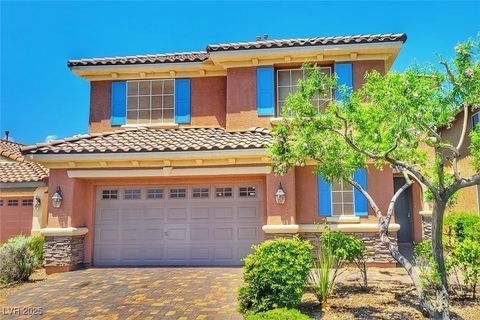
Active
$275,000
3
bds
|
2
ba
|
1,134
sqft
|
built
1997
7885 W Flamingo Rd, Las Vegas, NV 89147
$-483
Cash flow
-9.2%
Cash-on-Cash Return
3.6%
Cap rate
0.7%
Rent to Value Ratio
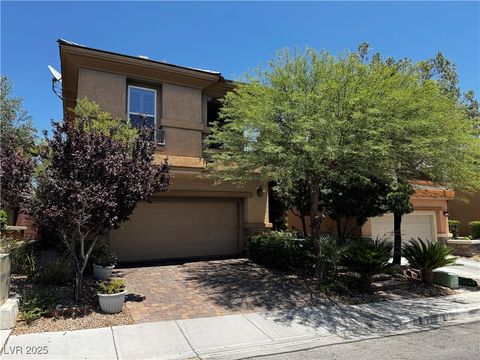
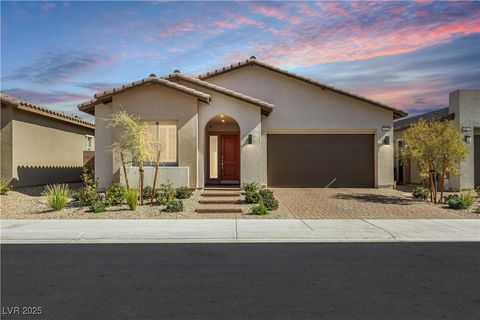
Active
$1,050,000
3
bds
|
3
ba
|
3,104
sqft
|
built
2017
5801 Exbury Gardens Ct, Las Vegas, NV 89118
$-3,094
Cash flow
-15.4%
Cash-on-Cash Return
2.1%
Cap rate
0.3%
Rent to Value Ratio
Active
$698,990
4
bds
|
3
ba
|
2,543
sqft
|
built
2007
10526 Harvest Wind Dr, Las Vegas, NV 89135
$-1,501
Cash flow
-11.2%
Cash-on-Cash Return
3.1%
Cap rate
0.4%
Rent to Value Ratio
Active
$644,900
4
bds
|
3
ba
|
2,153
sqft
|
built
2022
10968 Tracy Stevens Ave, Las Vegas, NV 89166
$-1,775
Cash flow
-14.4%
Cash-on-Cash Return
2.4%
Cap rate
0.4%
Rent to Value Ratio
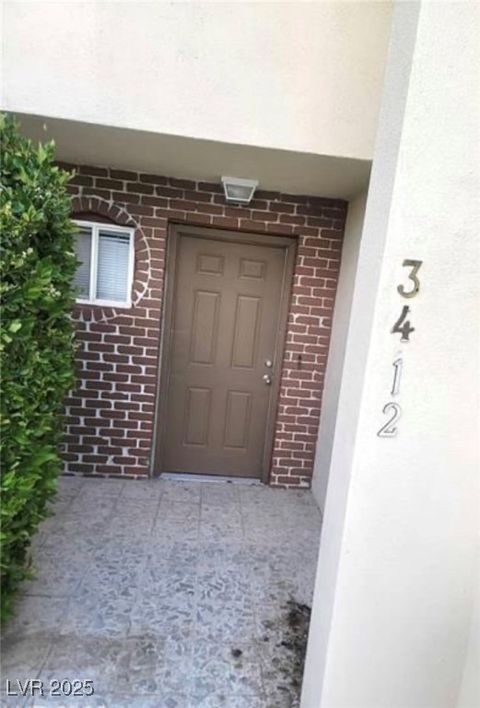
Active
$409,900
3
bds
|
3
ba
|
2,060
sqft
|
built
1972
3412 Townhouse Dr, Las Vegas, NV 89121
$-1,176
Cash flow
-15.0%
Cash-on-Cash Return
2.2%
Cap rate
0.3%
Rent to Value Ratio
Active
$499,900
3
bds
|
2
ba
|
1,602
sqft
|
built
2003
7667 Borealis St, Las Vegas, NV 89123
$-1,341
Cash flow
-14.0%
Cash-on-Cash Return
2.5%
Cap rate
0.4%
Rent to Value Ratio
Active
$764,900
4
bds
|
3
ba
|
2,895
sqft
|
built
1998
1780 Crystal Stream Ave, Henderson, NV 89012
$-1,889
Cash flow
-12.9%
Cash-on-Cash Return
2.7%
Cap rate
0.4%
Rent to Value Ratio
Active
$550,000
4
bds
|
3
ba
|
2,198
sqft
|
built
1992
2245 Juniper Berry Dr, Las Vegas, NV 89134
$-948
Cash flow
-9.0%
Cash-on-Cash Return
3.6%
Cap rate
0.5%
Rent to Value Ratio
Active
$1,350,000
4
bds
|
5
ba
|
2,879
sqft
|
built
2021
12295 Skyracer Dr, Las Vegas, NV 89138
$-2,556
Cash flow
-9.9%
Cash-on-Cash Return
3.4%
Cap rate
0.5%
Rent to Value Ratio
Active
$349,900
3
bds
|
2
ba
|
1,265
sqft
|
built
1998
1608 Sussex St, Las Vegas, NV 89144
$-863
Cash flow
-12.9%
Cash-on-Cash Return
2.7%
Cap rate
0.5%
Rent to Value Ratio
Active
$429,900
3
bds
|
3
ba
|
1,523
sqft
|
built
1996
7963 Laurena Ave, Las Vegas, NV 89147
$-1,144
Cash flow
-13.9%
Cash-on-Cash Return
2.5%
Cap rate
0.4%
Rent to Value Ratio
Active
$370,000
3
bds
|
2
ba
|
1,333
sqft
|
built
2005
1905 Eskam St, Las Vegas, NV 89156
$-657
Cash flow
-9.3%
Cash-on-Cash Return
3.5%
Cap rate
0.5%
Rent to Value Ratio
Active
$549,900
5
bds
|
3
ba
|
2,661
sqft
|
built
2007
10279 Montes Vascos Dr, Las Vegas, NV 89178
$-947
Cash flow
-9.0%
Cash-on-Cash Return
3.6%
Cap rate
0.5%
Rent to Value Ratio
Active
$995,000
4
bds
|
4
ba
|
2,386
sqft
|
built
2022
144 Sarabeth St, Las Vegas, NV 89138
$-2,988
Cash flow
-15.7%
Cash-on-Cash Return
2.1%
Cap rate
0.4%
Rent to Value Ratio
Active
$569,900
2
bds
|
3
ba
|
1,752
sqft
|
built
1987
6902 Emerald Springs Ln, Las Vegas, NV 89113
$-2,147
Cash flow
-19.7%
Cash-on-Cash Return
1.2%
Cap rate
0.4%
Rent to Value Ratio
Active
$572,000
4
bds
|
3
ba
|
2,406
sqft
|
built
2024
330 Spring Dove Ave, Henderson, NV 89011
$-1,421
Cash flow
-13.0%
Cash-on-Cash Return
2.7%
Cap rate
0.4%
Rent to Value Ratio
Active
$1,399,474
4
bds
|
4
ba
|
4,056
sqft
|
built
2014
6208 W Rome Blvd, Las Vegas, NV 89131
$-2,866
Cash flow
-10.7%
Cash-on-Cash Return
3.2%
Cap rate
0.5%
Rent to Value Ratio
Active
$788,000
5
bds
|
4
ba
|
2,728
sqft
|
built
2003
10015 Wonderful Day Dr, Las Vegas, NV 89148
$-2,092
Cash flow
-13.9%
Cash-on-Cash Return
2.5%
Cap rate
0.4%
Rent to Value Ratio
Active
$410,000
3
bds
|
3
ba
|
1,777
sqft
|
built
2021
1819 Wild Grain Ave, North Las Vegas, NV 89086
$-860
Cash flow
-10.9%
Cash-on-Cash Return
3.2%
Cap rate
0.5%
Rent to Value Ratio
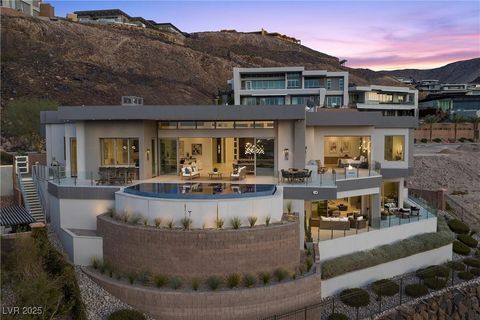
Active
$6,975,000
4
bds
|
6
ba
|
6,100
sqft
|
built
2019
629 Majestic Rim Dr, Henderson, NV 89012
$-32,105
Cash flow
-24.0%
Cash-on-Cash Return
0.2%
Cap rate
0.1%
Rent to Value Ratio
Active
$574,900
3
bds
|
3
ba
|
2,043
sqft
|
built
2016
835 Via Serenelia, Henderson, NV 89011
$-1,301
Cash flow
-11.8%
Cash-on-Cash Return
3.0%
Cap rate
0.5%
Rent to Value Ratio
Active
$600,000
4
bds
|
3
ba
|
2,027
sqft
|
built
1979
5905 Paseo Montana, Las Vegas, NV 89108
$-1,124
Cash flow
-9.8%
Cash-on-Cash Return
3.4%
Cap rate
0.5%
Rent to Value Ratio
Active
$395,000
4
bds
|
3
ba
|
1,470
sqft
|
built
2022
1611 Prairie Fields Ct, Las Vegas, NV 89115
$-900
Cash flow
-11.9%
Cash-on-Cash Return
2.9%
Cap rate
0.5%
Rent to Value Ratio
Active
$439,900
3
bds
|
3
ba
|
1,873
sqft
|
built
2023
242 White Crest Peak Ave, Henderson, NV 89015
$-1,014
Cash flow
-12.0%
Cash-on-Cash Return
2.9%
Cap rate
0.5%
Rent to Value Ratio
Active
$1,249,500
3
bds
|
3
ba
|
2,503
sqft
|
built
2023
313 Jackalberry St, Las Vegas, NV 89138
$-3,935
Cash flow
-16.4%
Cash-on-Cash Return
1.9%
Cap rate
0.3%
Rent to Value Ratio
Active
$1,395,000
5
bds
|
4
ba
|
2,759
sqft
|
built
2023
379 Malpaso St, Las Vegas, NV 89138
$-4,476
Cash flow
-16.7%
Cash-on-Cash Return
1.8%
Cap rate
0.3%
Rent to Value Ratio
Active
$345,000
3
bds
|
2
ba
|
1,404
sqft
|
built
2022
4229 Venus Falls Ave, North Las Vegas, NV 89084
$-708
Cash flow
-10.7%
Cash-on-Cash Return
3.2%
Cap rate
0.6%
Rent to Value Ratio
Active
$386,000
3
bds
|
3
ba
|
1,473
sqft
|
built
2023
3541 Arcadian Sea St, Las Vegas, NV 89106
$-897
Cash flow
-12.1%
Cash-on-Cash Return
2.9%
Cap rate
0.5%
Rent to Value Ratio
Active
$399,900
3
bds
|
2
ba
|
1,263
sqft
|
built
1983
2116 Cameron St, Las Vegas, NV 89102
$-781
Cash flow
-10.2%
Cash-on-Cash Return
3.3%
Cap rate
0.5%
Rent to Value Ratio
Active
$649,900
3
bds
|
3
ba
|
2,657
sqft
|
built
2009
6647 Brooklyn Heights St, Las Vegas, NV 89166
$-2,007
Cash flow
-16.1%
Cash-on-Cash Return
2.0%
Cap rate
0.3%
Rent to Value Ratio
Active
$399,999
5
bds
|
3
ba
|
1,666
sqft
|
built
1963
5821 Marka Dr, Las Vegas, NV 89108
$-394
Cash flow
-5.1%
Cash-on-Cash Return
4.5%
Cap rate
0.6%
Rent to Value Ratio
Active
$306,900
2
bds
|
2
ba
|
1,247
sqft
|
built
1994
1000 Grammy Dr, Las Vegas, NV 89145
$-482
Cash flow
-8.2%
Cash-on-Cash Return
3.8%
Cap rate
0.6%
Rent to Value Ratio
Active
$630,000
5
bds
|
3
ba
|
2,166
sqft
|
built
2011
3641 Via Terracina, Henderson, NV 89052
$-1,606
Cash flow
-13.3%
Cash-on-Cash Return
2.6%
Cap rate
0.4%
Rent to Value Ratio
Active
$240,000
2
bds
|
2
ba
|
1,122
sqft
|
built
1973
466 Las Casitas Way, Las Vegas, NV 89121
$-418
Cash flow
-9.1%
Cash-on-Cash Return
3.6%
Cap rate
0.6%
Rent to Value Ratio
Active
$488,888
4
bds
|
3
ba
|
2,001
sqft
|
built
1996
8125 Rio De Janeiro Dr, Las Vegas, NV 89128
$-770
Cash flow
-8.2%
Cash-on-Cash Return
3.8%
Cap rate
0.5%
Rent to Value Ratio
Active
$459,000
4
bds
|
3
ba
|
1,829
sqft
|
built
1990
982 Flapjack Dr, Henderson, NV 89014
$-612
Cash flow
-7.0%
Cash-on-Cash Return
4.1%
Cap rate
0.5%
Rent to Value Ratio
Active
$1,059,000
3
bds
|
4
ba
|
3,275
sqft
|
built
2003
4738 Laurel Canyon St, Las Vegas, NV 89129
$-3,019
Cash flow
-14.9%
Cash-on-Cash Return
2.3%
Cap rate
0.4%
Rent to Value Ratio
Active
$565,000
4
bds
|
3
ba
|
2,418
sqft
|
built
1990
7624 Nocturne Ct, Las Vegas, NV 89128
$-1,367
Cash flow
-12.6%
Cash-on-Cash Return
2.8%
Cap rate
0.4%
Rent to Value Ratio