Clark County Investment Properties for Sale
Browse homes for sale and investment properties in Clark County. Refine your search by price, property type, or more.
Best cash flowing properties in Clark County

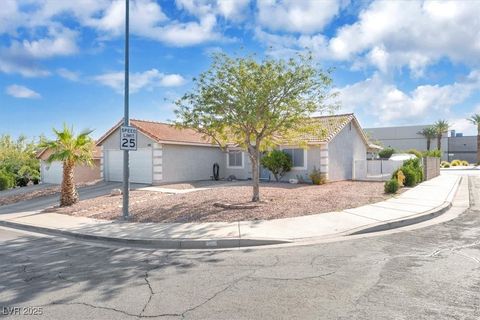
Active
$209,999
2
bds
|
2
ba
|
965
sqft
|
built
1993
5221 Lindell Rd, Las Vegas, NV 89118
$-285
Cash flow
-7.1%
Cash-on-Cash Return
4.1%
Cap rate
0.7%
Rent to Value Ratio
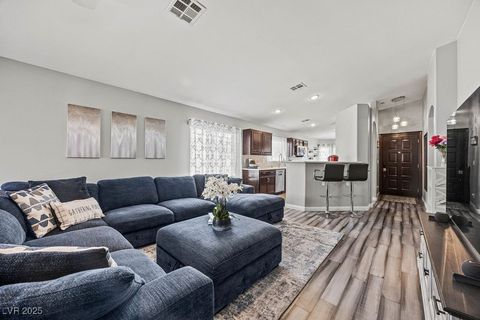
Active
$209,900
2
bds
|
2
ba
|
996
sqft
|
built
1986
6721 W Charleston Blvd, Las Vegas, NV 89146
$-472
Cash flow
-11.7%
Cash-on-Cash Return
3.0%
Cap rate
0.6%
Rent to Value Ratio
5,398 out of 5,578 properties for sale in Clark County
Limited Results Shown
Create a free account, or log in to reveal all property listings and enjoy the complete experience.
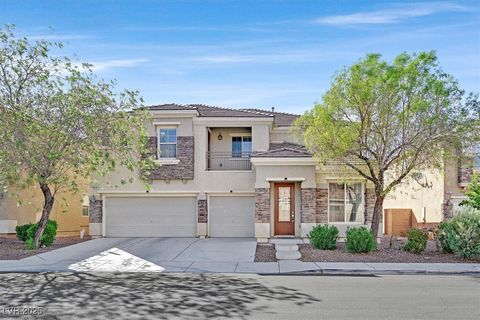
Active
$367,333
3
bds
|
3
ba
|
1,483
sqft
|
built
2020
727 Florence Isle Ave, Henderson, NV 89015
$-524
Cash flow
-7.4%
Cash-on-Cash Return
4.0%
Cap rate
0.6%
Rent to Value Ratio
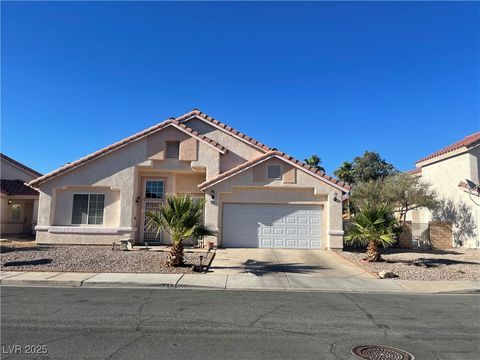
Active
$3,049,800
4
bds
|
5
ba
|
4,692
sqft
|
built
2021
16 Canyon Shores Pl, Henderson, NV 89011
$-8,599
Cash flow
-14.7%
Cash-on-Cash Return
2.3%
Cap rate
0.4%
Rent to Value Ratio
Active
$489,900
3
bds
|
3
ba
|
1,769
sqft
|
built
2005
247 Integrity Ridge Dr, Henderson, NV 89052
$-1,308
Cash flow
-13.9%
Cash-on-Cash Return
2.5%
Cap rate
0.4%
Rent to Value Ratio
Active
$459,990
3
bds
|
3
ba
|
1,783
sqft
|
built
2023
719 Cottonwood Hill Pl, Henderson, NV 89011
$-1,094
Cash flow
-12.4%
Cash-on-Cash Return
2.8%
Cap rate
0.5%
Rent to Value Ratio
Active
$490,000
3
bds
|
2
ba
|
1,592
sqft
|
built
2023
296 Fletcher Falls St, Henderson, NV 89015
$-1,162
Cash flow
-12.4%
Cash-on-Cash Return
2.8%
Cap rate
0.5%
Rent to Value Ratio
Active
$420,000
3
bds
|
3
ba
|
1,784
sqft
|
built
2024
1529 Eva Crossing Pl, Henderson, NV 89002
$-1,317
Cash flow
-16.4%
Cash-on-Cash Return
1.9%
Cap rate
0.4%
Rent to Value Ratio
Active
$1,150,000
4
bds
|
4
ba
|
3,653
sqft
|
built
2021
8 Vista Outlook St, Henderson, NV 89011
$-2,434
Cash flow
-11.0%
Cash-on-Cash Return
3.1%
Cap rate
0.5%
Rent to Value Ratio
Active
$419,000
3
bds
|
3
ba
|
1,517
sqft
|
built
2022
730 Last Dance Pl, Henderson, NV 89011
$-1,019
Cash flow
-12.7%
Cash-on-Cash Return
2.8%
Cap rate
0.5%
Rent to Value Ratio
Active
$750,000
4
bds
|
3
ba
|
2,909
sqft
|
built
2001
225 Ashville Ct, Henderson, NV 89012
$-1,638
Cash flow
-11.4%
Cash-on-Cash Return
3.1%
Cap rate
0.4%
Rent to Value Ratio
Active
$445,000
3
bds
|
3
ba
|
1,626
sqft
|
built
2012
1113 Via Monticano, Henderson, NV 89052
$-970
Cash flow
-11.4%
Cash-on-Cash Return
3.1%
Cap rate
0.4%
Rent to Value Ratio
Active
$485,000
3
bds
|
2
ba
|
1,815
sqft
|
built
1997
1064 Pincay Dr, Henderson, NV 89015
$-936
Cash flow
-10.1%
Cash-on-Cash Return
3.4%
Cap rate
0.5%
Rent to Value Ratio
Active
$674,900
5
bds
|
3
ba
|
3,418
sqft
|
built
2007
609 Doubleshot Ln, Henderson, NV 89052
$-1,302
Cash flow
-10.1%
Cash-on-Cash Return
3.4%
Cap rate
0.5%
Rent to Value Ratio
Active
$415,000
3
bds
|
2
ba
|
1,226
sqft
|
built
1995
500 Grape Dr, Henderson, NV 89015
$-556
Cash flow
-7.0%
Cash-on-Cash Return
4.1%
Cap rate
0.5%
Rent to Value Ratio
Active
$510,000
4
bds
|
2
ba
|
1,600
sqft
|
built
2005
2294 Dakota Sky Ct, Henderson, NV 89052
$-878
Cash flow
-9.0%
Cash-on-Cash Return
3.6%
Cap rate
0.5%
Rent to Value Ratio
Active
$450,000
4
bds
|
3
ba
|
2,127
sqft
|
built
1998
648 Hitchen Post Dr, Henderson, NV 89011
$-704
Cash flow
-8.2%
Cash-on-Cash Return
3.8%
Cap rate
0.5%
Rent to Value Ratio
Active
$560,000
4
bds
|
3
ba
|
1,697
sqft
|
built
1999
2527 New Salem Ave, Henderson, NV 89052
$-1,432
Cash flow
-13.3%
Cash-on-Cash Return
2.6%
Cap rate
0.4%
Rent to Value Ratio
Active
$459,900
4
bds
|
2
ba
|
2,009
sqft
|
built
1992
364 Dooley Dr, Henderson, NV 89015
$-725
Cash flow
-8.2%
Cash-on-Cash Return
3.8%
Cap rate
0.5%
Rent to Value Ratio
Active
$339,900
3
bds
|
3
ba
|
1,423
sqft
|
built
2004
6559 Tumbleweed Ridge Ln, Henderson, NV 89011
$-542
Cash flow
-8.3%
Cash-on-Cash Return
3.8%
Cap rate
0.6%
Rent to Value Ratio
Active
$733,900
4
bds
|
4
ba
|
2,991
sqft
|
built
2021
2577 Tolmezzo St, Henderson, NV 89044
$-1,920
Cash flow
-13.6%
Cash-on-Cash Return
2.5%
Cap rate
0.4%
Rent to Value Ratio
Active
$1,425,000
5
bds
|
5
ba
|
3,461
sqft
|
built
2001
109 N Buteo Woods Ln, Las Vegas, NV 89144
$-3,874
Cash flow
-14.2%
Cash-on-Cash Return
2.4%
Cap rate
0.4%
Rent to Value Ratio
Active
$499,999
3
bds
|
3
ba
|
2,459
sqft
|
built
2003
11021 Royal Highlands St, Las Vegas, NV 89141
$-1,148
Cash flow
-12.0%
Cash-on-Cash Return
2.9%
Cap rate
0.5%
Rent to Value Ratio
Active
$529,000
3
bds
|
2
ba
|
1,360
sqft
|
built
1997
8252 Roselle Ct, Las Vegas, NV 89129
$-1,407
Cash flow
-13.9%
Cash-on-Cash Return
2.5%
Cap rate
0.4%
Rent to Value Ratio
Active
$444,444
3
bds
|
2
ba
|
1,620
sqft
|
built
1976
204 Thunder St, Las Vegas, NV 89145
$-702
Cash flow
-8.2%
Cash-on-Cash Return
3.8%
Cap rate
0.5%
Rent to Value Ratio
Active
$535,000
3
bds
|
3
ba
|
1,716
sqft
|
built
2004
10268 Jersey Shore Ave, Las Vegas, NV 89135
$-1,300
Cash flow
-12.7%
Cash-on-Cash Return
2.8%
Cap rate
0.4%
Rent to Value Ratio
Active
$460,000
3
bds
|
2
ba
|
1,657
sqft
|
built
1979
1909 Oakleaf Ln, Las Vegas, NV 89146
$-859
Cash flow
-9.7%
Cash-on-Cash Return
3.4%
Cap rate
0.5%
Rent to Value Ratio
Active
$699,999
3
bds
|
3
ba
|
2,462
sqft
|
built
2002
745 Diamond Bend Ave, Las Vegas, NV 89123
$-1,661
Cash flow
-12.4%
Cash-on-Cash Return
2.8%
Cap rate
0.4%
Rent to Value Ratio
Active
$850,000
4
bds
|
2
ba
|
2,529
sqft
|
built
1973
2667 S Torrey Pines Dr, Las Vegas, NV 89146
$-1,835
Cash flow
-11.3%
Cash-on-Cash Return
3.1%
Cap rate
0.4%
Rent to Value Ratio
Active
$3,499,000
5
bds
|
7
ba
|
6,210
sqft
|
built
2003
10117 Summit Canyon Dr, Las Vegas, NV 89144
$-12,229
Cash flow
-18.2%
Cash-on-Cash Return
1.5%
Cap rate
0.3%
Rent to Value Ratio
Active
$400,000
3
bds
|
3
ba
|
1,896
sqft
|
built
2004
9553 Madsen Glen Ct, Las Vegas, NV 89166
$-764
Cash flow
-10.0%
Cash-on-Cash Return
3.4%
Cap rate
0.5%
Rent to Value Ratio
Active
$439,500
3
bds
|
3
ba
|
2,068
sqft
|
built
1994
7909 W Gilmore Ave, Las Vegas, NV 89129
$-690
Cash flow
-8.2%
Cash-on-Cash Return
3.8%
Cap rate
0.5%
Rent to Value Ratio
Active
$640,000
8
bds
|
0
ba
|
2,896
sqft
|
built
1983
917 Snug Harbor St, Las Vegas, NV 89110
$-2,120
Cash flow
-17.3%
Cash-on-Cash Return
1.7%
Cap rate
0.3%
Rent to Value Ratio
Active
$400,000
2
bds
|
2
ba
|
1,610
sqft
|
built
1986
5004 Rancho Bernardo Way, Las Vegas, NV 89130
$-903
Cash flow
-11.8%
Cash-on-Cash Return
3.0%
Cap rate
0.5%
Rent to Value Ratio
Active
$434,500
3
bds
|
3
ba
|
1,776
sqft
|
built
1994
3758 Norton Dr, Las Vegas, NV 89129
$-680
Cash flow
-8.2%
Cash-on-Cash Return
3.8%
Cap rate
0.5%
Rent to Value Ratio
Active
$269,000
2
bds
|
2
ba
|
1,138
sqft
|
built
1997
8400 W Charleston Blvd, Las Vegas, NV 89117
$-543
Cash flow
-10.5%
Cash-on-Cash Return
3.3%
Cap rate
0.6%
Rent to Value Ratio
Active
$309,900
2
bds
|
2
ba
|
1,183
sqft
|
built
2005
9157 Fish Tail Ave, Las Vegas, NV 89149
$-640
Cash flow
-10.8%
Cash-on-Cash Return
3.2%
Cap rate
0.5%
Rent to Value Ratio
Active
$610,000
4
bds
|
4
ba
|
2,626
sqft
|
built
2016
745 Shiva St, Las Vegas, NV 89178
$-934
Cash flow
-8.0%
Cash-on-Cash Return
3.8%
Cap rate
0.6%
Rent to Value Ratio
Active
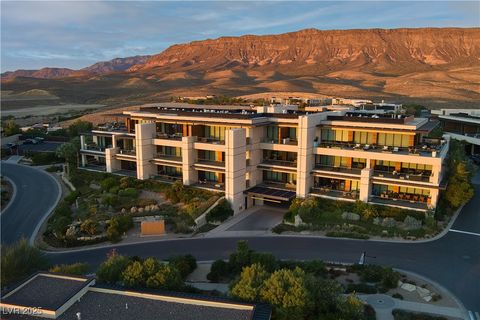
$8,500,000
2
bds
|
3
ba
|
1,906
sqft
|
built
2021
11665 Summit Club Dr, Las Vegas, NV 89135
$-41,151
Cash flow
-25.3%
Cash-on-Cash Return
-0.1%
Cap rate
0.1%
Rent to Value Ratio
Active
$429,500
2
bds
|
2
ba
|
1,050
sqft
|
built
1962
1201 Avenue I, Boulder City, NV 89005
$-519
Cash flow
-6.3%
Cash-on-Cash Return
4.2%
Cap rate
0.5%
Rent to Value Ratio