Nevada Investment Properties for Sale
Browse homes for sale and investment properties in Nevada. Refine your search by price, property type, or more.
Best cash flowing properties in Nevada
Active
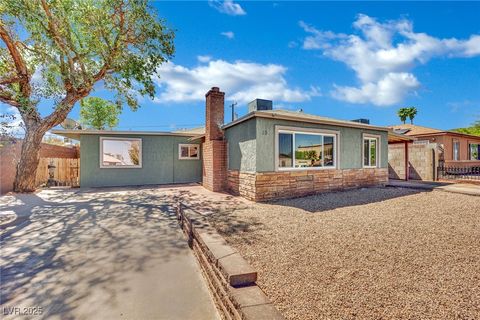
$379,990
4
bds
|
2
ba
|
1,676
sqft
|
built
1952
15 Lowery St, Henderson, NV 89015
$-478
Cash flow
-6.6%
Cash-on-Cash Return
4.2%
Cap rate
0.5%
Rent to Value Ratio

Active
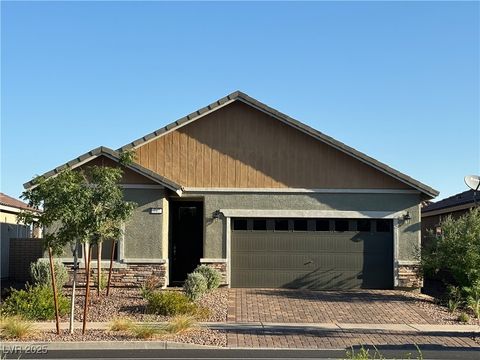
$370,000
3
bds
|
2
ba
|
1,514
sqft
|
built
2000
6471 Dune Point Ct, Las Vegas, NV 89142
$-546
Cash flow
-7.7%
Cash-on-Cash Return
3.9%
Cap rate
0.5%
Rent to Value Ratio
4,999 out of 5,264 properties for sale in Nevada
Limited Results Shown
Create a free account, or log in to reveal all property listings and enjoy the complete experience.
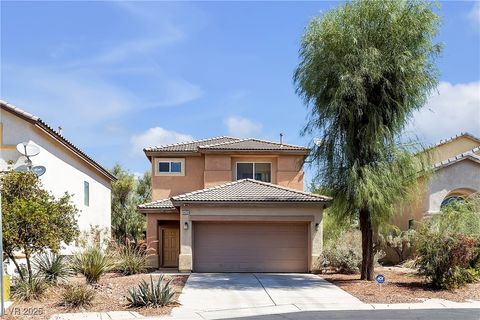
Active
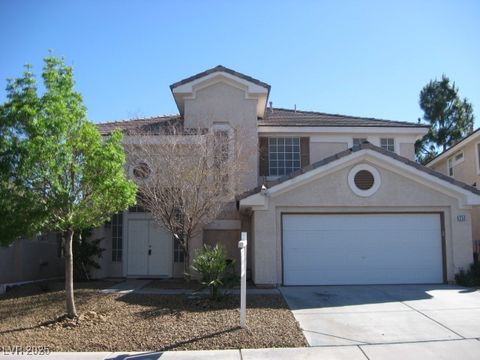
$519,999
3
bds
|
3
ba
|
1,661
sqft
|
built
2021
747 N Water St, Henderson, NV 89015
$-910
Cash flow
-9.1%
Cash-on-Cash Return
3.6%
Cap rate
0.6%
Rent to Value Ratio
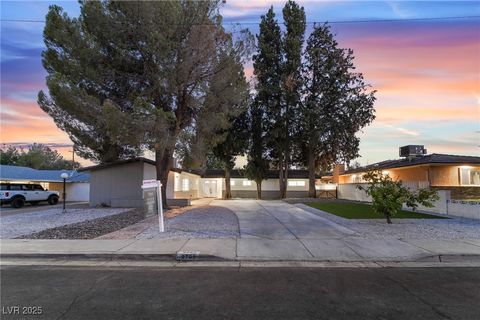
Active
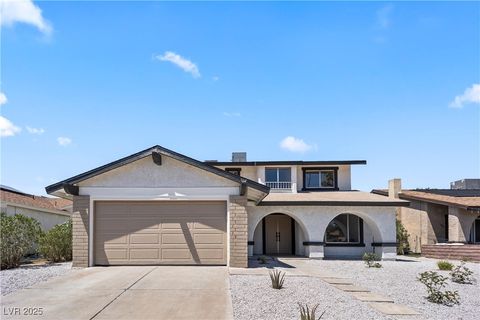
$519,900
3
bds
|
3
ba
|
1,969
sqft
|
built
1997
254 Horizon Pointe Cir, Henderson, NV 89012
$-1,247
Cash flow
-12.5%
Cash-on-Cash Return
2.8%
Cap rate
0.4%
Rent to Value Ratio

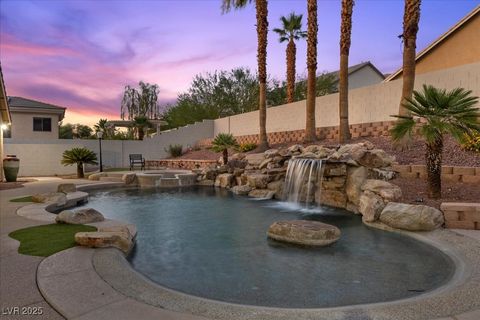
Active
$975,000
4
bds
|
4
ba
|
3,694
sqft
|
built
2005
905 Rhyolite Ter, Henderson, NV 89011
$-2,484
Cash flow
-13.3%
Cash-on-Cash Return
2.6%
Cap rate
0.4%
Rent to Value Ratio
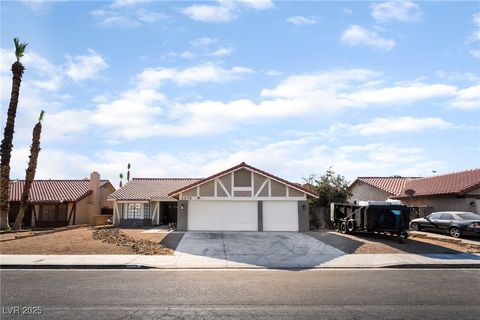
Active
$552,000
4
bds
|
3
ba
|
2,194
sqft
|
built
1979
307 Balsa St, Henderson, NV 89002
$-1,048
Cash flow
-9.9%
Cash-on-Cash Return
3.4%
Cap rate
0.5%
Rent to Value Ratio

Active
$700,000
4
bds
|
4
ba
|
2,969
sqft
|
built
1991
2636 White Pine Dr, Henderson, NV 89074
$-1,472
Cash flow
-11.0%
Cash-on-Cash Return
3.2%
Cap rate
0.5%
Rent to Value Ratio

Active
$489,900
3
bds
|
3
ba
|
1,935
sqft
|
built
2013
109 Fiery Hill Ave, Henderson, NV 89011
$-991
Cash flow
-10.6%
Cash-on-Cash Return
3.3%
Cap rate
0.5%
Rent to Value Ratio
Active
$445,000
3
bds
|
2
ba
|
1,356
sqft
|
built
1994
260 Lido Dr, Henderson, NV 89015
$-877
Cash flow
-10.3%
Cash-on-Cash Return
3.3%
Cap rate
0.4%
Rent to Value Ratio
Active
$335,000
2
bds
|
3
ba
|
1,287
sqft
|
built
1997
690 Ambling Gait Ave, Henderson, NV 89015
$-601
Cash flow
-9.4%
Cash-on-Cash Return
3.5%
Cap rate
0.5%
Rent to Value Ratio

Active
$750,000
4
bds
|
4
ba
|
3,486
sqft
|
built
2007
533 Blanche Ct, Henderson, NV 89052
$-1,523
Cash flow
-10.6%
Cash-on-Cash Return
3.2%
Cap rate
0.5%
Rent to Value Ratio

Active
$415,000
3
bds
|
3
ba
|
1,434
sqft
|
built
2009
3757 Via Geneva, Henderson, NV 89052
$-890
Cash flow
-11.2%
Cash-on-Cash Return
3.1%
Cap rate
0.5%
Rent to Value Ratio
Active
$329,990
2
bds
|
2
ba
|
1,229
sqft
|
built
2005
1362 Grass Creek Ave, Henderson, NV 89012
$-668
Cash flow
-10.6%
Cash-on-Cash Return
3.3%
Cap rate
0.5%
Rent to Value Ratio
Active
$639,000
3
bds
|
2
ba
|
2,240
sqft
|
built
2017
2442 Fanano St, Henderson, NV 89044
$-1,577
Cash flow
-12.9%
Cash-on-Cash Return
2.7%
Cap rate
0.4%
Rent to Value Ratio

Active
$1,699,000
4
bds
|
4
ba
|
2,852
sqft
|
built
2019
2159 Alto Vista Dr, Henderson, NV 89052
$-6,065
Cash flow
-18.6%
Cash-on-Cash Return
1.4%
Cap rate
0.2%
Rent to Value Ratio

Active
$2,890,000
4
bds
|
5
ba
|
3,863
sqft
|
built
2021
20 Falling Canyon Ct, Henderson, NV 89011
$-12,229
Cash flow
-22.1%
Cash-on-Cash Return
0.6%
Cap rate
0.2%
Rent to Value Ratio
Active
$699,900
4
bds
|
3
ba
|
2,813
sqft
|
built
1997
1598 Signal Butte Way, Henderson, NV 89012
$-1,526
Cash flow
-11.4%
Cash-on-Cash Return
3.1%
Cap rate
0.4%
Rent to Value Ratio
Active
$375,000
3
bds
|
3
ba
|
1,408
sqft
|
built
2000
1453 Evening Song Ave, Henderson, NV 89012
$-683
Cash flow
-9.5%
Cash-on-Cash Return
3.5%
Cap rate
0.5%
Rent to Value Ratio

Active
$1,250,000
4
bds
|
4
ba
|
3,350
sqft
|
built
2005
1119 Pinto Horse Ave, Henderson, NV 89052
$-3,720
Cash flow
-15.5%
Cash-on-Cash Return
2.1%
Cap rate
0.3%
Rent to Value Ratio
Active
$400,000
4
bds
|
2
ba
|
1,554
sqft
|
built
1981
791 Fountain Hills Ave, Henderson, NV 89002
$-622
Cash flow
-8.1%
Cash-on-Cash Return
3.8%
Cap rate
0.5%
Rent to Value Ratio
Active
$317,900
2
bds
|
2
ba
|
1,340
sqft
|
built
1996
2050 W Warm Springs Rd, Henderson, NV 89014
$-694
Cash flow
-11.4%
Cash-on-Cash Return
3.1%
Cap rate
0.6%
Rent to Value Ratio
Active
$1,395,000
3
bds
|
4
ba
|
2,713
sqft
|
built
2016
186 S Naples St, Henderson, NV 89015
$-2,395
Cash flow
-9.0%
Cash-on-Cash Return
3.6%
Cap rate
0.5%
Rent to Value Ratio

Active
$439,900
3
bds
|
3
ba
|
1,503
sqft
|
built
2020
805 E Sunset Rd, Henderson, NV 89011
$-933
Cash flow
-11.1%
Cash-on-Cash Return
3.1%
Cap rate
0.5%
Rent to Value Ratio
Active
$369,000
4
bds
|
3
ba
|
1,526
sqft
|
built
2005
6483 Brook Cottage Ln, Las Vegas, NV 89122
$-662
Cash flow
-9.4%
Cash-on-Cash Return
3.5%
Cap rate
0.5%
Rent to Value Ratio
Active
$364,000
3
bds
|
2
ba
|
1,325
sqft
|
built
1995
5400 Maddox Ave, Las Vegas, NV 89107
$-584
Cash flow
-8.4%
Cash-on-Cash Return
3.8%
Cap rate
0.5%
Rent to Value Ratio
Active
$549,995
6
bds
|
3
ba
|
2,132
sqft
|
built
1963
944 De Met Dr, Las Vegas, NV 89119
$-610
Cash flow
-5.8%
Cash-on-Cash Return
4.3%
Cap rate
0.6%
Rent to Value Ratio

Active
$472,000
3
bds
|
2
ba
|
2,318
sqft
|
built
2016
10431 Prairie Mountain Ave, Las Vegas, NV 89166
$-998
Cash flow
-11.0%
Cash-on-Cash Return
3.1%
Cap rate
0.5%
Rent to Value Ratio
Active
$460,000
4
bds
|
3
ba
|
2,069
sqft
|
built
2004
6436 Swift Fox Ct, Las Vegas, NV 89122
$-846
Cash flow
-9.6%
Cash-on-Cash Return
3.5%
Cap rate
0.5%
Rent to Value Ratio
Active
$700,000
4
bds
|
3
ba
|
2,282
sqft
|
built
1960
2701 Mason Ave, Las Vegas, NV 89102
$-1,504
Cash flow
-11.2%
Cash-on-Cash Return
3.1%
Cap rate
0.4%
Rent to Value Ratio
Active
$700,000
4
bds
|
3
ba
|
2,956
sqft
|
built
2002
302 N Hollywood Blvd, Las Vegas, NV 89110
$-1,639
Cash flow
-12.2%
Cash-on-Cash Return
2.9%
Cap rate
0.4%
Rent to Value Ratio
Active
$544,999
3
bds
|
2
ba
|
1,886
sqft
|
built
1987
5570 Palm St, Las Vegas, NV 89120
$-598
Cash flow
-5.7%
Cash-on-Cash Return
4.4%
Cap rate
0.6%
Rent to Value Ratio

Active
$469,000
3
bds
|
3
ba
|
2,252
sqft
|
built
2006
9175 Sunken Meadow Ave, Las Vegas, NV 89178
$-973
Cash flow
-10.8%
Cash-on-Cash Return
3.2%
Cap rate
0.5%
Rent to Value Ratio

Active
$460,000
4
bds
|
4
ba
|
2,644
sqft
|
built
2012
10944 Mount Stellar St, Las Vegas, NV 89179
$-848
Cash flow
-9.6%
Cash-on-Cash Return
3.5%
Cap rate
0.5%
Rent to Value Ratio

Active
$480,000
4
bds
|
2
ba
|
1,911
sqft
|
built
2012
10208 Arch Bluff St, Las Vegas, NV 89178
$-1,017
Cash flow
-11.1%
Cash-on-Cash Return
3.1%
Cap rate
0.5%
Rent to Value Ratio
Active
$449,000
3
bds
|
2
ba
|
1,558
sqft
|
built
1987
4829 Farlington Dr, Las Vegas, NV 89147
$-884
Cash flow
-10.3%
Cash-on-Cash Return
3.3%
Cap rate
0.4%
Rent to Value Ratio
Active
$756,000
4
bds
|
4
ba
|
3,457
sqft
|
built
2004
6209 Exquisite Ave, Las Vegas, NV 89110
$-1,852
Cash flow
-12.8%
Cash-on-Cash Return
2.7%
Cap rate
0.4%
Rent to Value Ratio

Active
$799,900
4
bds
|
4
ba
|
2,948
sqft
|
built
2011
8630 Lavender Ridge St, Las Vegas, NV 89131
$-2,118
Cash flow
-13.8%
Cash-on-Cash Return
2.5%
Cap rate
0.4%
Rent to Value Ratio

Active
$775,000
4
bds
|
3
ba
|
2,394
sqft
|
built
2011
956 Baronet Dr, Las Vegas, NV 89138
$-1,375
Cash flow
-9.3%
Cash-on-Cash Return
3.6%
Cap rate
0.5%
Rent to Value Ratio

Active
$500,000
3
bds
|
4
ba
|
2,382
sqft
|
built
2008
8180 Skytop Ledge Ave, Las Vegas, NV 89178
$-1,059
Cash flow
-11.1%
Cash-on-Cash Return
3.1%
Cap rate
0.5%
Rent to Value Ratio

Active
$415,000
3
bds
|
2
ba
|
1,303
sqft
|
built
1999
7849 March Brown Ave, Las Vegas, NV 89149
$-764
Cash flow
-9.6%
Cash-on-Cash Return
3.5%
Cap rate
0.5%
Rent to Value Ratio