Nevada Investment Properties for Sale
Browse homes for sale and investment properties in Nevada. Refine your search by price, property type, or more.
Best cash flowing properties in Nevada
Active
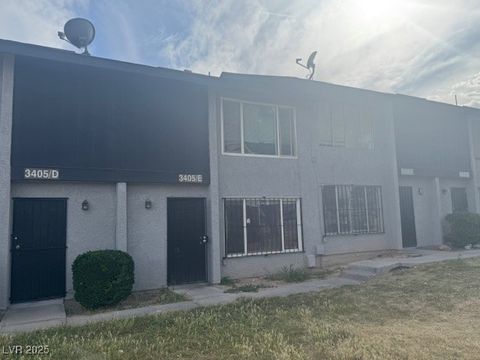
$187,900
2
bds
|
2
ba
|
1,088
sqft
|
built
1981
3405 Civic Center Dr, North Las Vegas, NV 89030
$-102
Cash flow
-2.8%
Cash-on-Cash Return
5.0%
Cap rate
0.7%
Rent to Value Ratio
Active
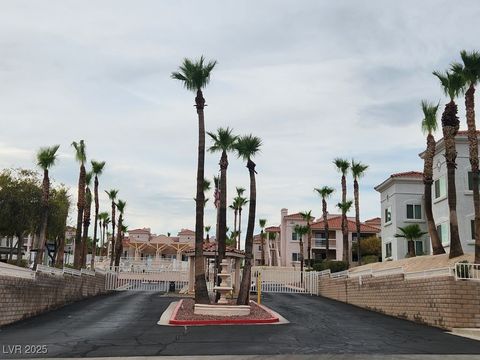
$120,000
1
bds
|
1
ba
|
700
sqft
|
built
1989
1964 Las Palmas Ln, Laughlin, NV 89029
$-218
Cash flow
-9.5%
Cash-on-Cash Return
3.5%
Cap rate
0.9%
Rent to Value Ratio
5,633 out of 5,883 properties for sale in Nevada
Limited Results Shown
Create a free account, or log in to reveal all property listings and enjoy the complete experience.
Active
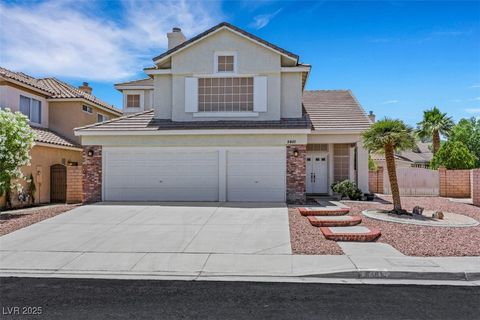
$570,000
4
bds
|
3
ba
|
2,300
sqft
|
built
1994
8481 Lambert Dr, Las Vegas, NV 89147
$-1,219
Cash flow
-11.2%
Cash-on-Cash Return
3.1%
Cap rate
0.4%
Rent to Value Ratio
Active
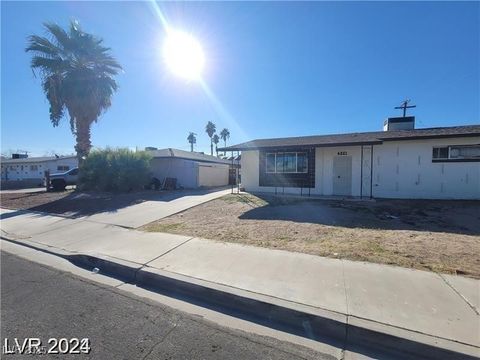
$409,900
2
bds
|
1
ba
|
1,260
sqft
|
built
1963
4321 El Conlon Ave, Las Vegas, NV 89102
$-1,083
Cash flow
-13.8%
Cash-on-Cash Return
2.5%
Cap rate
0.3%
Rent to Value Ratio
Active
$1,129,990
4
bds
|
5
ba
|
3,975
sqft
|
built
2006
364 Trentino Alto St, Henderson, NV 89012
$-3,238
Cash flow
-15.0%
Cash-on-Cash Return
2.2%
Cap rate
0.4%
Rent to Value Ratio
Active
$799,000
4
bds
|
4
ba
|
2,556
sqft
|
built
1997
1135 Hidden Mist St, Henderson, NV 89052
$-791
Cash flow
-5.2%
Cash-on-Cash Return
4.5%
Cap rate
0.6%
Rent to Value Ratio

Active
$609,000
3
bds
|
3
ba
|
2,056
sqft
|
built
1999
283 New River Cir, Henderson, NV 89052
$-1,041
Cash flow
-8.9%
Cash-on-Cash Return
3.6%
Cap rate
0.5%
Rent to Value Ratio
Active
$1,775,000
6
bds
|
6
ba
|
3,874
sqft
|
built
2022
365 Crown Mesa Ave, Las Vegas, NV 89138
$-5,781
Cash flow
-17.0%
Cash-on-Cash Return
1.8%
Cap rate
0.3%
Rent to Value Ratio
Active
$459,000
3
bds
|
2
ba
|
1,664
sqft
|
built
2023
74 Cadence Crest Ave, Henderson, NV 89011
$-834
Cash flow
-9.5%
Cash-on-Cash Return
3.5%
Cap rate
0.5%
Rent to Value Ratio
Active
$239,900
3
bds
|
3
ba
|
1,617
sqft
|
built
1993
2223 Rugged Mesa Dr, Laughlin, NV 89029
$-487
Cash flow
-10.6%
Cash-on-Cash Return
3.2%
Cap rate
0.7%
Rent to Value Ratio
Active
$1,419,000
6
bds
|
7
ba
|
6,632
sqft
|
built
1997
2209 Purple Majesty Ct, Las Vegas, NV 89117
$-2,422
Cash flow
-8.9%
Cash-on-Cash Return
3.6%
Cap rate
0.6%
Rent to Value Ratio
Active
$495,000
3
bds
|
3
ba
|
1,687
sqft
|
built
2001
2333 Silver Crew Pass, Henderson, NV 89052
$-1,077
Cash flow
-11.4%
Cash-on-Cash Return
3.1%
Cap rate
0.4%
Rent to Value Ratio
Active
$525,000
3
bds
|
0
ba
|
1,880
sqft
|
built
1945
632 Avenue D, Boulder City, NV 89005
$-1,576
Cash flow
-15.7%
Cash-on-Cash Return
2.1%
Cap rate
0.3%
Rent to Value Ratio
Active
$189,900
2
bds
|
2
ba
|
900
sqft
|
built
1989
2191 Bay Club Dr, Laughlin, NV 89029
$-493
Cash flow
-13.5%
Cash-on-Cash Return
2.6%
Cap rate
0.6%
Rent to Value Ratio
Active
$306,360
3
bds
|
3
ba
|
1,656
sqft
|
built
1980
3233 Kinsale Ct, Las Vegas, NV 89121
$-606
Cash flow
-10.3%
Cash-on-Cash Return
3.3%
Cap rate
0.6%
Rent to Value Ratio
Active
$175,000
2
bds
|
1
ba
|
998
sqft
|
built
1994
3550 Bay Sands Dr, Laughlin, NV 89029
$-243
Cash flow
-7.2%
Cash-on-Cash Return
4.0%
Cap rate
0.8%
Rent to Value Ratio
Active
$485,000
4
bds
|
3
ba
|
2,032
sqft
|
built
2006
7941 Limestone Arch Ave, Las Vegas, NV 89178
$-964
Cash flow
-10.4%
Cash-on-Cash Return
3.3%
Cap rate
0.5%
Rent to Value Ratio
Active
$349,900
2
bds
|
2
ba
|
1,116
sqft
|
built
1983
403 Woodridge Dr, Henderson, NV 89015
$-494
Cash flow
-7.4%
Cash-on-Cash Return
4.0%
Cap rate
0.5%
Rent to Value Ratio
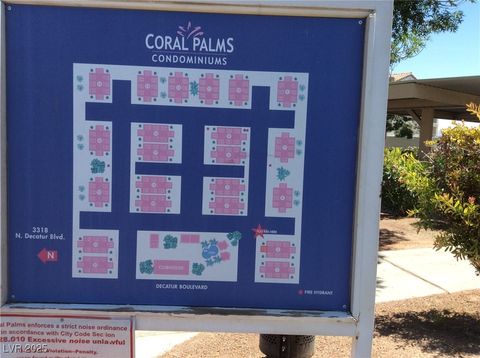
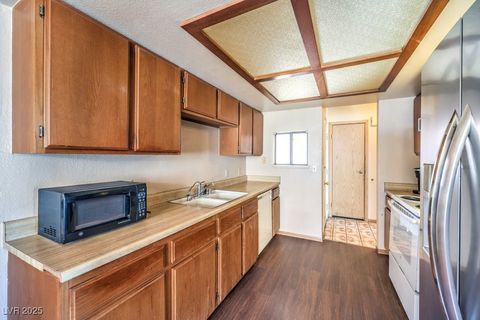
Active
$169,900
2
bds
|
2
ba
|
976
sqft
|
built
1998
3318 N Decatur Blvd, Las Vegas, NV 89130
$-385
Cash flow
-11.8%
Cash-on-Cash Return
3.0%
Cap rate
0.8%
Rent to Value Ratio
Active
$1,250,000
5
bds
|
3
ba
|
3,240
sqft
|
built
2020
2567 Speyburn Ave, Henderson, NV 89044
$-1,089
Cash flow
-4.5%
Cash-on-Cash Return
4.6%
Cap rate
0.6%
Rent to Value Ratio
Active
$439,900
3
bds
|
3
ba
|
1,781
sqft
|
built
2020
4423 Creekside Cavern Ave, North Las Vegas, NV 89084
$-1,012
Cash flow
-12.0%
Cash-on-Cash Return
2.9%
Cap rate
0.5%
Rent to Value Ratio
Active
$189,900
1
bds
|
1
ba
|
702
sqft
|
built
1977
5116 Gray Ln, Las Vegas, NV 89119
$-471
Cash flow
-12.9%
Cash-on-Cash Return
2.7%
Cap rate
0.5%
Rent to Value Ratio
Active
$225,000
2
bds
|
2
ba
|
1,053
sqft
|
built
2002
3400 Cabana Dr, Las Vegas, NV 89122
$-395
Cash flow
-9.2%
Cash-on-Cash Return
3.6%
Cap rate
0.6%
Rent to Value Ratio
Active
$254,000
2
bds
|
2
ba
|
1,304
sqft
|
built
1984
2616 Aracatuba Ave, Las Vegas, NV 89121
$-340
Cash flow
-7.0%
Cash-on-Cash Return
4.1%
Cap rate
0.6%
Rent to Value Ratio
Active
$5,995,000
4
bds
|
5
ba
|
5,320
sqft
|
built
2018
671 Scenic Rim Dr, Henderson, NV 89012
$-23,370
Cash flow
-20.3%
Cash-on-Cash Return
1.0%
Cap rate
0.2%
Rent to Value Ratio
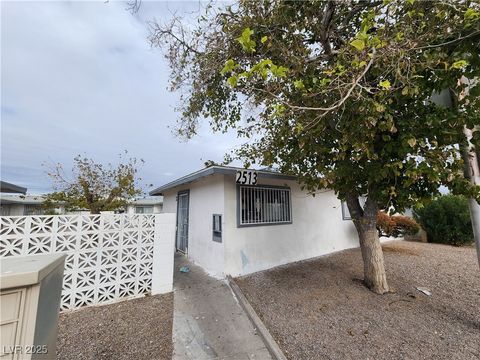
Active
$595,000
6
bds
|
0
ba
|
2,870
sqft
|
built
1962
2513 Cedar Ave, Las Vegas, NV 89101
$-1,839
Cash flow
-16.1%
Cash-on-Cash Return
2.0%
Cap rate
0.3%
Rent to Value Ratio
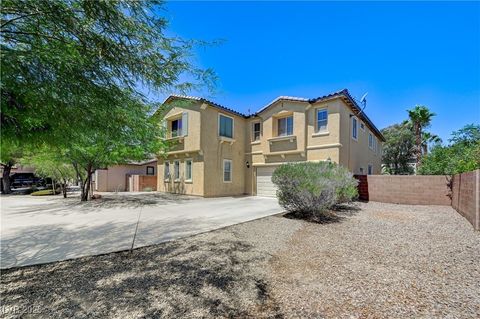
Active
$794,000
5
bds
|
5
ba
|
4,825
sqft
|
built
2006
2208 Cactus Desert Ct, North Las Vegas, NV 89084
$-1,948
Cash flow
-12.8%
Cash-on-Cash Return
2.7%
Cap rate
0.4%
Rent to Value Ratio
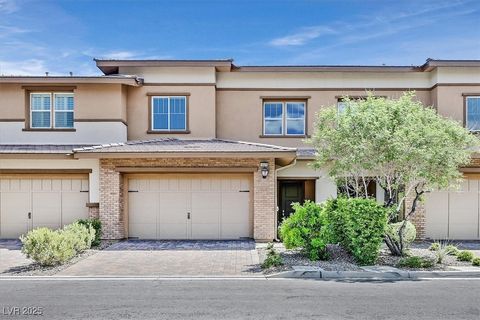
Active
$495,000
3
bds
|
3
ba
|
1,597
sqft
|
built
2015
10375 Pescado Ln, Las Vegas, NV 89135
$-1,271
Cash flow
-13.4%
Cash-on-Cash Return
2.6%
Cap rate
0.5%
Rent to Value Ratio
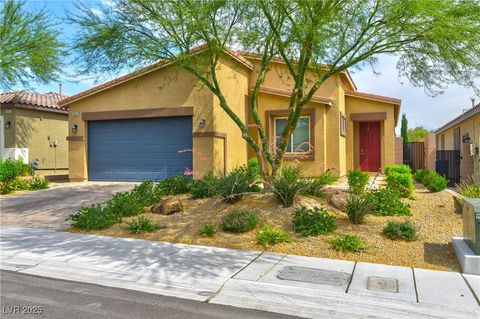
Active
$440,000
3
bds
|
2
ba
|
1,601
sqft
|
built
2019
5854 Olivine Falls Ave, Las Vegas, NV 89130
$-855
Cash flow
-10.1%
Cash-on-Cash Return
3.3%
Cap rate
0.5%
Rent to Value Ratio
Active
$529,000
3
bds
|
3
ba
|
1,851
sqft
|
built
2017
11289 Vision Peak Ave, Las Vegas, NV 89135
$-888
Cash flow
-8.8%
Cash-on-Cash Return
3.7%
Cap rate
0.6%
Rent to Value Ratio
Active
$7,995,000
5
bds
|
7
ba
|
7,690
sqft
|
built
2020
811 Magnum Cliff Ct, Henderson, NV 89012
$-36,784
Cash flow
-24.0%
Cash-on-Cash Return
0.2%
Cap rate
0.1%
Rent to Value Ratio
Active
$675,000
5
bds
|
3
ba
|
2,467
sqft
|
built
2021
2417 Fasano St, Henderson, NV 89044
$-913
Cash flow
-7.1%
Cash-on-Cash Return
4.1%
Cap rate
0.6%
Rent to Value Ratio

Active
$406,777
3
bds
|
3
ba
|
1,518
sqft
|
built
2022
20 Barbara Ln, Las Vegas, NV 89183
$-874
Cash flow
-11.2%
Cash-on-Cash Return
3.1%
Cap rate
0.5%
Rent to Value Ratio
Active
$695,000
5
bds
|
3
ba
|
2,779
sqft
|
built
2018
2947 Caxton Grove Dr, Henderson, NV 89052
$-1,640
Cash flow
-12.3%
Cash-on-Cash Return
2.8%
Cap rate
0.5%
Rent to Value Ratio
Active
$900,000
5
bds
|
4
ba
|
4,344
sqft
|
built
2021
7307 Grace Estate Ave, Las Vegas, NV 89113
$-2,180
Cash flow
-12.6%
Cash-on-Cash Return
2.8%
Cap rate
0.4%
Rent to Value Ratio
Active
$1,199,000
6
bds
|
5
ba
|
4,614
sqft
|
built
1994
2111 Loro Ct, Las Vegas, NV 89117
$-2,499
Cash flow
-10.9%
Cash-on-Cash Return
3.2%
Cap rate
0.5%
Rent to Value Ratio
Active
$587,000
4
bds
|
4
ba
|
2,601
sqft
|
built
2022
10411 Rose Palisade St, Las Vegas, NV 89141
$-1,097
Cash flow
-9.8%
Cash-on-Cash Return
3.4%
Cap rate
0.5%
Rent to Value Ratio
Active
$409,900
3
bds
|
2
ba
|
1,425
sqft
|
built
1997
812 Rio Poco Ct, Henderson, NV 89015
$-710
Cash flow
-9.0%
Cash-on-Cash Return
3.6%
Cap rate
0.5%
Rent to Value Ratio
Active
$399,000
3
bds
|
3
ba
|
1,637
sqft
|
built
1996
2573 Rafferty Creek Ln, Las Vegas, NV 89156
$-628
Cash flow
-8.2%
Cash-on-Cash Return
3.8%
Cap rate
0.5%
Rent to Value Ratio
Active
$1,025,000
5
bds
|
4
ba
|
4,468
sqft
|
built
2002
9155 Harvest Homes St, Las Vegas, NV 89123
$-2,690
Cash flow
-13.7%
Cash-on-Cash Return
2.5%
Cap rate
0.4%
Rent to Value Ratio