Ocala, FL Investment Properties for Sale
Browse homes for sale and investment properties in Ocala, FL. Refine your search by price, property type, or more.
Best cash flowing properties in Ocala, FL
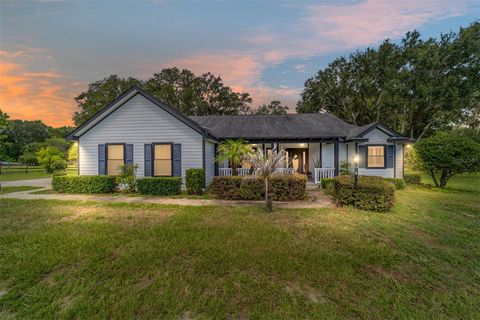
Active
$1,600
2
bds
|
2
ba
|
0
sqft
|
built
1982
8955 SW 104th Ln, Ocala, FL 34481
$737
Cash flow
536.7%
Cash-on-Cash Return
552.8%
Cap rate
93.8%
Rent to Value Ratio
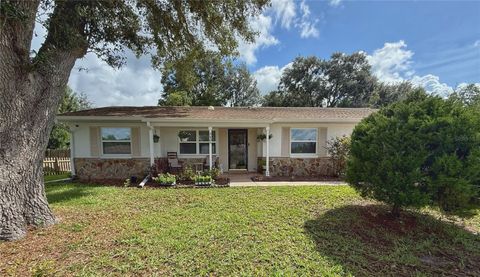
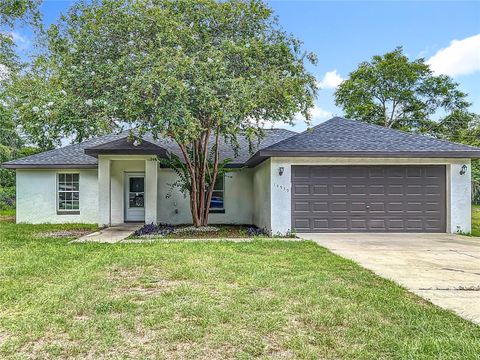
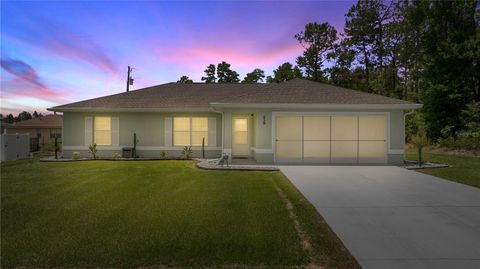
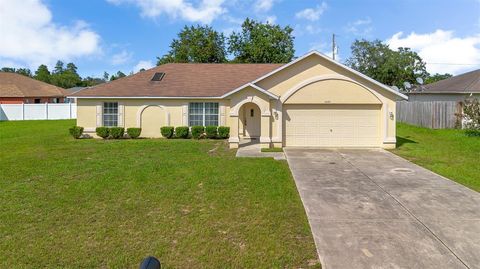
Active
$205,000
3
bds
|
2
ba
|
1,377
sqft
|
built
2007
1500 SW 153rd Ct, Ocala, FL 34481
$29
Cash flow
0.7%
Cash-on-Cash Return
6.3%
Cap rate
0.8%
Rent to Value Ratio
417 out of 426 properties for sale in Ocala, FL
Limited Results Shown
Create a free account, or log in to reveal all property listings and enjoy the complete experience.
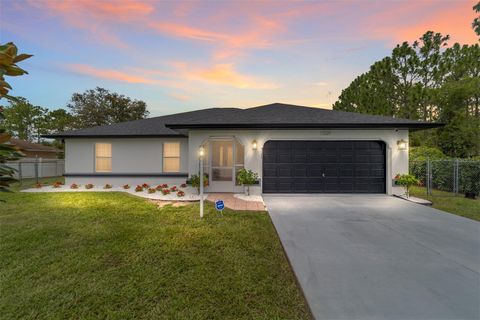
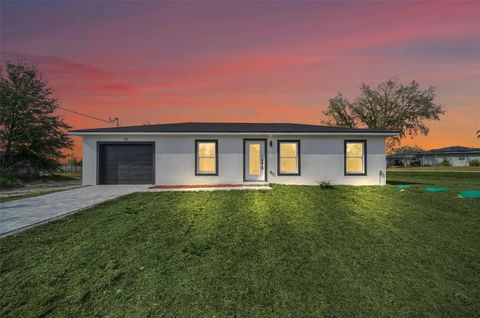
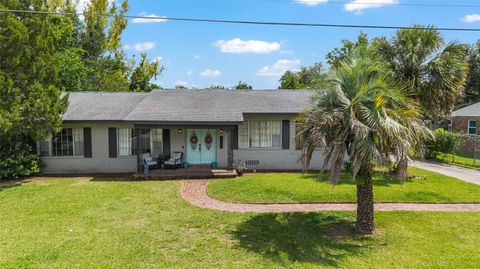
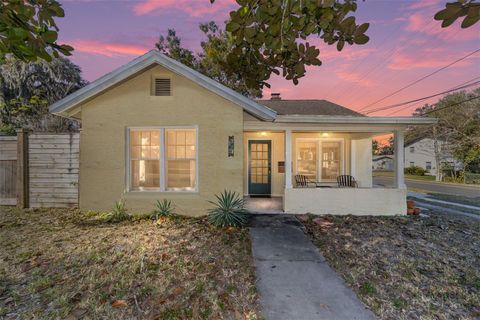
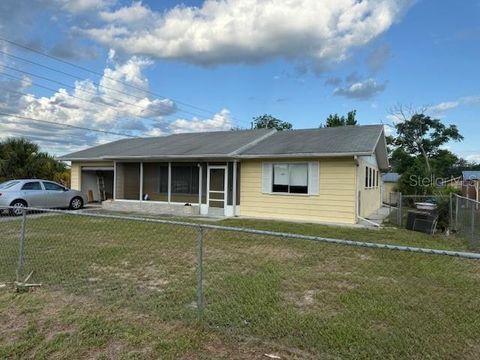
Active
$240,000
3
bds
|
2
ba
|
1,424
sqft
|
built
1979
2837 NW 4th Ave, Ocala, FL 34475
$-550
Cash flow
-12.0%
Cash-on-Cash Return
3.4%
Cap rate
0.6%
Rent to Value Ratio
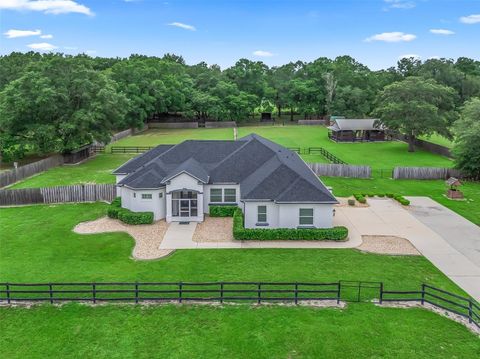
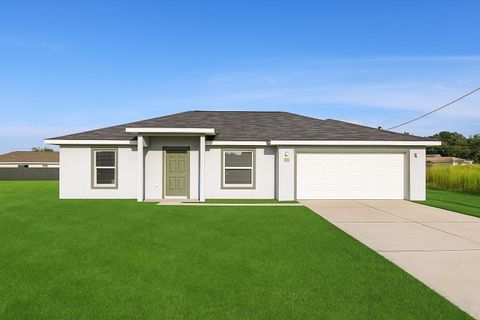
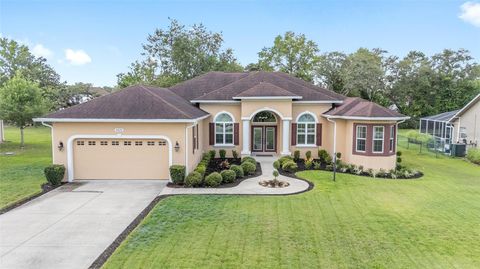
Active
$649,000
3
bds
|
3
ba
|
3,019
sqft
|
built
1997
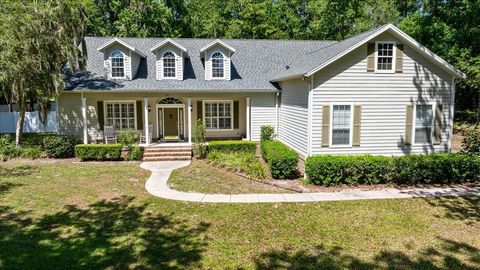
645 SW 48th Ln, Ocala, FL 34471
$-1,483
Cash flow
-11.9%
Cash-on-Cash Return
3.4%
Cap rate
0.6%
Rent to Value Ratio
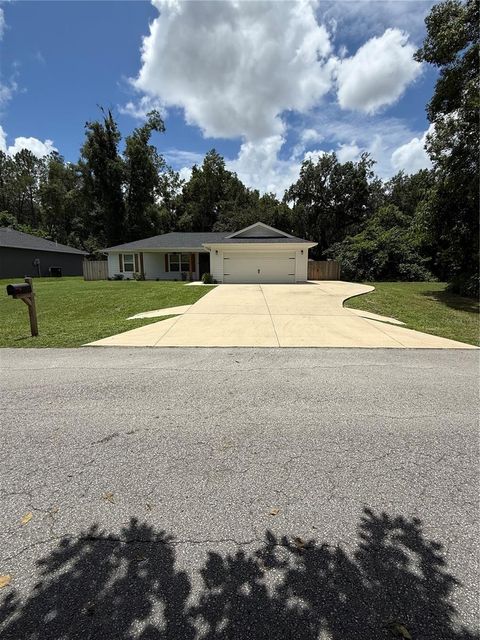
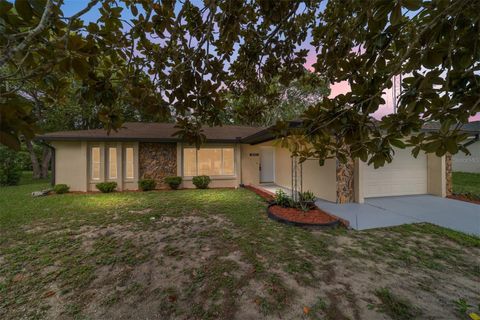
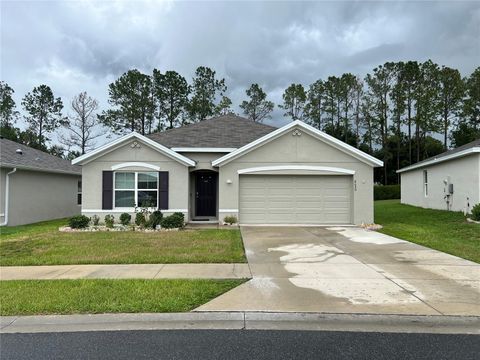
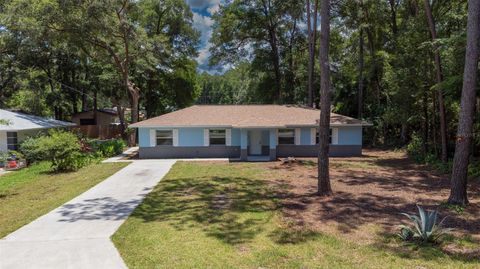
Active
$279,900
3
bds
|
2
ba
|
1,925
sqft
|
built
1982
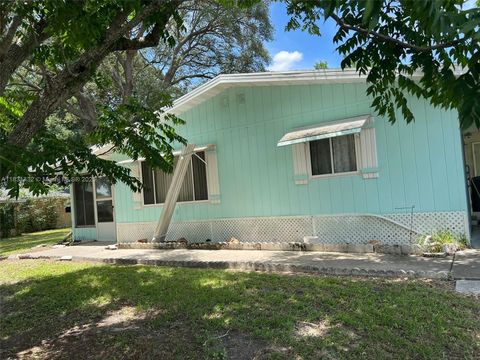
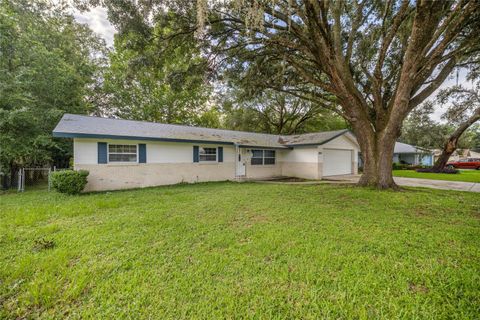
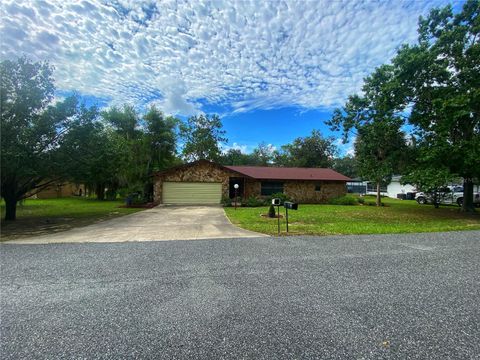
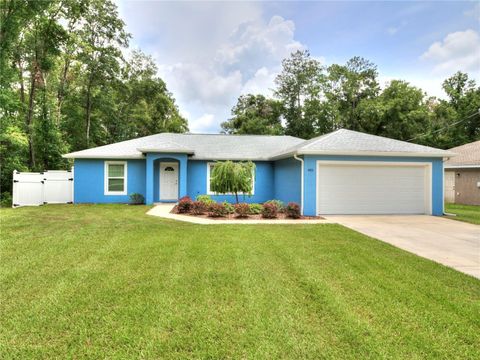
545 Silver Course Cir, Ocala, FL 34472
$-430
Cash flow
-8.0%
Cash-on-Cash Return
4.3%
Cap rate
0.6%
Rent to Value Ratio
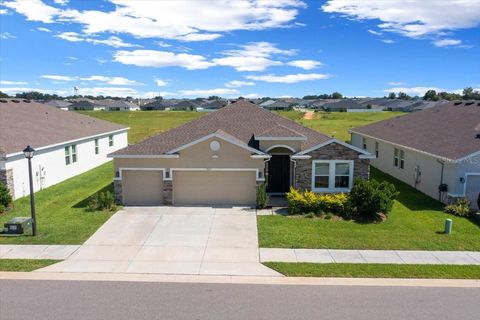
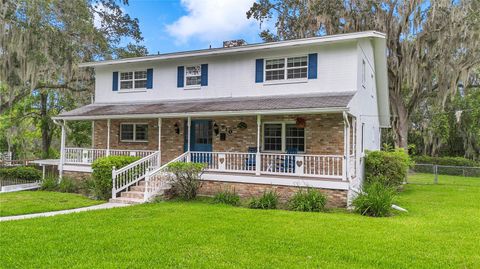
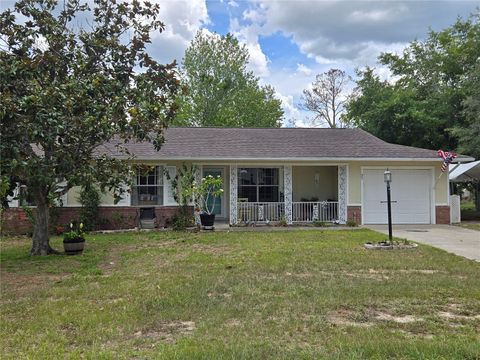
Active
$369,000
3
bds
|
2
ba
|
2,326
sqft
|
built
1970
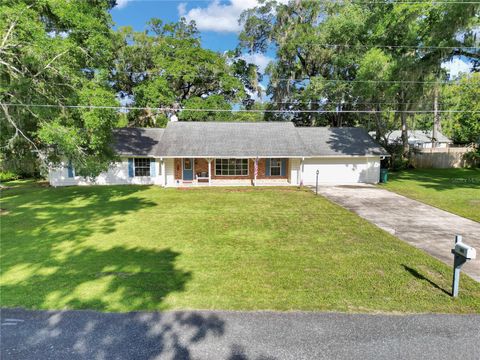
148 SE 39th Ter, Ocala, FL 34471
$-559
Cash flow
-7.9%
Cash-on-Cash Return
4.3%
Cap rate
0.7%
Rent to Value Ratio
Active
$875,000
4
bds
|
4
ba
|
3,186
sqft
|
built
2022
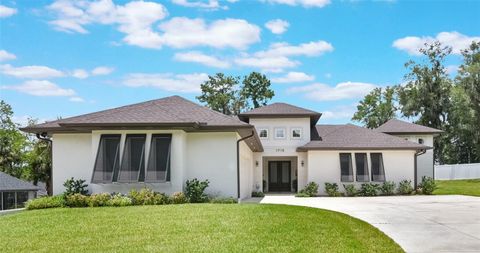
1715 SW 27th Pl, Ocala, FL 34471
$-3,297
Cash flow
-19.7%
Cash-on-Cash Return
1.6%
Cap rate
0.4%
Rent to Value Ratio
Active
$410,000
3
bds
|
2
ba
|
2,265
sqft
|
built
1986
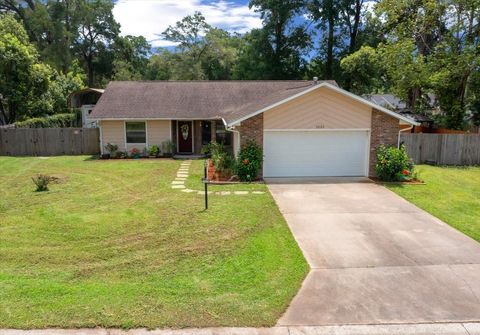
1025 SE 56th Ct, Ocala, FL 34480
$-889
Cash flow
-11.3%
Cash-on-Cash Return
3.5%
Cap rate
0.6%
Rent to Value Ratio
Active
$295,000
3
bds
|
2
ba
|
1,350
sqft
|
built
2021
4931 NW 62nd Ave, Ocala, FL 34482
$-553
Cash flow
-9.8%
Cash-on-Cash Return
3.9%
Cap rate
0.6%
Rent to Value Ratio

Active
$265,000
3
bds
|
2
ba
|
1,356
sqft
|
built
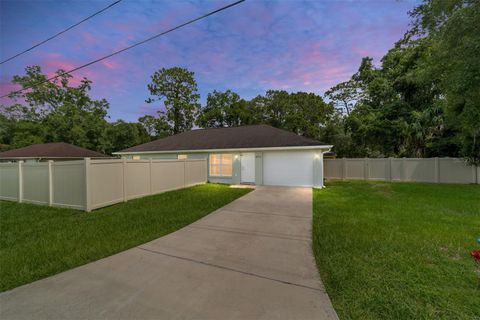
1979
3 Silver Ct, Ocala, FL 34472
$-467
Cash flow
-9.2%
Cash-on-Cash Return
4.0%
Cap rate
0.7%
Rent to Value Ratio
Active
$245,000
3
bds
|
2
ba
|
1,260
sqft
|
built
2018
2711 SW 17th Cir, Ocala, FL 34474
$-452
Cash flow
-9.6%
Cash-on-Cash Return
3.9%
Cap rate
0.7%
Rent to Value Ratio
Active
$249,900
3
bds
|
2
ba
|
1,762
sqft
|
built
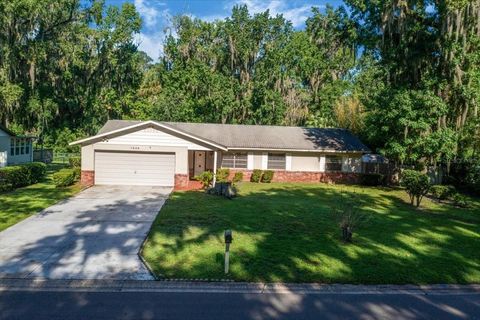
1977
1928 SE 14th Ave, Ocala, FL 34471
$-206
Cash flow
-4.3%
Cash-on-Cash Return
5.2%
Cap rate
0.8%
Rent to Value Ratio
Active
$239,000
3
bds
|
2
ba
|
1,864
sqft
|
built
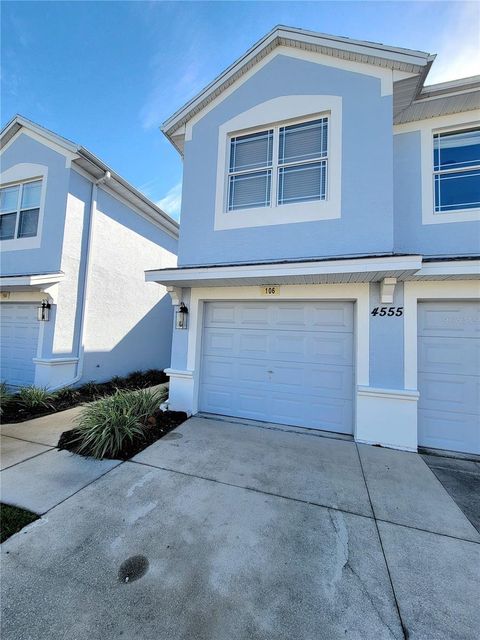
2006
4555 SW 52nd Cir, Ocala, FL 34474
$-648
Cash flow
-14.1%
Cash-on-Cash Return
2.9%
Cap rate
0.8%
Rent to Value Ratio
Active
$450,000
3
bds
|
3
ba
|
2,592
sqft
|
built
2018
6429 SW 45th Ave, Ocala, FL 34474
$-1,135
Cash flow
-13.2%
Cash-on-Cash Return
3.1%
Cap rate
0.6%
Rent to Value Ratio
Active
$949,000
3
bds
|
2
ba
|
2,908
sqft
|
built
1999
3811 SE 44th St, Ocala, FL 34480
$-2,430
Cash flow
-13.4%
Cash-on-Cash Return
3.1%
Cap rate
0.4%
Rent to Value Ratio
Active
$264,999
3
bds
|
2
ba
|
1,670
sqft
|
built
2021
27 Hickory Course Ln, Ocala, FL 34472
$-504
Cash flow
-9.9%
Cash-on-Cash Return
3.9%
Cap rate
0.7%
Rent to Value Ratio
Active
$285,000
3
bds
|
2
ba
|
1,868
sqft
|
built
2006
153 Juniper Run, Ocala, FL 34480
$-182
Cash flow
-3.3%
Cash-on-Cash Return
5.4%
Cap rate
0.7%
Rent to Value Ratio
Active
$220,000
2
bds
|
2
ba
|
1,216
sqft
|
built
1980
3405 SW 147th Lane Rd, Ocala, FL 34473
$-450
Cash flow
-10.7%
Cash-on-Cash Return
3.7%
Cap rate
0.6%
Rent to Value Ratio
Active
$388,900
3
bds
|
2
ba
|
1,764
sqft
|
built
2003
13023 SW 79th Cir, Ocala, FL 34473
$-1,162
Cash flow
-15.6%
Cash-on-Cash Return
2.6%
Cap rate
0.4%
Rent to Value Ratio
Active
$349,900
3
bds
|
2
ba
|
1,406
sqft
|
built
2022
4492 NW 45th St, Ocala, FL 34482
$-676
Cash flow
-10.1%
Cash-on-Cash Return
3.8%
Cap rate
0.6%
Rent to Value Ratio
Active
$1,399,000
3
bds
|
3
ba
|
2,552
sqft
|
built
2003
1960 NW 73rd Ter, Ocala, FL 34482
$-5,173
Cash flow
-19.3%
Cash-on-Cash Return
1.7%
Cap rate
0.3%
Rent to Value Ratio
Active
$225,900
3
bds
|
2
ba
|
1,011
sqft
|
built
2023
5 Hemlock Trl, Ocala, FL 34472
$-269
Cash flow
-6.2%
Cash-on-Cash Return
4.7%
Cap rate
0.7%
Rent to Value Ratio
Active
$273,000
3
bds
|
2
ba
|
1,345
sqft
|
built
2020
146 Juniper Loop Cir, Ocala, FL 34480
$-587
Cash flow
-11.2%
Cash-on-Cash Return
3.6%
Cap rate
0.6%
Rent to Value Ratio
Active
$229,000
3
bds
|
2
ba
|
1,394
sqft
|
built
1989
15061 SW 28th Terrace Rd, Ocala, FL 34473
$-158
Cash flow
-3.6%
Cash-on-Cash Return
5.3%
Cap rate
0.7%
Rent to Value Ratio
Active
$410,000
4
bds
|
3
ba
|
2,344
sqft
|
built
2021
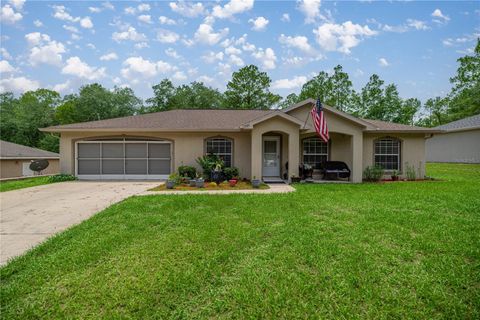
5833 SW 85th Pl, Ocala, FL 34476
$-766
Cash flow
-9.7%
Cash-on-Cash Return
3.9%
Cap rate
0.6%
Rent to Value Ratio
Active
$230,000
3
bds
|
2
ba
|
1,232
sqft
|
built
2007
14939 SW 46th Cir, Ocala, FL 34473
$-295
Cash flow
-6.7%
Cash-on-Cash Return
4.6%
Cap rate
0.7%
Rent to Value Ratio
Active
$476,584
5
bds
|
3
ba
|
2,906
sqft
|
built
1967
1308 SE 18th St, Ocala, FL 34471
$-860
Cash flow
-9.4%
Cash-on-Cash Return
4.0%
Cap rate
0.6%
Rent to Value Ratio

Active
$218,871
3
bds
|
2
ba
|
1,572
sqft
|
built
1979
606 Water Rd, Ocala, FL 34472
$-135
Cash flow
-3.2%
Cash-on-Cash Return
5.4%
Cap rate
0.8%
Rent to Value Ratio

Active
$587,500
8
bds
|
8
ba
|
3,417
sqft
|
built
1985
3050 SE 53rd Ct, Ocala, FL 34480
$-2,672
Cash flow
-23.7%
Cash-on-Cash Return
0.7%
Cap rate
0.2%
Rent to Value Ratio
Active
$385,000
4
bds
|
2
ba
|
1,827
sqft
|
built
2021
8640 SW 49th Cir, Ocala, FL 34476
$-983
Cash flow
-13.3%
Cash-on-Cash Return
3.1%
Cap rate
0.5%
Rent to Value Ratio
Active
$479,900
3
bds
|
3
ba
|
3,390
sqft
|
built
1967
510 SE 19th St, Ocala, FL 34471
$-455
Cash flow
-4.9%
Cash-on-Cash Return
5.0%
Cap rate
0.8%
Rent to Value Ratio
Active
$340,000
3
bds
|
2
ba
|
1,369
sqft
|
built
2020
458 Marion Oaks Trl, Ocala, FL 34473
$-805
Cash flow
-12.4%
Cash-on-Cash Return
3.3%
Cap rate
0.5%
Rent to Value Ratio
Active
$319,000
3
bds
|
2
ba
|
1,486
sqft
|
built
1948
114 NE 11th Ave, Ocala, FL 34470
$-348
Cash flow
-5.7%
Cash-on-Cash Return
4.8%
Cap rate
0.7%
Rent to Value Ratio
Active
$239,900
3
bds
|
2
ba
|
1,456
sqft
|
built
1998
6475 NW 61st Ave, Ocala, FL 34482
$-270
Cash flow
-5.9%
Cash-on-Cash Return
4.8%
Cap rate
0.7%
Rent to Value Ratio
Active
$228,750
3
bds
|
2
ba
|
1,392
sqft
|
built
1981
37 Oak Loop, Ocala, FL 34472
$-249
Cash flow
-5.7%
Cash-on-Cash Return
4.8%
Cap rate
0.7%
Rent to Value Ratio
Active
$595,000
3
bds
|
2
ba
|
2,178
sqft
|
built
2006
10600 SE 32nd Ave, Ocala, FL 34480
$-1,398
Cash flow
-12.3%
Cash-on-Cash Return
3.3%
Cap rate
0.5%
Rent to Value Ratio

Active
$249,900
3
bds
|
2
ba
|
1,672
sqft
|
built
1995
37 Pecan Pass Trl, Ocala, FL 34472
$-208
Cash flow
-4.3%
Cash-on-Cash Return
5.1%
Cap rate
0.7%
Rent to Value Ratio
Active
$204,900
2
bds
|
2
ba
|
1,120
sqft
|
built
1974
499 Water Rd, Ocala, FL 34472
$3
Cash flow
0.1%
Cash-on-Cash Return
6.2%
Cap rate
0.8%
Rent to Value Ratio
Active
$260,000
3
bds
|
2
ba
|
1,563
sqft
|
built
2005
14091 SW 32nd Terrace Rd, Ocala, FL 34473
$-510
Cash flow
-10.2%
Cash-on-Cash Return
3.8%
Cap rate
0.6%
Rent to Value Ratio
Active
$539,000
3
bds
|
3
ba
|
2,652
sqft
|
built
2017
5024 SW 114th Street Rd, Ocala, FL 34476
$-1,356
Cash flow
-13.1%
Cash-on-Cash Return
3.1%
Cap rate
0.5%
Rent to Value Ratio