Carter County Investment Properties for Sale
Browse homes for sale and investment properties in Carter County. Refine your search by price, property type, or more.
Best cash flowing properties in Carter County
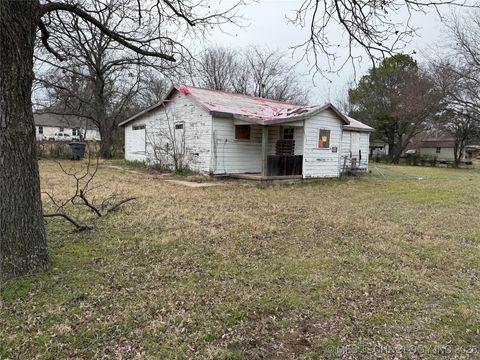
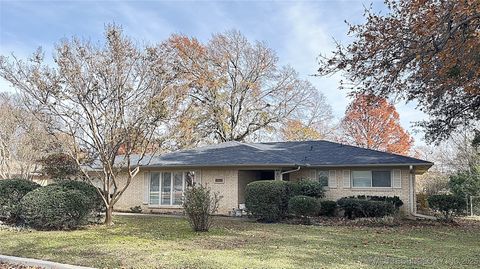
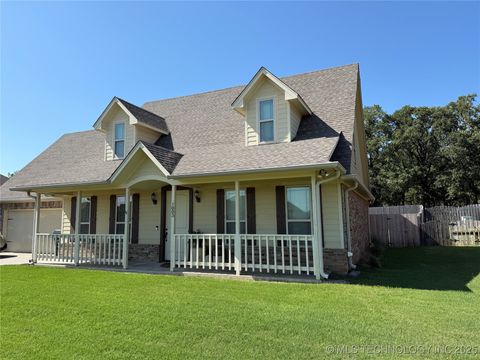
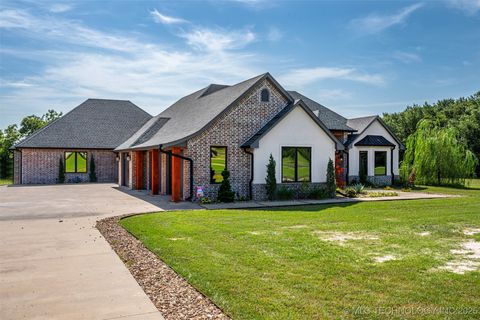
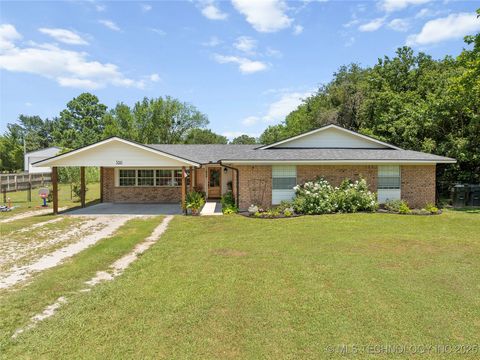
Active
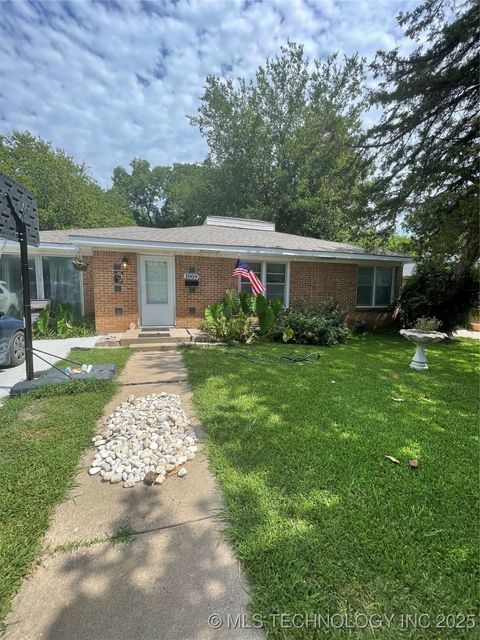
$39,008
2
bds
|
1
ba
|
1,132
sqft
|
built
1932
923 E Main St, Ardmore, OK 73401
$587
Cash flow
17.5%
Cash-on-Cash Return
18.1%
Cap rate
2.3%
Rent to Value Ratio
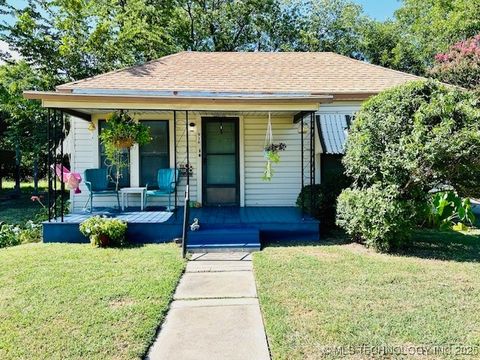
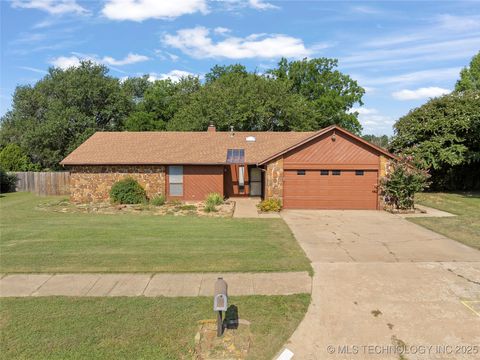
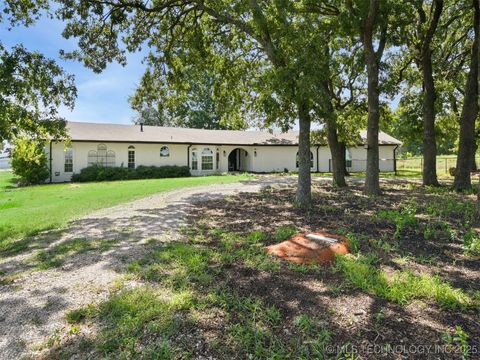
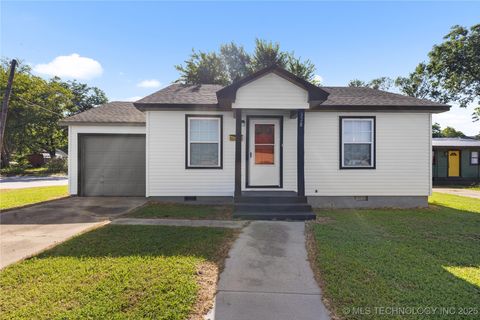
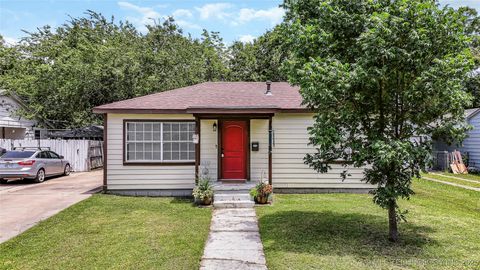
Active
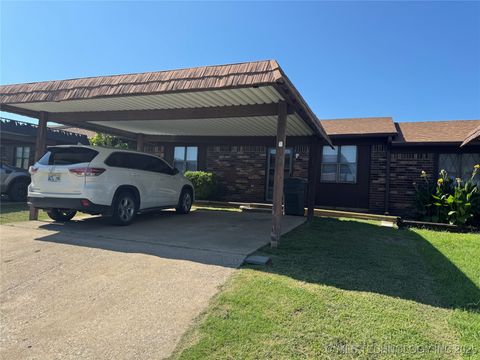
$99,500
2
bds
|
1
ba
|
1,117
sqft
|
built
1951
916 US Highway 70 A, Wilson, OK 73463
$376
Cash flow
19.7%
Cash-on-Cash Return
10.2%
Cap rate
1.3%
Rent to Value Ratio
111 out of 148 properties for sale in Carter County
Limited Results Shown
Create a free account, or log in to reveal all property listings and enjoy the complete experience.
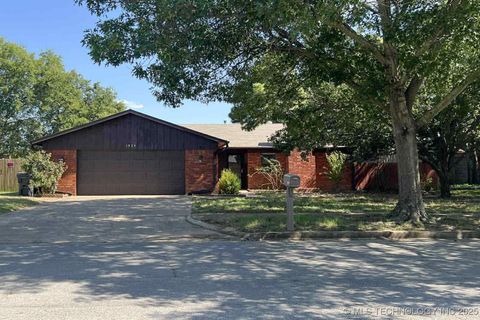
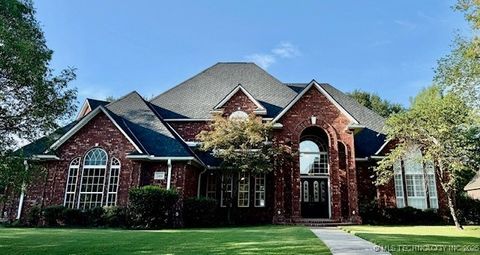
Active
$184,900
3
bds
|
2
ba
|
1,868
sqft
|
built
1932
322 C St SW, Ardmore, OK 73401
$139
Cash flow
3.9%
Cash-on-Cash Return
6.6%
Cap rate
0.9%
Rent to Value Ratio
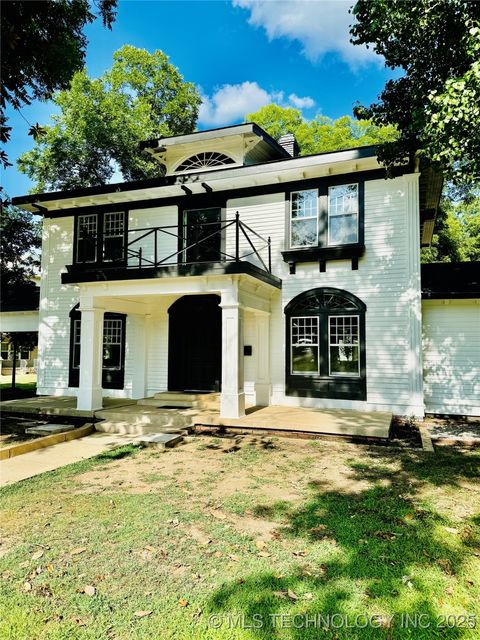
Active
$230,000
3
bds
|
3
ba
|
2,058
sqft
|
built
1950
714 10th Ave NW, Ardmore, OK 73401
$-361
Cash flow
-8.2%
Cash-on-Cash Return
3.8%
Cap rate
0.5%
Rent to Value Ratio
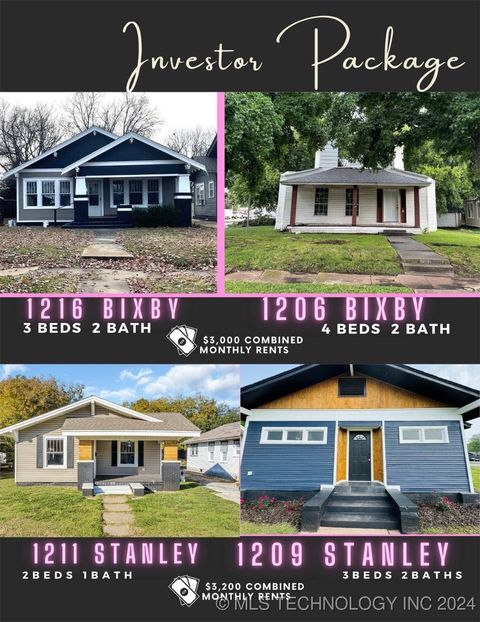
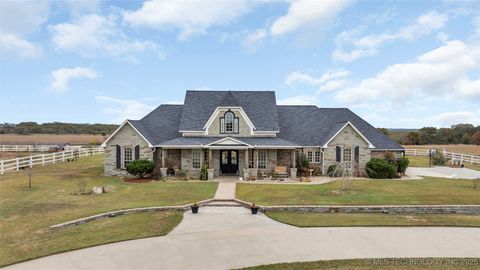
Active
$625,000
2
bds
|
1
ba
|
2,237
sqft
|
built
1935
1206 Bixby St, Ardmore, OK 73401
$-1,522
Cash flow
-12.7%
Cash-on-Cash Return
2.8%
Cap rate
0.4%
Rent to Value Ratio
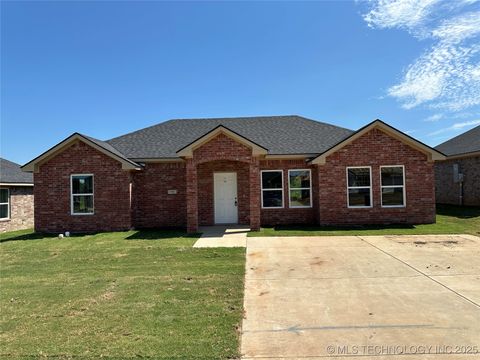
Active
$254,900
3
bds
|
2
ba
|
1,667
sqft
|
built
2022
1125 Champion Way, Ardmore, OK 73401
$-304
Cash flow
-6.2%
Cash-on-Cash Return
4.2%
Cap rate
0.6%
Rent to Value Ratio
Active
$495,000
4
bds
|
5
ba
|
3,807
sqft
|
built
1964
2212 Cloverleaf Pl, Ardmore, OK 73401
$-778
Cash flow
-8.2%
Cash-on-Cash Return
3.8%
Cap rate
0.6%
Rent to Value Ratio
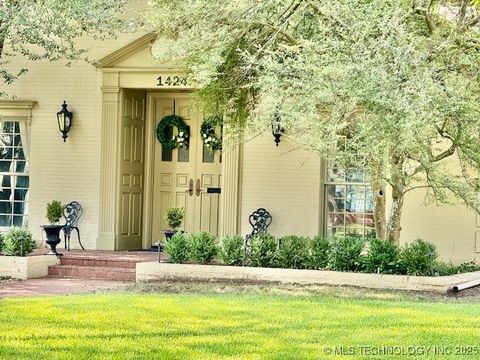
Active
$639,900
2
bds
|
4
ba
|
3,854
sqft
|
built
1973
1424 Stanley St SW, Ardmore, OK 73401
$-1,564
Cash flow
-12.8%
Cash-on-Cash Return
2.7%
Cap rate
0.4%
Rent to Value Ratio
Active
$265,000
3
bds
|
2
ba
|
1,596
sqft
|
built
1981
1924 9th Ave NW, Ardmore, OK 73401
$-533
Cash flow
-10.5%
Cash-on-Cash Return
3.3%
Cap rate
0.5%
Rent to Value Ratio
Active
$675,000
4
bds
|
3
ba
|
3,000
sqft
|
built
2020
30 Lobo Ln, Lone Grove, OK 73443
$-1,843
Cash flow
-14.2%
Cash-on-Cash Return
2.4%
Cap rate
0.4%
Rent to Value Ratio
Active
$393,000
3
bds
|
2
ba
|
1,710
sqft
|
built
2014
199 Classic Rd, Ardmore, OK 73401
$-823
Cash flow
-10.9%
Cash-on-Cash Return
3.2%
Cap rate
0.5%
Rent to Value Ratio
Active
$319,900
4
bds
|
2
ba
|
1,822
sqft
|
built
2002
1602 Tara Dr, Ardmore, OK 73401
$-468
Cash flow
-7.6%
Cash-on-Cash Return
3.9%
Cap rate
0.6%
Rent to Value Ratio
Active
$735,000
4
bds
|
4
ba
|
3,546
sqft
|
built
2010
4598 Kings Rd, Ardmore, OK 73401
$-1,628
Cash flow
-11.6%
Cash-on-Cash Return
3.0%
Cap rate
0.5%
Rent to Value Ratio
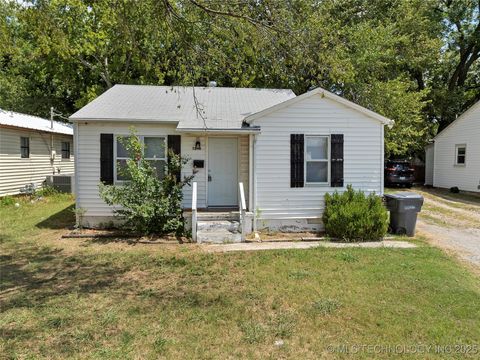
Active
$110,000
2
bds
|
1
ba
|
1,000
sqft
|
built
1950
1218 G St NW, Ardmore, OK 73401
$116
Cash flow
5.5%
Cash-on-Cash Return
6.9%
Cap rate
0.9%
Rent to Value Ratio
Active
$268,000
4
bds
|
3
ba
|
2,196
sqft
|
built
1975
1919 10th Ave NW, Ardmore, OK 73401
$-206
Cash flow
-4.0%
Cash-on-Cash Return
4.8%
Cap rate
0.7%
Rent to Value Ratio
Active
$187,900
4
bds
|
1
ba
|
1,458
sqft
|
built
1970
86 Wisteria St, Lone Grove, OK 73443
$-46
Cash flow
-1.3%
Cash-on-Cash Return
5.4%
Cap rate
0.7%
Rent to Value Ratio
Active
$239,500
3
bds
|
2
ba
|
1,450
sqft
|
built
1977
917 Cheyenne St, Ardmore, OK 73401
$-277
Cash flow
-6.0%
Cash-on-Cash Return
4.3%
Cap rate
0.6%
Rent to Value Ratio
Active
$499,000
3
bds
|
3
ba
|
1,736
sqft
|
built
1978
656 Evergreen St, Lone Grove, OK 73443
$-1,147
Cash flow
-12.0%
Cash-on-Cash Return
2.9%
Cap rate
0.4%
Rent to Value Ratio
Active
$329,900
4
bds
|
3
ba
|
2,356
sqft
|
built
1979
2208 Hickory Dr, Ardmore, OK 73401
$-452
Cash flow
-7.1%
Cash-on-Cash Return
4.0%
Cap rate
0.6%
Rent to Value Ratio
Active
$400,000
1
bds
|
1
ba
|
680
sqft
|
built
2018
678 Bethel Rd, Ardmore, OK 73401
$-847
Cash flow
-11.0%
Cash-on-Cash Return
3.1%
Cap rate
0.4%
Rent to Value Ratio

Active
$748,500
3
bds
|
3
ba
|
3,854
sqft
|
built
1979
204 Bear Hollow Rd, Wilson, OK 73463
$-1,862
Cash flow
-13.0%
Cash-on-Cash Return
2.7%
Cap rate
0.4%
Rent to Value Ratio
Active
$269,900
4
bds
|
2
ba
|
1,970
sqft
|
built
1960
814 Pershing Dr E, Ardmore, OK 73401
$-271
Cash flow
-5.2%
Cash-on-Cash Return
4.5%
Cap rate
0.6%
Rent to Value Ratio
Active
$695,000
4
bds
|
3
ba
|
2,667
sqft
|
built
1978
1348 Gene Autry Rd, Ardmore, OK 73401
$-1,280
Cash flow
-9.6%
Cash-on-Cash Return
3.5%
Cap rate
0.5%
Rent to Value Ratio
Active
$115,000
2
bds
|
1
ba
|
1,055
sqft
|
built
1950
413 11th Ave NW, Ardmore, OK 73401
$128
Cash flow
5.8%
Cash-on-Cash Return
7.0%
Cap rate
1.0%
Rent to Value Ratio
Active
$310,000
4
bds
|
2
ba
|
1,835
sqft
|
built
1974
402 Beaumont Dr, Ardmore, OK 73401
$-511
Cash flow
-8.6%
Cash-on-Cash Return
3.7%
Cap rate
0.5%
Rent to Value Ratio
Active
$115,000
3
bds
|
1
ba
|
1,492
sqft
|
built
1950
1009 Davis St NW, Ardmore, OK 73401
$323
Cash flow
14.7%
Cash-on-Cash Return
9.0%
Cap rate
1.2%
Rent to Value Ratio
Active
$124,900
2
bds
|
2
ba
|
1,056
sqft
|
built
1984
1626 N Cedar Loop, Ardmore, OK 73401
$12
Cash flow
0.5%
Cash-on-Cash Return
5.8%
Cap rate
0.8%
Rent to Value Ratio
Active
$198,000
3
bds
|
2
ba
|
1,450
sqft
|
built
1955
1737 Winchester St, Ardmore, OK 73401
$-51
Cash flow
-1.3%
Cash-on-Cash Return
5.4%
Cap rate
0.7%
Rent to Value Ratio
Active
$129,900
3
bds
|
2
ba
|
1,334
sqft
|
built
1975
36 Scott St, Healdton, OK 73438
$48
Cash flow
1.9%
Cash-on-Cash Return
6.1%
Cap rate
0.8%
Rent to Value Ratio
Active
$316,000
3
bds
|
3
ba
|
1,990
sqft
|
built
2013
1003 Stone Creek Dr, Ardmore, OK 73401
$-536
Cash flow
-8.8%
Cash-on-Cash Return
3.6%
Cap rate
0.6%
Rent to Value Ratio
Active
$598,900
4
bds
|
4
ba
|
4,174
sqft
|
built
1998
2410 Augusta Rd, Ardmore, OK 73401
$-1,175
Cash flow
-10.2%
Cash-on-Cash Return
3.3%
Cap rate
0.5%
Rent to Value Ratio
Active
$175,000
3
bds
|
2
ba
|
1,308
sqft
|
built
2025
513 Frisco Ln, Ardmore, OK 73401
$0
Cash flow
0.0%
Cash-on-Cash Return
5.7%
Cap rate
0.7%
Rent to Value Ratio
Active
$520,000
5
bds
|
3
ba
|
3,167
sqft
|
built
1932
214 E St SW, Ardmore, OK 73401
$-1,437
Cash flow
-14.4%
Cash-on-Cash Return
2.4%
Cap rate
0.4%
Rent to Value Ratio
Active
$950,000
5
bds
|
5
ba
|
5,386
sqft
|
built
2016
39 Tuscan Rd, Ardmore, OK 73401
$-3,194
Cash flow
-17.5%
Cash-on-Cash Return
1.6%
Cap rate
0.3%
Rent to Value Ratio
Active
$99,999
2
bds
|
1
ba
|
700
sqft
|
built
1950
328 G St NW, Ardmore, OK 73401
$285
Cash flow
14.9%
Cash-on-Cash Return
9.1%
Cap rate
1.2%
Rent to Value Ratio
Active
$129,900
2
bds
|
1
ba
|
928
sqft
|
built
1950
818 Northwest Blvd, Ardmore, OK 73401
$152
Cash flow
6.1%
Cash-on-Cash Return
7.1%
Cap rate
1.0%
Rent to Value Ratio
Active
$185,000
3
bds
|
2
ba
|
1,426
sqft
|
built
2005
1120 G St SW, Ardmore, OK 73401
$-54
Cash flow
-1.5%
Cash-on-Cash Return
5.3%
Cap rate
0.8%
Rent to Value Ratio
Active
$259,000
3
bds
|
2
ba
|
1,800
sqft
|
built
1979
386 Sycamore St, Ardmore, OK 73401
$-322
Cash flow
-6.5%
Cash-on-Cash Return
4.2%
Cap rate
0.6%
Rent to Value Ratio
Active
$165,000
3
bds
|
1
ba
|
1,124
sqft
|
built
1950
1412 Healdton Blvd, Ardmore, OK 73401
$109
Cash flow
3.4%
Cash-on-Cash Return
6.5%
Cap rate
0.8%
Rent to Value Ratio
Active
$164,900
3
bds
|
3
ba
|
2,000
sqft
|
built
1975
924 Manor Mall, Ardmore, OK 73401
$33
Cash flow
1.0%
Cash-on-Cash Return
5.9%
Cap rate
0.8%
Rent to Value Ratio