Cherokee County Investment Properties for Sale
Browse homes for sale and investment properties in Cherokee County. Refine your search by price, property type, or more.
Best cash flowing properties in Cherokee County
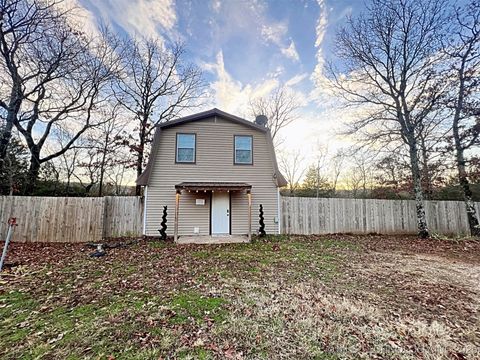
Active
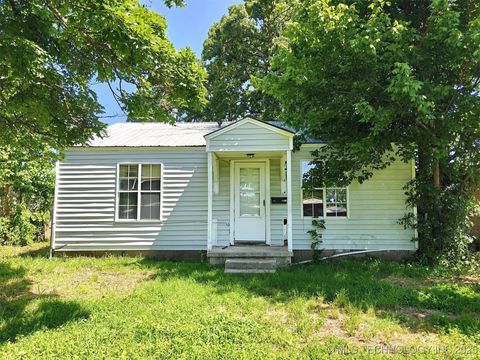
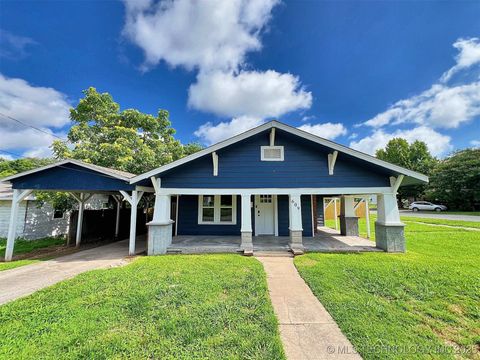
$74,900
3
bds
|
1
ba
|
1,140
sqft
|
built
1950
619 E Cherrie St, Tahlequah, OK 74464
$729
Cash flow
11.3%
Cash-on-Cash Return
11.7%
Cap rate
1.5%
Rent to Value Ratio
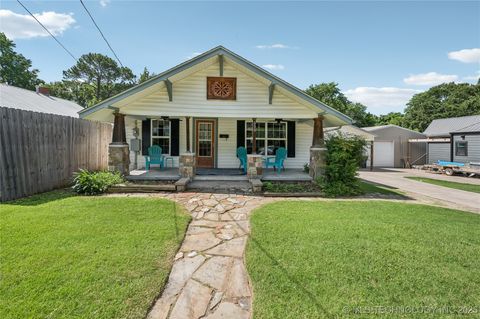
Active
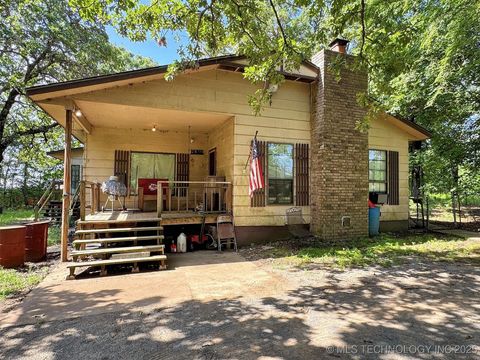
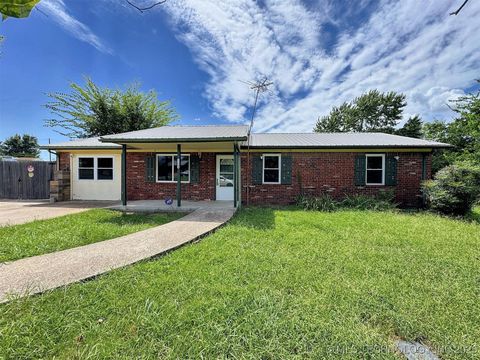
$180,000
3
bds
|
2
ba
|
2,070
sqft
|
built
1983
24196 N 4 Mile Rd, Fort Gibson, OK 74434
$25
Cash flow
0.7%
Cash-on-Cash Return
5.8%
Cap rate
0.8%
Rent to Value Ratio
80 out of 147 properties for sale in Cherokee County
Limited Results Shown
Create a free account, or log in to reveal all property listings and enjoy the complete experience.
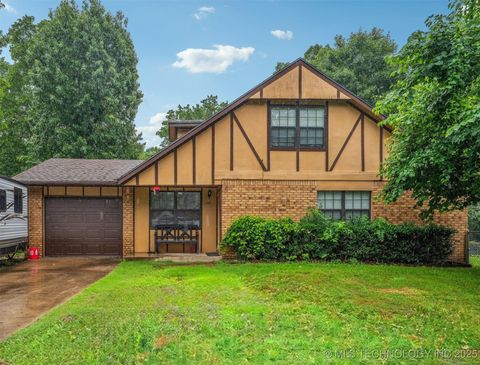
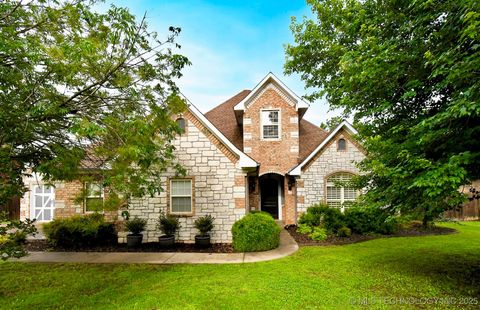
Active
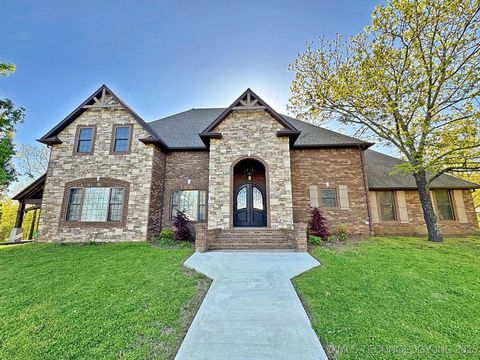
$1,150,000
4
bds
|
6
ba
|
5,236
sqft
|
built
2012
21149 S Highway View Dr, Tahlequah, OK 74464
$-3,616
Cash flow
-16.4%
Cash-on-Cash Return
1.9%
Cap rate
0.3%
Rent to Value Ratio
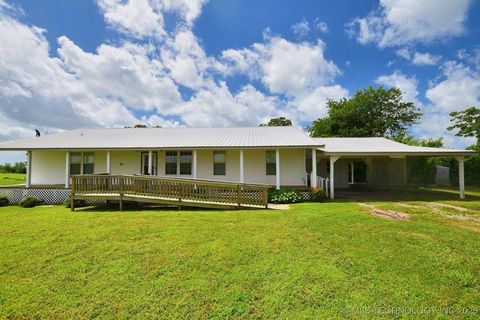
Active
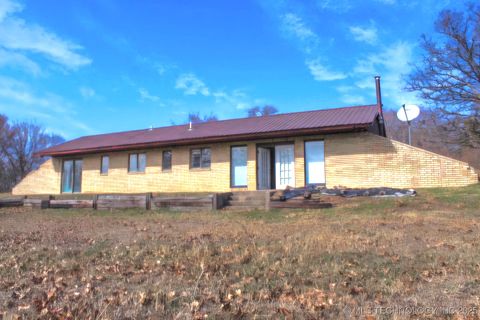
$429,000
2
bds
|
2
ba
|
1,220
sqft
|
built
1985
5452 W 730 Rd, Hulbert, OK 74441
$-1,151
Cash flow
-14.0%
Cash-on-Cash Return
2.5%
Cap rate
0.3%
Rent to Value Ratio
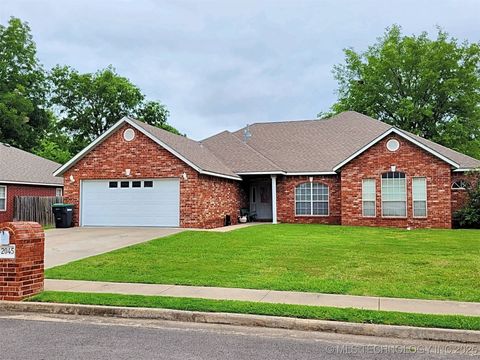
Active
$335,000
3
bds
|
3
ba
|
2,390
sqft
|
built
2000
2045 Aspen Dr, Tahlequah, OK 74464
$-658
Cash flow
-10.2%
Cash-on-Cash Return
3.3%
Cap rate
0.5%
Rent to Value Ratio
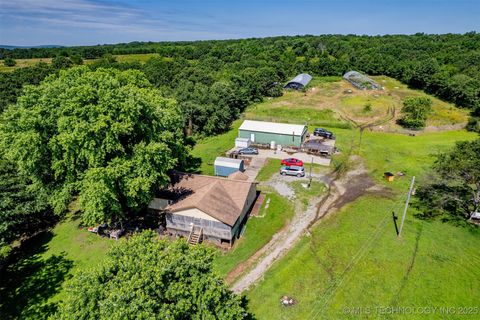
Active
$197,000
4
bds
|
2
ba
|
1,480
sqft
|
built
1965
21245 W 888 Rd, Cookson, OK 74427
$-12
Cash flow
-0.3%
Cash-on-Cash Return
5.6%
Cap rate
0.7%
Rent to Value Ratio
Active
$499,900
3
bds
|
2
ba
|
2,085
sqft
|
built
1999
30981 S 520 Rd, Park Hill, OK 74451
$-776
Cash flow
-8.1%
Cash-on-Cash Return
3.8%
Cap rate
0.5%
Rent to Value Ratio
Active
$315,000
4
bds
|
3
ba
|
2,650
sqft
|
built
1981
201 Sandy Cir, Tahlequah, OK 74464
$-435
Cash flow
-7.2%
Cash-on-Cash Return
4.0%
Cap rate
0.6%
Rent to Value Ratio
Active
$206,800
2
bds
|
2
ba
|
1,080
sqft
|
built
1987
15261 W Carlisle Cir, Park Hill, OK 74451
$-126
Cash flow
-3.2%
Cash-on-Cash Return
4.9%
Cap rate
0.6%
Rent to Value Ratio
Active
$225,000
3
bds
|
2
ba
|
1,476
sqft
|
built
1926
606 Goingsnake St, Tahlequah, OK 74464
$-294
Cash flow
-6.8%
Cash-on-Cash Return
4.1%
Cap rate
0.5%
Rent to Value Ratio
Active
$199,500
3
bds
|
2
ba
|
1,467
sqft
|
built
1979
1105 S Maple Ave, Tahlequah, OK 74464
$-101
Cash flow
-2.6%
Cash-on-Cash Return
5.1%
Cap rate
0.7%
Rent to Value Ratio
Active
$299,900
4
bds
|
2
ba
|
1,920
sqft
|
built
1985
16759 W Burchett Rd, Tahlequah, OK 74464
$-552
Cash flow
-9.6%
Cash-on-Cash Return
3.5%
Cap rate
0.5%
Rent to Value Ratio
Active
$244,500
4
bds
|
2
ba
|
2,113
sqft
|
built
1925
609 E Ward St, Tahlequah, OK 74464
$-257
Cash flow
-5.5%
Cash-on-Cash Return
4.4%
Cap rate
0.7%
Rent to Value Ratio
Active
$193,500
4
bds
|
2
ba
|
1,400
sqft
|
built
1974
17564 W Grandview Dr, Tahlequah, OK 74464
$-157
Cash flow
-4.2%
Cash-on-Cash Return
4.7%
Cap rate
0.6%
Rent to Value Ratio
Active
$345,000
3
bds
|
1
ba
|
1,500
sqft
|
built
1994
15171 N Lost City Rd, Hulbert, OK 74441
$-658
Cash flow
-10.0%
Cash-on-Cash Return
3.4%
Cap rate
0.5%
Rent to Value Ratio

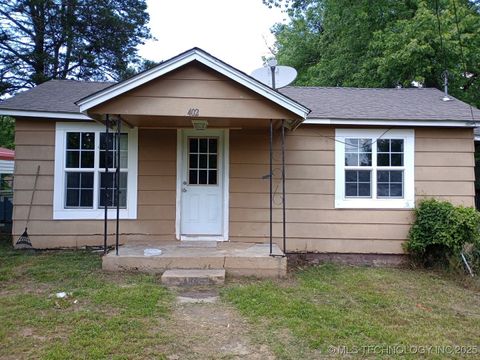
Active
$185,000
3
bds
|
2
ba
|
1,250
sqft
|
built
1950
916 Coy Ave, Tahlequah, OK 74464
$-223
Cash flow
-6.3%
Cash-on-Cash Return
4.2%
Cap rate
0.5%
Rent to Value Ratio
Active
$475,000
4
bds
|
4
ba
|
3,170
sqft
|
built
2007
2463 S Park Hill Rd, Tahlequah, OK 74464
$-1,002
Cash flow
-11.0%
Cash-on-Cash Return
3.1%
Cap rate
0.5%
Rent to Value Ratio
Active
$177,800
3
bds
|
2
ba
|
1,369
sqft
|
built
1965
1107 Hillcrest Ave, Tahlequah, OK 74464
$-201
Cash flow
-5.9%
Cash-on-Cash Return
4.3%
Cap rate
0.6%
Rent to Value Ratio
Active
$169,000
3
bds
|
1
ba
|
956
sqft
|
built
1998
14274 W Clyde Maher Rd, Tahlequah, OK 74464
$-131
Cash flow
-4.0%
Cash-on-Cash Return
4.8%
Cap rate
0.6%
Rent to Value Ratio
Active
$228,000
4
bds
|
2
ba
|
1,616
sqft
|
built
1970
21887 Coffee Hollow Rd, Tahlequah, OK 74464
$-286
Cash flow
-6.5%
Cash-on-Cash Return
4.2%
Cap rate
0.6%
Rent to Value Ratio
Active
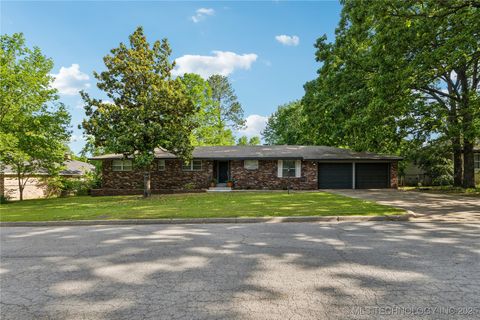
$329,900
3
bds
|
2
ba
|
2,400
sqft
|
built
1965
717 N Oklahoma Ave, Tahlequah, OK 74464
$-644
Cash flow
-10.2%
Cash-on-Cash Return
3.3%
Cap rate
0.5%
Rent to Value Ratio
Active
$389,900
4
bds
|
3
ba
|
2,246
sqft
|
built
1989
990 Turney Ave, Tahlequah, OK 74464
$-937
Cash flow
-12.5%
Cash-on-Cash Return
2.8%
Cap rate
0.4%
Rent to Value Ratio
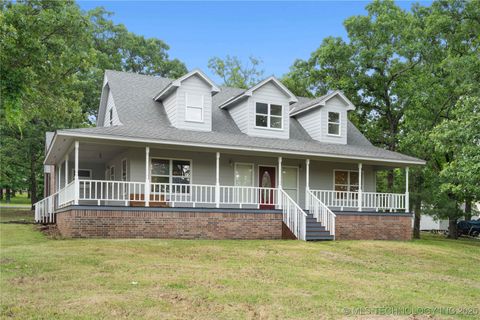
Active
$489,000
4
bds
|
3
ba
|
2,390
sqft
|
built
2007
20988 Ranger Rd, Fort Gibson, OK 74434
$-1,347
Cash flow
-14.4%
Cash-on-Cash Return
2.4%
Cap rate
0.3%
Rent to Value Ratio
Active
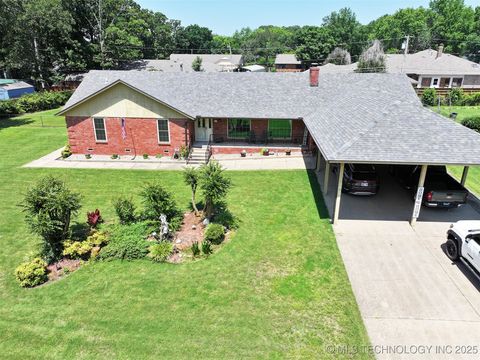
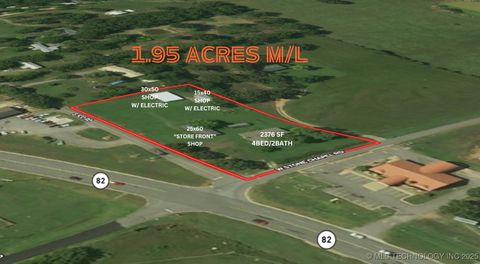
$337,700
4
bds
|
2
ba
|
2,376
sqft
|
built
1965
26037 S 520th Rd, Park Hill, OK 74451
$-312
Cash flow
-4.8%
Cash-on-Cash Return
4.6%
Cap rate
0.6%
Rent to Value Ratio
Active
$166,900
2
bds
|
1
ba
|
768
sqft
|
built
1964
226 W Seneca St, Tahlequah, OK 74464
$-64
Cash flow
-2.0%
Cash-on-Cash Return
5.2%
Cap rate
0.7%
Rent to Value Ratio
Active
$749,000
4
bds
|
4
ba
|
3,384
sqft
|
built
1970
18341 W Woodhaven Dr, Cookson, OK 74427
$-3,430
Cash flow
-23.9%
Cash-on-Cash Return
0.2%
Cap rate
0.2%
Rent to Value Ratio
Active
$284,900
6
bds
|
3
ba
|
2,350
sqft
|
built
1955
215 S Maple Ave, Tahlequah, OK 74464
$-315
Cash flow
-5.8%
Cash-on-Cash Return
4.4%
Cap rate
0.6%
Rent to Value Ratio
Active
$174,000
3
bds
|
2
ba
|
1,436
sqft
|
built
1945
528 S Muskogee Ave, Tahlequah, OK 74464
$9
Cash flow
0.3%
Cash-on-Cash Return
5.7%
Cap rate
0.7%
Rent to Value Ratio
Active
$1,250,000
3
bds
|
3
ba
|
3,778
sqft
|
built
1978
20119 E Willis Rd, Tahlequah, OK 74464
$-4,747
Cash flow
-19.8%
Cash-on-Cash Return
1.1%
Cap rate
0.2%
Rent to Value Ratio
Active
$404,500
2
bds
|
2
ba
|
1,838
sqft
|
built
2009
20413 E Allen Rd, Tahlequah, OK 74464
$-693
Cash flow
-8.9%
Cash-on-Cash Return
3.6%
Cap rate
0.5%
Rent to Value Ratio
Active
$1,500,000
4
bds
|
4
ba
|
2,684
sqft
|
built
2009
21745 E 660 Rd, Tahlequah, OK 74464
$-5,910
Cash flow
-20.6%
Cash-on-Cash Return
1.0%
Cap rate
0.1%
Rent to Value Ratio
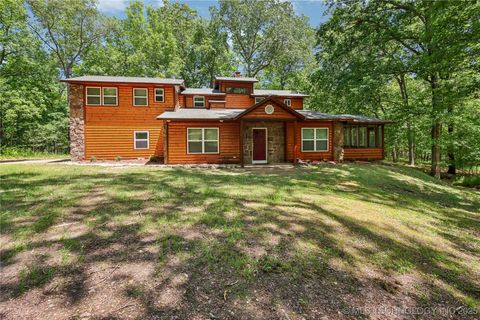
Active
$520,000
4
bds
|
3
ba
|
3,679
sqft
|
built
1985
31663 S 530 Rd, Cookson, OK 74427
$-677
Cash flow
-6.8%
Cash-on-Cash Return
4.1%
Cap rate
0.5%
Rent to Value Ratio
Active
$480,000
4
bds
|
4
ba
|
3,687
sqft
|
built
1999
103 S Harrison Ave, Tahlequah, OK 74464
$-1,083
Cash flow
-11.8%
Cash-on-Cash Return
3.0%
Cap rate
0.5%
Rent to Value Ratio
Active
$355,000
3
bds
|
2
ba
|
2,296
sqft
|
built
1994
3293 W Southern Ave, Hulbert, OK 74441
$-374
Cash flow
-5.5%
Cash-on-Cash Return
4.4%
Cap rate
0.6%
Rent to Value Ratio
Active
$275,000
2
bds
|
1
ba
|
800
sqft
|
built
2015
19983 W Chicken Creek Rd, Cookson, OK 74427
$-41
Cash flow
-0.8%
Cash-on-Cash Return
5.5%
Cap rate
0.7%
Rent to Value Ratio
Active
$1,200,000
8
bds
|
10
ba
|
6,398
sqft
|
built
2007
20965 W 921 Rd, Cookson, OK 74427
$-4,865
Cash flow
-21.2%
Cash-on-Cash Return
0.8%
Cap rate
0.2%
Rent to Value Ratio
Active
$210,000
3
bds
|
2
ba
|
1,427
sqft
|
built
2002
260 Hickory Dr, Tahlequah, OK 74464
$-84
Cash flow
-2.1%
Cash-on-Cash Return
5.2%
Cap rate
0.7%
Rent to Value Ratio
Active
$279,500
3
bds
|
3
ba
|
1,683
sqft
|
built
1976
802 E Seneca St, Tahlequah, OK 74464
$-467
Cash flow
-8.7%
Cash-on-Cash Return
3.7%
Cap rate
0.5%
Rent to Value Ratio
Active
$102,500
3
bds
|
1
ba
|
945
sqft
|
built
1950
402 Minor St, Tahlequah, OK 74464
$22
Cash flow
1.1%
Cash-on-Cash Return
5.9%
Cap rate
0.8%
Rent to Value Ratio
Active
$369,900
5
bds
|
5
ba
|
2,863
sqft
|
built
1983
206 Alder Way, Tahlequah, OK 74464
$-721
Cash flow
-10.2%
Cash-on-Cash Return
3.3%
Cap rate
0.4%
Rent to Value Ratio