Oklahoma County Investment Properties for Sale
Browse homes for sale and investment properties in Oklahoma County. Refine your search by price, property type, or more.
Best cash flowing properties in Oklahoma County
Active
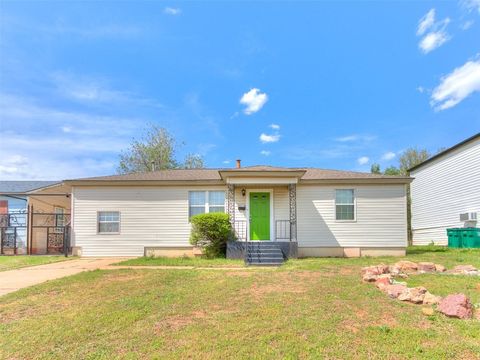
$110,000
2
bds
|
1
ba
|
0
sqft
|
built
1953
3109 NE 15th St, Oklahoma City, OK 73117
$273
Cash flow
12.9%
Cash-on-Cash Return
8.7%
Cap rate
1.1%
Rent to Value Ratio
Active
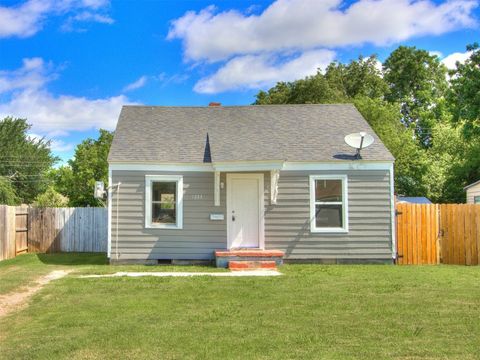
$125,000
2
bds
|
1
ba
|
0
sqft
|
built
1941
1233 SW 34th St, Oklahoma City, OK 73109
$241
Cash flow
10.1%
Cash-on-Cash Return
8.0%
Cap rate
1.0%
Rent to Value Ratio
2,111 out of 2,931 properties for sale in Oklahoma County
Limited Results Shown
Create a free account, or log in to reveal all property listings and enjoy the complete experience.
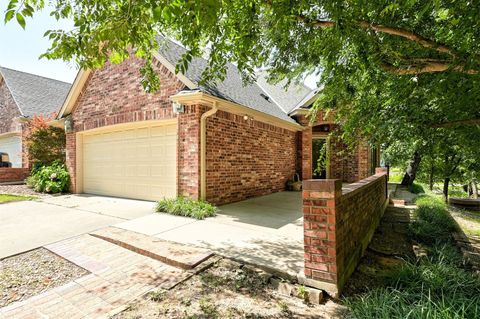
Active
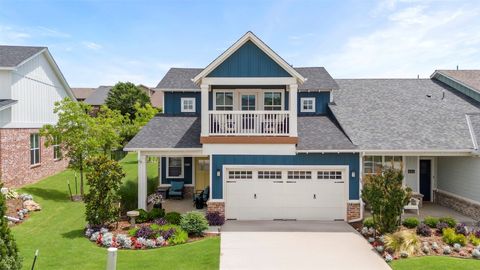
$375,000
3
bds
|
3
ba
|
0
sqft
|
built
2022
620 Harbor Town Dr, Edmond, OK 73034
$-682
Cash flow
-9.5%
Cash-on-Cash Return
4.1%
Cap rate
0.7%
Rent to Value Ratio
Active
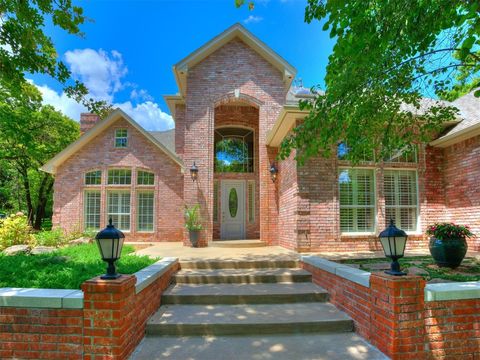
$839,000
4
bds
|
5
ba
|
0
sqft
|
built
1992
3421 Oakdale Forest Rd, Edmond, OK 73013
$-2,942
Cash flow
-18.3%
Cash-on-Cash Return
2.1%
Cap rate
0.4%
Rent to Value Ratio
Active
$335,000
3
bds
|
2
ba
|
0
sqft
|
built
1981
2105 Raintree Rd, Edmond, OK 73013
$-676
Cash flow
-10.5%
Cash-on-Cash Return
3.8%
Cap rate
0.6%
Rent to Value Ratio
Active
$210,000
3
bds
|
1
ba
|
0
sqft
|
built
1935
2229 NW 30th St, Oklahoma City, OK 73112
$-55
Cash flow
-1.4%
Cash-on-Cash Return
5.4%
Cap rate
0.8%
Rent to Value Ratio
Active
$204,000
4
bds
|
2
ba
|
0
sqft
|
built
1951
1529 NE 44th St, Oklahoma City, OK 73111
$-300
Cash flow
-7.7%
Cash-on-Cash Return
3.9%
Cap rate
0.5%
Rent to Value Ratio

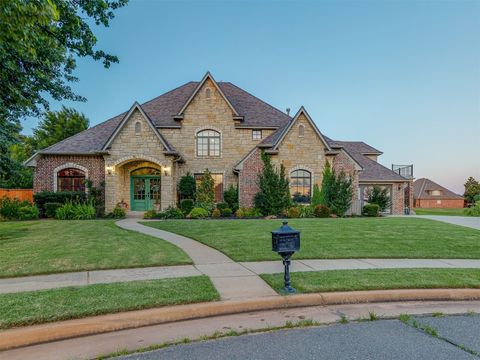
Active
$679,000
3
bds
|
4
ba
|
0
sqft
|
built
2023
2644 NW 57th St, Oklahoma City, OK 73112
$-1,827
Cash flow
-14.0%
Cash-on-Cash Return
3.0%
Cap rate
0.5%
Rent to Value Ratio
Active
$300,000
3
bds
|
2
ba
|
0
sqft
|
built
1976
3405 Still Moon Cir, Edmond, OK 73013
$-454
Cash flow
-7.9%
Cash-on-Cash Return
4.4%
Cap rate
0.7%
Rent to Value Ratio
Active
$535,000
3
bds
|
3
ba
|
0
sqft
|
built
2021
1821 Wheeler St, Oklahoma City, OK 73108
$-1,415
Cash flow
-13.8%
Cash-on-Cash Return
2.5%
Cap rate
0.3%
Rent to Value Ratio
Active
$465,900
4
bds
|
4
ba
|
0
sqft
|
built
2022
2309 El Cajon St, Edmond, OK 73034
$-693
Cash flow
-7.8%
Cash-on-Cash Return
3.9%
Cap rate
0.6%
Rent to Value Ratio
Active
$110,000
2
bds
|
1
ba
|
0
sqft
|
built
1953
3109 NE 15th St, Oklahoma City, OK 73117
$273
Cash flow
12.9%
Cash-on-Cash Return
8.7%
Cap rate
1.1%
Rent to Value Ratio
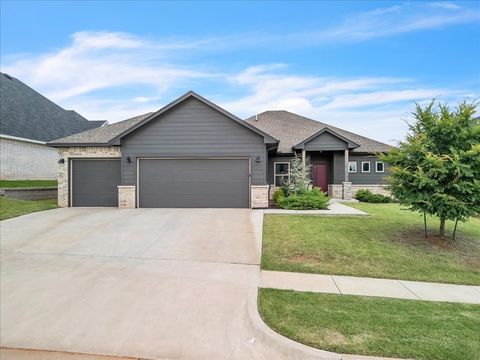
Active
$355,000
3
bds
|
3
ba
|
0
sqft
|
built
2009
8509 NW 111th St, Oklahoma City, OK 73162
$-527
Cash flow
-7.7%
Cash-on-Cash Return
3.9%
Cap rate
0.6%
Rent to Value Ratio
Active
$579,000
3
bds
|
5
ba
|
4,755
sqft
|
built
1980
2202 NW 45th St, Oklahoma City, OK 73112
$-1,474
Cash flow
-13.3%
Cash-on-Cash Return
2.6%
Cap rate
0.4%
Rent to Value Ratio
Active
$264,900
2
bds
|
2
ba
|
0
sqft
|
built
1996
1720 Tenbears Rd, Edmond, OK 73034
$-515
Cash flow
-10.1%
Cash-on-Cash Return
3.9%
Cap rate
0.6%
Rent to Value Ratio
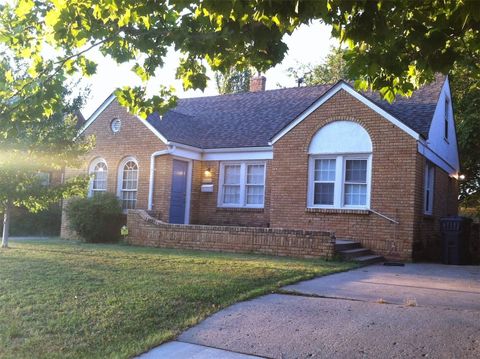
Active
$215,000
2
bds
|
1
ba
|
0
sqft
|
built
1929
2329 NW 22nd St, Oklahoma City, OK 73107
$-217
Cash flow
-5.3%
Cash-on-Cash Return
4.5%
Cap rate
0.6%
Rent to Value Ratio
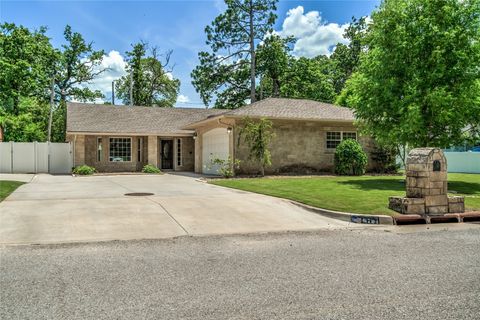
Active
$295,000
3
bds
|
3
ba
|
0
sqft
|
built
1966
6704 Tall Oaks Dr, Oklahoma City, OK 73127
$-168
Cash flow
-3.0%
Cash-on-Cash Return
5.0%
Cap rate
0.7%
Rent to Value Ratio
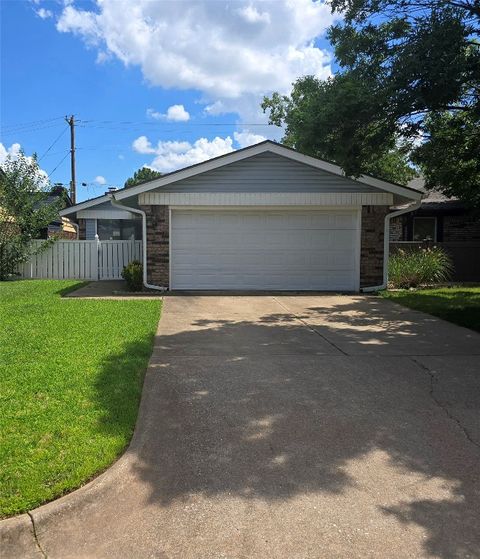
Active
$155,000
2
bds
|
2
ba
|
0
sqft
|
built
1984
5904 Vixen Way, Oklahoma City, OK 73142
$223
Cash flow
7.5%
Cash-on-Cash Return
7.4%
Cap rate
1.0%
Rent to Value Ratio
Active
$140,000
2
bds
|
2
ba
|
0
sqft
|
built
1982
4400 Hemingway Dr, Oklahoma City, OK 73118
$-188
Cash flow
-7.0%
Cash-on-Cash Return
4.1%
Cap rate
0.9%
Rent to Value Ratio
Active
$125,000
2
bds
|
1
ba
|
0
sqft
|
built
1941
1233 SW 34th St, Oklahoma City, OK 73109
$241
Cash flow
10.1%
Cash-on-Cash Return
8.0%
Cap rate
1.0%
Rent to Value Ratio
Active
$150,000
2
bds
|
2
ba
|
0
sqft
|
built
1982
4400 Hemingway Dr, Oklahoma City, OK 73118
$-154
Cash flow
-5.4%
Cash-on-Cash Return
4.4%
Cap rate
0.9%
Rent to Value Ratio
Active
$550,000
3
bds
|
3
ba
|
0
sqft
|
built
1929
814 NE 18th St, Oklahoma City, OK 73105
$-1,502
Cash flow
-14.2%
Cash-on-Cash Return
2.4%
Cap rate
0.3%
Rent to Value Ratio
Active
$514,900
4
bds
|
5
ba
|
0
sqft
|
built
1995
2801 NW 154th St, Edmond, OK 73013
$-868
Cash flow
-8.8%
Cash-on-Cash Return
3.7%
Cap rate
0.5%
Rent to Value Ratio
Active
$669,000
4
bds
|
5
ba
|
0
sqft
|
built
2005
1240 River Chase Dr, Edmond, OK 73025
$-1,852
Cash flow
-14.4%
Cash-on-Cash Return
2.9%
Cap rate
0.5%
Rent to Value Ratio
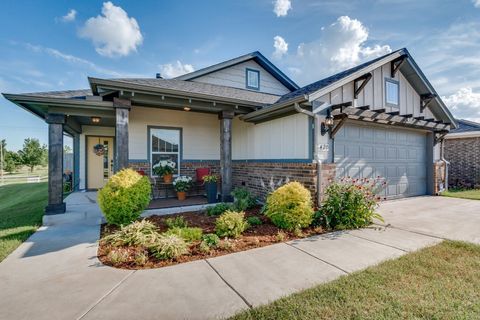
Active
$320,000
3
bds
|
2
ba
|
0
sqft
|
built
2020
7420 NW 159th Ter, Edmond, OK 73013
$-689
Cash flow
-11.2%
Cash-on-Cash Return
3.7%
Cap rate
0.6%
Rent to Value Ratio
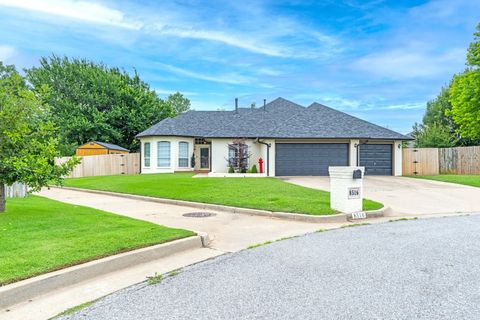
Active
$319,900
3
bds
|
2
ba
|
0
sqft
|
built
2022
6420 SE 88th St, Oklahoma City, OK 73135
$-631
Cash flow
-10.3%
Cash-on-Cash Return
3.3%
Cap rate
0.6%
Rent to Value Ratio
Active
$275,000
3
bds
|
2
ba
|
0
sqft
|
built
1995
8516 NW 116th St, Oklahoma City, OK 73162
$-310
Cash flow
-5.9%
Cash-on-Cash Return
4.3%
Cap rate
0.7%
Rent to Value Ratio
Active
$544,900
5
bds
|
4
ba
|
0
sqft
|
built
1994
6717 NW 111th Ct, Oklahoma City, OK 73162
$-847
Cash flow
-8.1%
Cash-on-Cash Return
3.8%
Cap rate
0.6%
Rent to Value Ratio
Active
$305,000
2
bds
|
2
ba
|
0
sqft
|
built
1941
701 NW 46th St, Oklahoma City, OK 73118
$-386
Cash flow
-6.6%
Cash-on-Cash Return
4.2%
Cap rate
0.7%
Rent to Value Ratio
Active
$260,000
3
bds
|
2
ba
|
0
sqft
|
built
1939
2917 N Venice Blvd, Oklahoma City, OK 73107
$6
Cash flow
0.1%
Cash-on-Cash Return
5.7%
Cap rate
0.7%
Rent to Value Ratio
Active
$535,000
2
bds
|
3
ba
|
0
sqft
|
built
1982
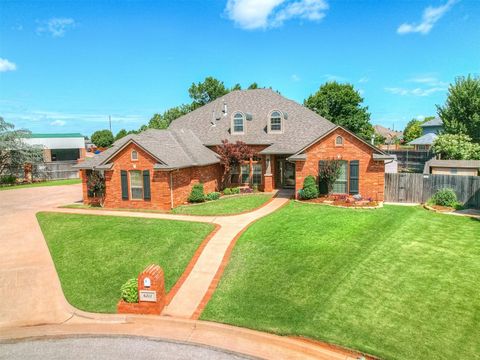
3608 Meadow Lark Ln, Oklahoma City, OK 73120
$-919
Cash flow
-9.0%
Cash-on-Cash Return
3.6%
Cap rate
0.6%
Rent to Value Ratio
Active
$750,000
4
bds
|
3
ba
|
0
sqft
|
built
1933
1001 NW 38th St, Oklahoma City, OK 73118
$-2,660
Cash flow
-18.5%
Cash-on-Cash Return
1.4%
Cap rate
0.3%
Rent to Value Ratio
Active
$699,500
4
bds
|
4
ba
|
0
sqft
|
built
2001
825 Crystal Creek Pl, Edmond, OK 73034
$-1,036
Cash flow
-7.7%
Cash-on-Cash Return
3.9%
Cap rate
0.6%
Rent to Value Ratio
Active
$208,000
2
bds
|
2
ba
|
0
sqft
|
built
1962
4412 NW 57th St, Oklahoma City, OK 73112
$-89
Cash flow
-2.2%
Cash-on-Cash Return
5.2%
Cap rate
0.8%
Rent to Value Ratio
Active
$589,000
4
bds
|
3
ba
|
0
sqft
|
built
2016
13450 Fairway Dr, Choctaw, OK 73020
$-814
Cash flow
-7.2%
Cash-on-Cash Return
4.0%
Cap rate
0.6%
Rent to Value Ratio
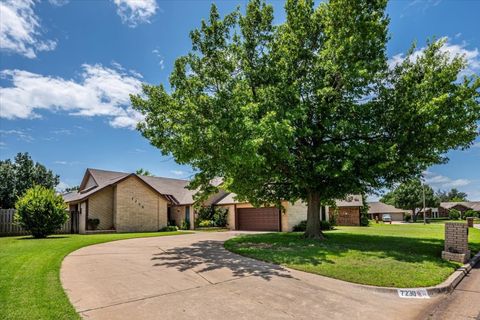
Active
$260,000
3
bds
|
2
ba
|
0
sqft
|
built
1983
7230 Summit Dr, Oklahoma City, OK 73162
$-112
Cash flow
-2.2%
Cash-on-Cash Return
5.2%
Cap rate
0.8%
Rent to Value Ratio
Active
$160,000
4
bds
|
2
ba
|
0
sqft
|
built
1973
5505 S Dimple Dr, Oklahoma City, OK 73135
$209
Cash flow
6.8%
Cash-on-Cash Return
7.2%
Cap rate
0.9%
Rent to Value Ratio
Active
$550,000
4
bds
|
3
ba
|
0
sqft
|
built
2019
6716 Jay Crest Dr, Edmond, OK 73034
$-924
Cash flow
-8.8%
Cash-on-Cash Return
4.2%
Cap rate
0.6%
Rent to Value Ratio
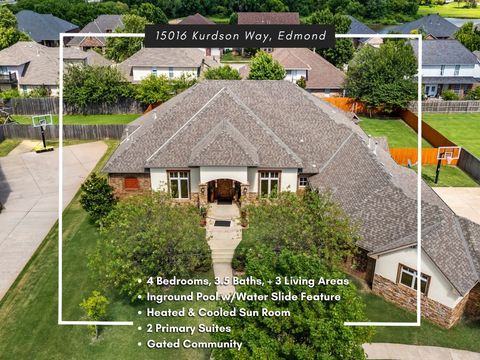
Active
$667,900
4
bds
|
4
ba
|
0
sqft
|
built
2008
15016 Kurdson Way, Edmond, OK 73013
$-1,367
Cash flow
-10.7%
Cash-on-Cash Return
3.2%
Cap rate
0.5%
Rent to Value Ratio
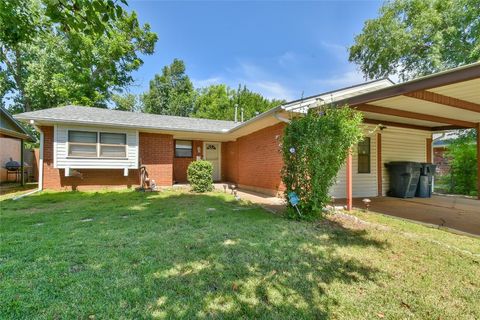
Active
$249,900
3
bds
|
2
ba
|
0
sqft
|
built
1996
5725 SE 86th St, Oklahoma City, OK 73135
$-218
Cash flow
-4.6%
Cash-on-Cash Return
4.6%
Cap rate
0.7%
Rent to Value Ratio

Active
$280,000
3
bds
|
2
ba
|
0
sqft
|
built
1956
9908 Mahler Pl, Oklahoma City, OK 73120
$-371
Cash flow
-6.9%
Cash-on-Cash Return
4.1%
Cap rate
0.6%
Rent to Value Ratio
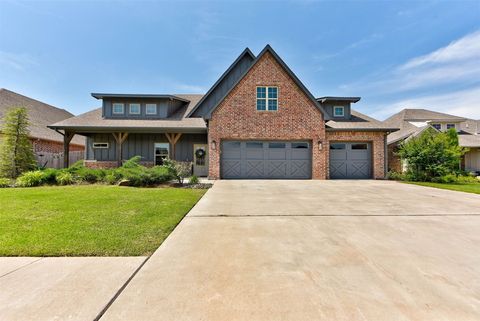
Active
$329,900
4
bds
|
2
ba
|
0
sqft
|
built
2012
19020 Meadows Crossing Dr, Edmond, OK 73012
$-570
Cash flow
-9.0%
Cash-on-Cash Return
4.2%
Cap rate
0.7%
Rent to Value Ratio