Oklahoma County Investment Properties for Sale
Browse homes for sale and investment properties in Oklahoma County. Refine your search by price, property type, or more.
Best cash flowing properties in Oklahoma County
Active
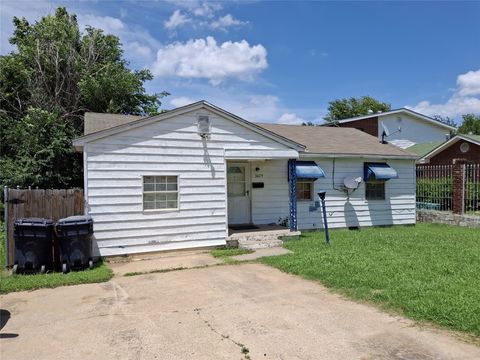
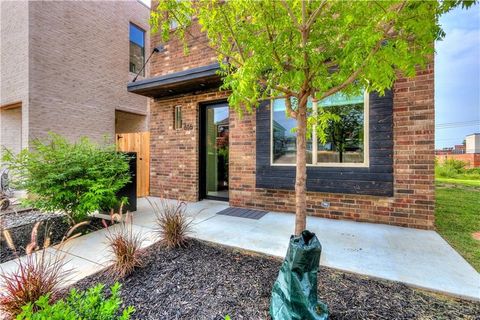
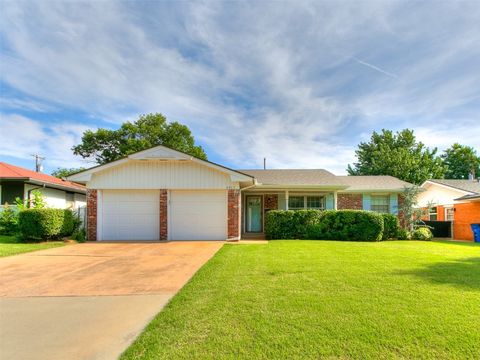
$90,000
2
bds
|
1
ba
|
0
sqft
|
built
1948
3029 NW 28th St, Oklahoma City, OK 73107
$467
Cash flow
27.1%
Cash-on-Cash Return
11.9%
Cap rate
1.6%
Rent to Value Ratio
Active
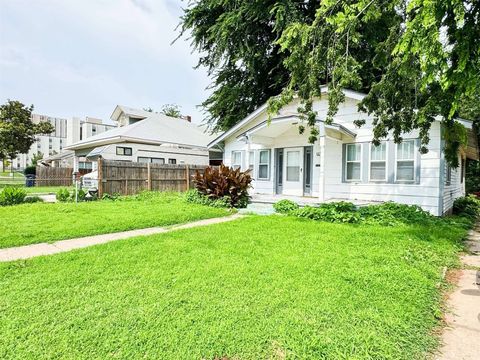
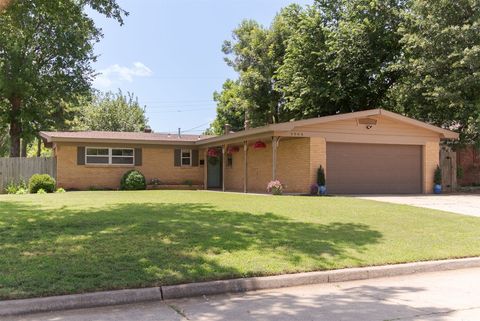
$113,000
2
bds
|
1
ba
|
0
sqft
|
built
1927
1138 N Lottie Ave, Oklahoma City, OK 73117
$250
Cash flow
11.5%
Cash-on-Cash Return
8.3%
Cap rate
1.1%
Rent to Value Ratio
2,111 out of 2,931 properties for sale in Oklahoma County
Limited Results Shown
Create a free account, or log in to reveal all property listings and enjoy the complete experience.
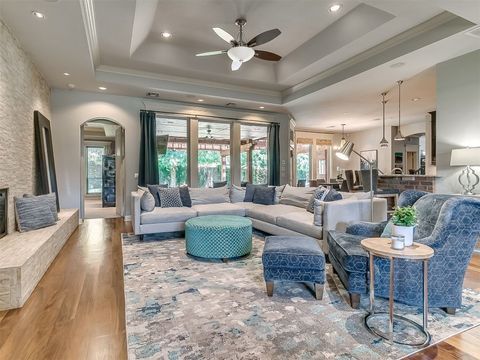
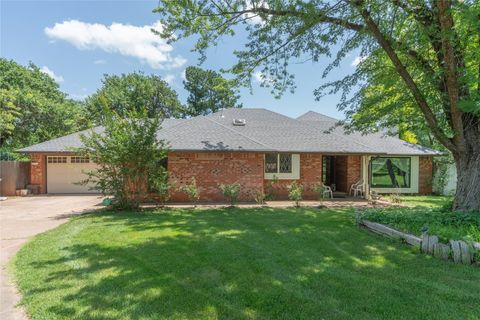
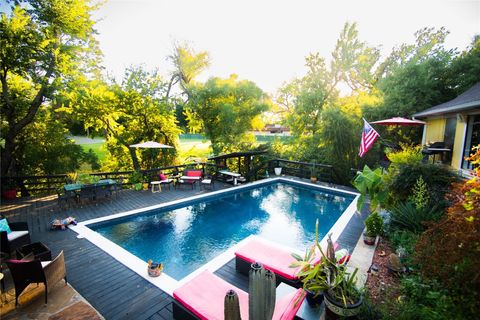
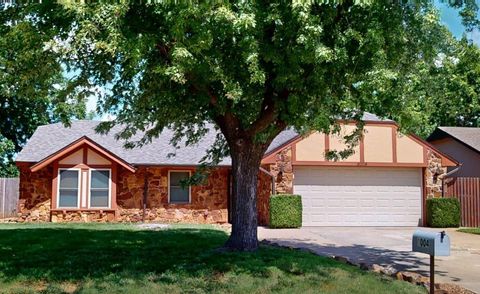
Active
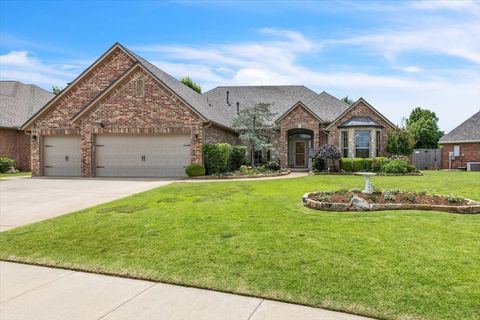
$657,000
5
bds
|
4
ba
|
0
sqft
|
built
1984
5204 Summit Dr, Edmond, OK 73034
$-1,520
Cash flow
-12.1%
Cash-on-Cash Return
3.5%
Cap rate
0.5%
Rent to Value Ratio
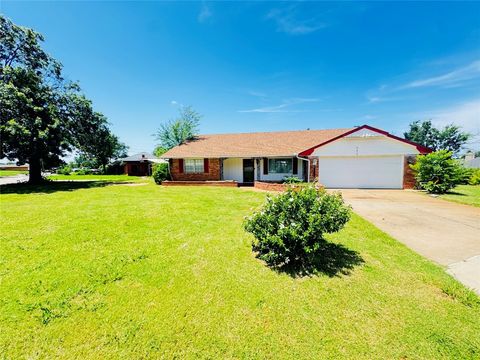
Active
$120,000
2
bds
|
2
ba
|
0
sqft
|
built
1950
4012 SE 25th St, Del City, OK 73115
$97
Cash flow
4.2%
Cash-on-Cash Return
6.7%
Cap rate
0.9%
Rent to Value Ratio
Active
$255,000
4
bds
|
3
ba
|
0
sqft
|
built
1975
2909 Wheeler Ct, Oklahoma City, OK 73127
$-312
Cash flow
-6.4%
Cash-on-Cash Return
4.2%
Cap rate
0.7%
Rent to Value Ratio
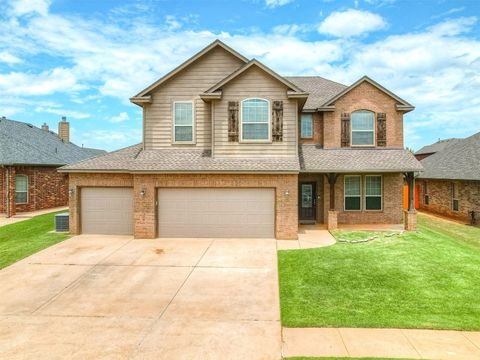
Active
$274,500
3
bds
|
2
ba
|
0
sqft
|
built
2010
18205 Agua Dr, Edmond, OK 73012
$-397
Cash flow
-7.5%
Cash-on-Cash Return
4.5%
Cap rate
0.7%
Rent to Value Ratio
Active
$699,000
3
bds
|
2
ba
|
0
sqft
|
built
1973
9512 NE 23rd St, Oklahoma City, OK 73141
$-1,799
Cash flow
-13.4%
Cash-on-Cash Return
2.6%
Cap rate
0.4%
Rent to Value Ratio
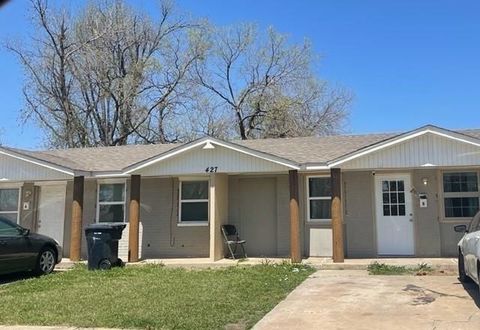
Active
$165,000
3
bds
|
3
ba
|
0
sqft
|
built
1983
427 SE 17th St, Oklahoma City, OK 73129
$-130
Cash flow
-4.1%
Cash-on-Cash Return
4.7%
Cap rate
0.7%
Rent to Value Ratio
Active
$899,000
4
bds
|
8
ba
|
0
sqft
|
built
2018
616 NW 6th St, Oklahoma City, OK 73102
$-2,460
Cash flow
-14.3%
Cash-on-Cash Return
2.4%
Cap rate
0.4%
Rent to Value Ratio
Active
$250,000
3
bds
|
2
ba
|
0
sqft
|
built
1956
2608 Keats Pl, Oklahoma City, OK 73120
$-258
Cash flow
-5.4%
Cash-on-Cash Return
4.4%
Cap rate
0.6%
Rent to Value Ratio
Active
$465,000
3
bds
|
3
ba
|
0
sqft
|
built
1921
2029 NW 19th St, Oklahoma City, OK 73106
$-542
Cash flow
-6.1%
Cash-on-Cash Return
4.3%
Cap rate
0.7%
Rent to Value Ratio
Active
$758,000
3
bds
|
3
ba
|
0
sqft
|
built
2006
5431 NW 132nd St, Oklahoma City, OK 73142
$-2,058
Cash flow
-14.2%
Cash-on-Cash Return
2.4%
Cap rate
0.4%
Rent to Value Ratio
Active
$450,000
3
bds
|
2
ba
|
0
sqft
|
built
1981
1404 Oak Dr, Edmond, OK 73034
$-554
Cash flow
-6.4%
Cash-on-Cash Return
4.2%
Cap rate
0.6%
Rent to Value Ratio
Active
$499,000
5
bds
|
4
ba
|
0
sqft
|
built
1973
11209 Blue Stem Dr, Oklahoma City, OK 73162
$-114
Cash flow
-1.2%
Cash-on-Cash Return
5.4%
Cap rate
0.8%
Rent to Value Ratio
Active
$156,999
3
bds
|
2
ba
|
0
sqft
|
built
1959
302 NE 60th St, Oklahoma City, OK 73105
$155
Cash flow
5.2%
Cash-on-Cash Return
6.9%
Cap rate
1.0%
Rent to Value Ratio
Active
$347,000
4
bds
|
3
ba
|
0
sqft
|
built
2011
2313 NW 154th St, Edmond, OK 73013
$-642
Cash flow
-9.7%
Cash-on-Cash Return
4.0%
Cap rate
0.6%
Rent to Value Ratio
Active
$255,000
3
bds
|
2
ba
|
0
sqft
|
built
1962
1917 Barryton Rd, Oklahoma City, OK 73120
$-287
Cash flow
-5.9%
Cash-on-Cash Return
4.3%
Cap rate
0.6%
Rent to Value Ratio
Active
$272,500
4
bds
|
2
ba
|
0
sqft
|
built
1997
8425 NW 77th St, Oklahoma City, OK 73132
$-146
Cash flow
-2.8%
Cash-on-Cash Return
5.0%
Cap rate
0.7%
Rent to Value Ratio
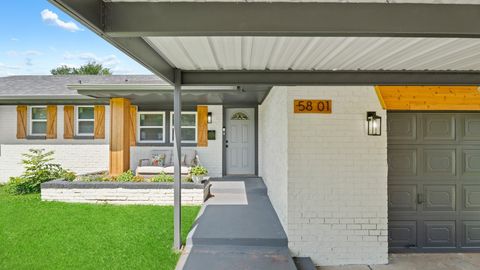
Active
$196,000
3
bds
|
2
ba
|
0
sqft
|
built
1960
5801 N Rhode Island Ave, Oklahoma City, OK 73111
$80
Cash flow
2.1%
Cash-on-Cash Return
6.2%
Cap rate
0.8%
Rent to Value Ratio
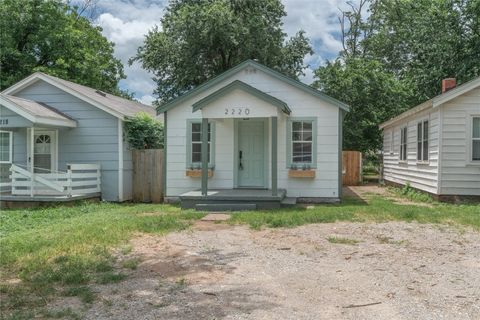
Active
$115,000
2
bds
|
1
ba
|
0
sqft
|
built
1935
2220 SW 28th St, Oklahoma City, OK 73108
$110
Cash flow
5.0%
Cash-on-Cash Return
6.8%
Cap rate
0.9%
Rent to Value Ratio
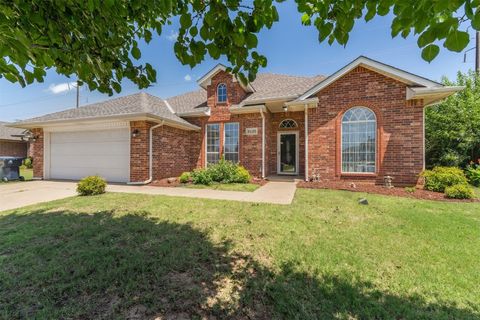
Active
$439,000
4
bds
|
3
ba
|
0
sqft
|
built
2004
1716 NW 182nd St, Edmond, OK 73012
$-824
Cash flow
-9.8%
Cash-on-Cash Return
4.0%
Cap rate
0.6%
Rent to Value Ratio
Active
$90,000
2
bds
|
1
ba
|
0
sqft
|
built
1948
3029 NW 28th St, Oklahoma City, OK 73107
$467
Cash flow
27.1%
Cash-on-Cash Return
11.9%
Cap rate
1.6%
Rent to Value Ratio
Active
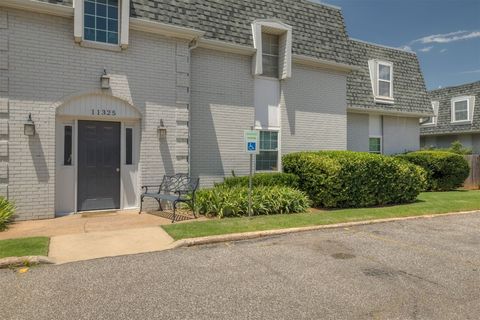
$125,000
2
bds
|
2
ba
|
0
sqft
|
built
1977
11325 N May Ave, Oklahoma City, OK 73120
$-275
Cash flow
-11.5%
Cash-on-Cash Return
3.0%
Cap rate
1.0%
Rent to Value Ratio
Active
$325,000
4
bds
|
3
ba
|
0
sqft
|
built
1951
3609 NW 53rd St, Oklahoma City, OK 73112
$-393
Cash flow
-6.3%
Cash-on-Cash Return
4.2%
Cap rate
0.6%
Rent to Value Ratio
Active
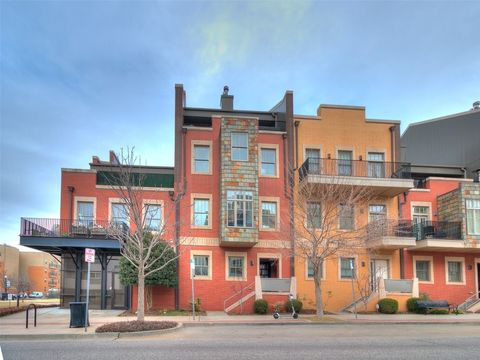
$1,200,000
3
bds
|
5
ba
|
0
sqft
|
built
2008
109 NE 3rd St, Oklahoma City, OK 73104
$-357
Cash flow
-1.6%
Cash-on-Cash Return
5.3%
Cap rate
0.8%
Rent to Value Ratio
Active
$240,000
3
bds
|
2
ba
|
0
sqft
|
built
1975
8004 Wilshire Hills Dr, Oklahoma City, OK 73132
$-189
Cash flow
-4.1%
Cash-on-Cash Return
4.7%
Cap rate
0.7%
Rent to Value Ratio
Active
$229,500
3
bds
|
2
ba
|
0
sqft
|
built
2012
2305 NW 198th St, Edmond, OK 73012
$-287
Cash flow
-6.5%
Cash-on-Cash Return
4.8%
Cap rate
0.7%
Rent to Value Ratio
Active
$595,000
5
bds
|
4
ba
|
0
sqft
|
built
1997
12608 Redstone Ct, Oklahoma City, OK 73142
$-1,289
Cash flow
-11.3%
Cash-on-Cash Return
3.1%
Cap rate
0.5%
Rent to Value Ratio
Active
$175,000
2
bds
|
1
ba
|
0
sqft
|
built
1950
2204 Churchill Pl, Oklahoma City, OK 73120
$-33
Cash flow
-1.0%
Cash-on-Cash Return
5.5%
Cap rate
0.8%
Rent to Value Ratio
Active
$369,000
4
bds
|
4
ba
|
0
sqft
|
built
1977
816 Woodbury Dr, Edmond, OK 73034
$-673
Cash flow
-9.5%
Cash-on-Cash Return
4.1%
Cap rate
0.6%
Rent to Value Ratio
Active
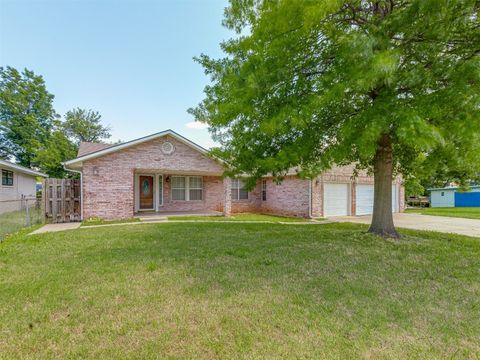
$245,000
4
bds
|
2
ba
|
0
sqft
|
built
1971
4800 SE 45th St, Oklahoma City, OK 73135
$-208
Cash flow
-4.4%
Cash-on-Cash Return
4.7%
Cap rate
0.7%
Rent to Value Ratio
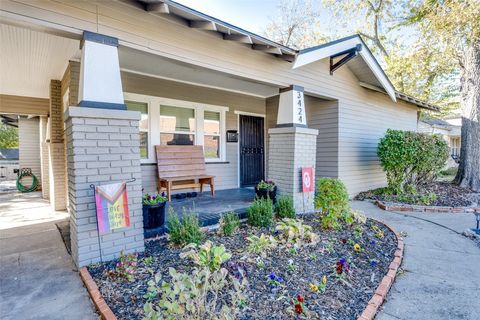
Active
$362,500
3
bds
|
3
ba
|
0
sqft
|
built
1920
3424 NW 16th St, Oklahoma City, OK 73107
$-419
Cash flow
-6.0%
Cash-on-Cash Return
4.3%
Cap rate
0.7%
Rent to Value Ratio
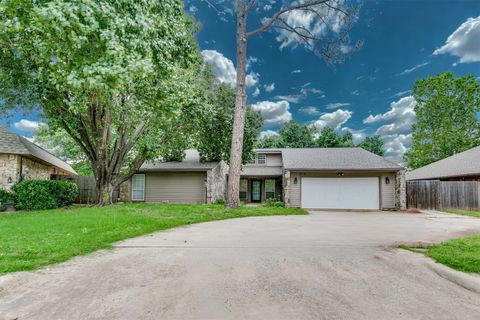
Active
$335,000
4
bds
|
2
ba
|
0
sqft
|
built
2003
201 NW 160th Ter, Edmond, OK 73013
$-724
Cash flow
-11.3%
Cash-on-Cash Return
3.7%
Cap rate
0.6%
Rent to Value Ratio
Active
$395,000
4
bds
|
3
ba
|
0
sqft
|
built
2012
2305 NW 154th St, Edmond, OK 73013
$-873
Cash flow
-11.5%
Cash-on-Cash Return
3.6%
Cap rate
0.6%
Rent to Value Ratio
Active
$390,000
3
bds
|
3
ba
|
0
sqft
|
built
2023
636 Harbor Town Dr, Edmond, OK 73034
$-337
Cash flow
-4.5%
Cash-on-Cash Return
4.6%
Cap rate
0.6%
Rent to Value Ratio
Active
$1,875,000
4
bds
|
5
ba
|
0
sqft
|
built
2025
2716 W Country Club Dr, Oklahoma City, OK 73116
$-7,590
Cash flow
-21.1%
Cash-on-Cash Return
0.8%
Cap rate
0.1%
Rent to Value Ratio
Active
$113,000
2
bds
|
1
ba
|
0
sqft
|
built
1927
1138 N Lottie Ave, Oklahoma City, OK 73117
$250
Cash flow
11.5%
Cash-on-Cash Return
8.3%
Cap rate
1.1%
Rent to Value Ratio
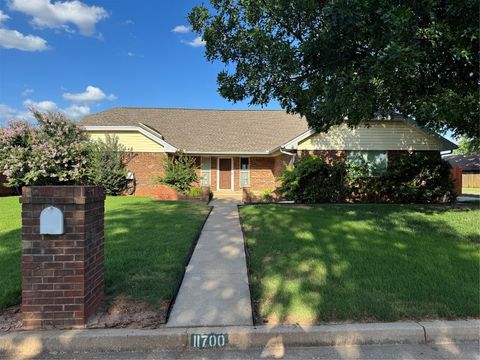
Active
$230,000
3
bds
|
3
ba
|
0
sqft
|
built
1981
11700 Sierra Rd, Oklahoma City, OK 73162
$-32
Cash flow
-0.7%
Cash-on-Cash Return
5.5%
Cap rate
0.8%
Rent to Value Ratio
Active
$1,148,000
4
bds
|
7
ba
|
0
sqft
|
built
2020
7901 N Laura Ln, Oklahoma City, OK 73151
$-4,045
Cash flow
-18.4%
Cash-on-Cash Return
1.5%
Cap rate
0.3%
Rent to Value Ratio
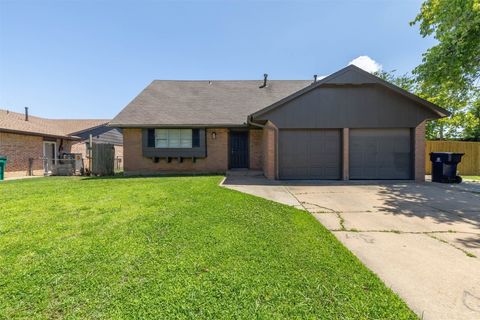
Active
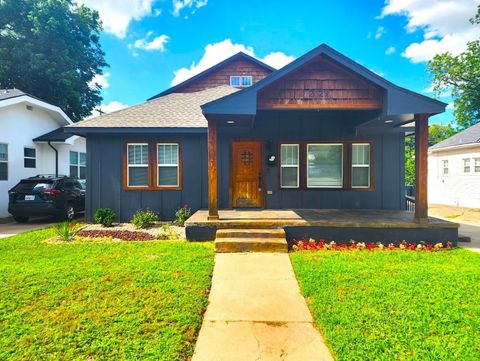
$210,000
4
bds
|
2
ba
|
0
sqft
|
built
1938
3205 N Virginia Ave, Oklahoma City, OK 73118
$97
Cash flow
2.4%
Cash-on-Cash Return
6.2%
Cap rate
0.9%
Rent to Value Ratio
Active
$227,000
4
bds
|
2
ba
|
0
sqft
|
built
2024
1201 East Dr, Edmond, OK 73034
$182
Cash flow
4.2%
Cash-on-Cash Return
7.2%
Cap rate
1.0%
Rent to Value Ratio
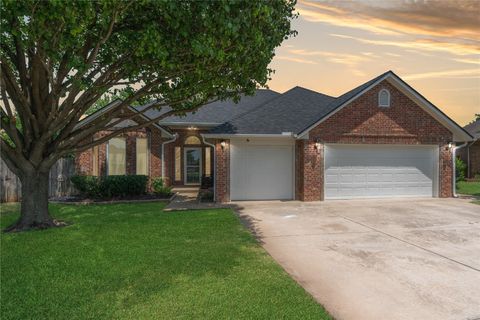
Active
$225,000
3
bds
|
2
ba
|
0
sqft
|
built
1981
706 Hawthorne Ln, Edmond, OK 73003
$-230
Cash flow
-5.3%
Cash-on-Cash Return
5.0%
Cap rate
0.7%
Rent to Value Ratio