Oklahoma County Investment Properties for Sale
Browse homes for sale and investment properties in Oklahoma County. Refine your search by price, property type, or more.
Best cash flowing properties in Oklahoma County
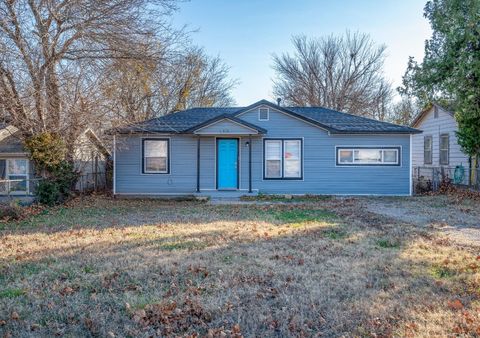
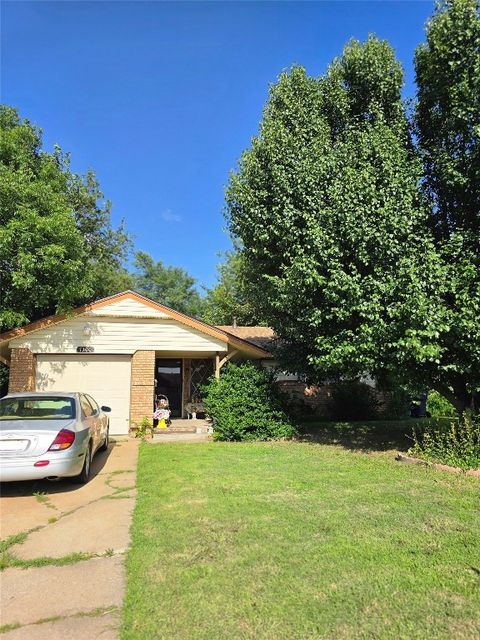
Active
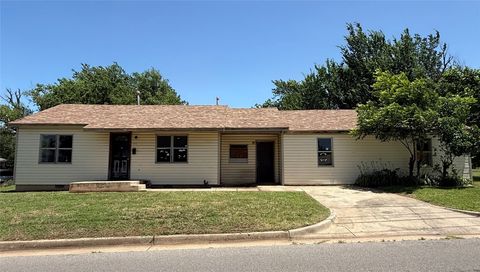
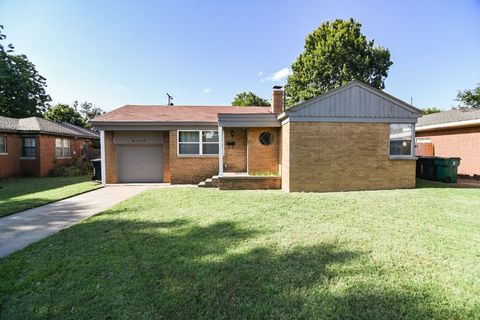
$90,000
3
bds
|
2
ba
|
0
sqft
|
built
1955
2918 N Prospect Ave, Oklahoma City, OK 73111
$465
Cash flow
27.0%
Cash-on-Cash Return
11.9%
Cap rate
1.6%
Rent to Value Ratio
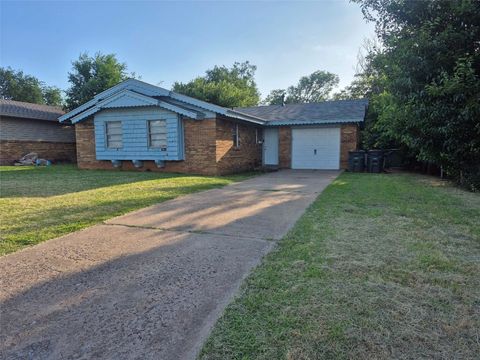
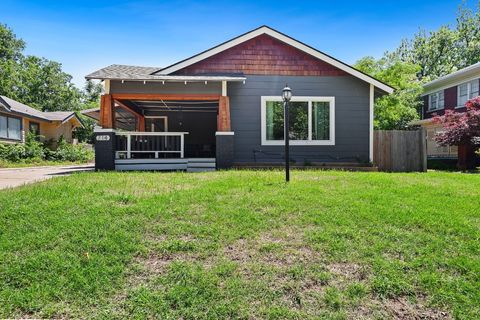
Active
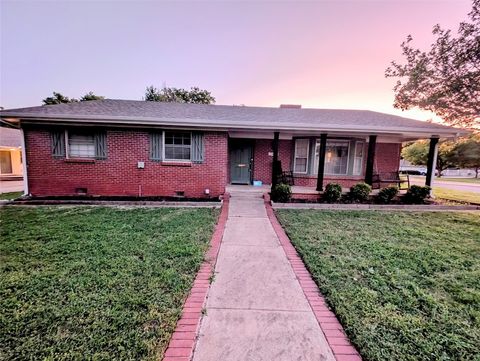
$99,999
3
bds
|
1
ba
|
0
sqft
|
built
1962
905 Shalimar Dr, Oklahoma City, OK 73115
$360
Cash flow
18.8%
Cash-on-Cash Return
10.0%
Cap rate
1.3%
Rent to Value Ratio
2,111 out of 2,931 properties for sale in Oklahoma County
Limited Results Shown
Create a free account, or log in to reveal all property listings and enjoy the complete experience.
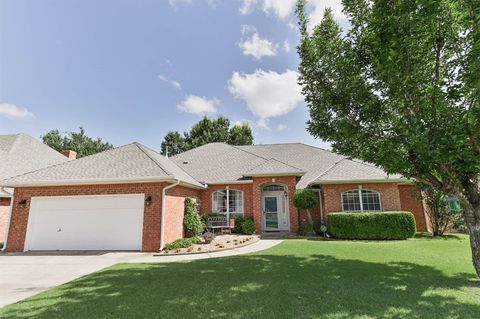
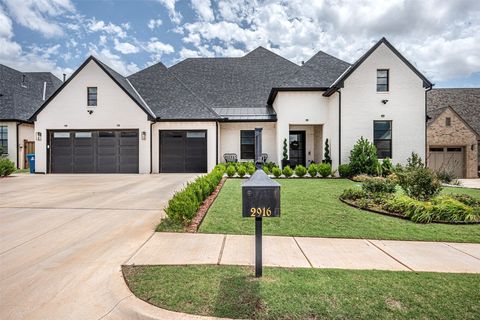
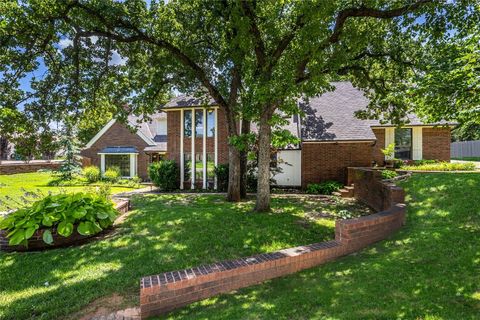
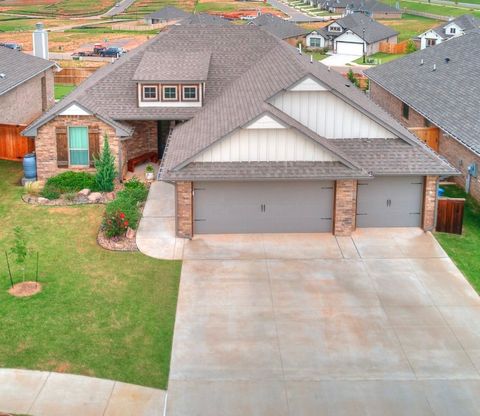
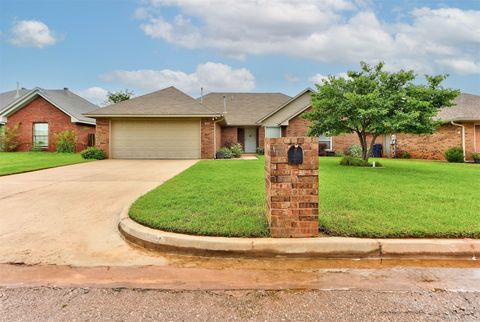
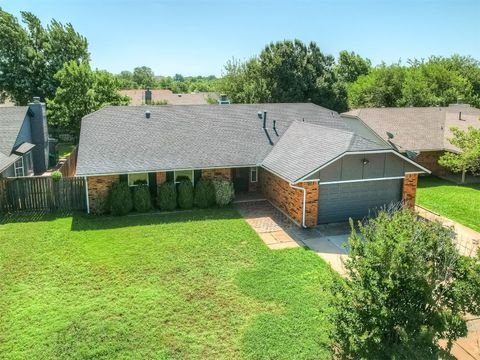
Active
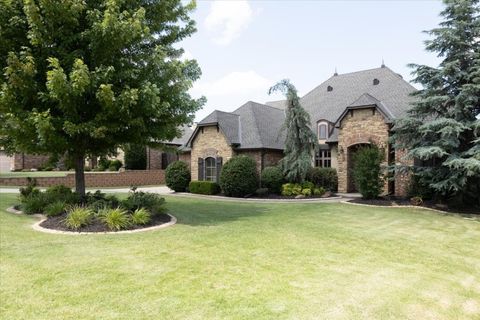
$355,000
4
bds
|
3
ba
|
0
sqft
|
built
1993
2704 Jills Trl, Edmond, OK 73012
$-507
Cash flow
-7.5%
Cash-on-Cash Return
4.5%
Cap rate
0.6%
Rent to Value Ratio
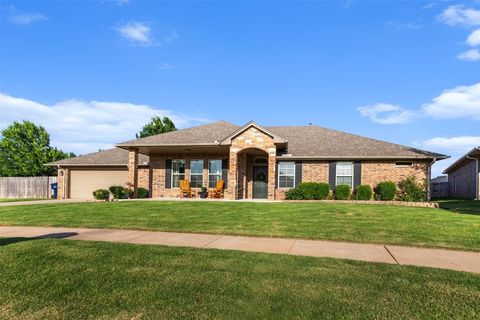
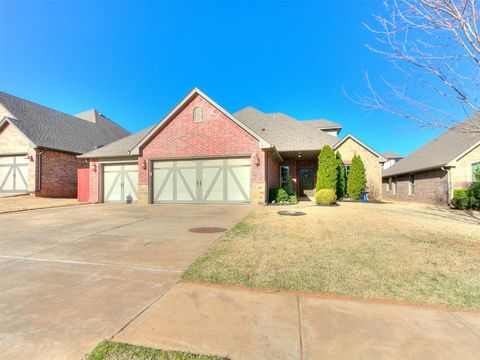
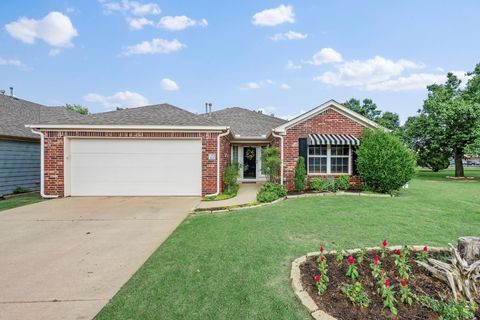
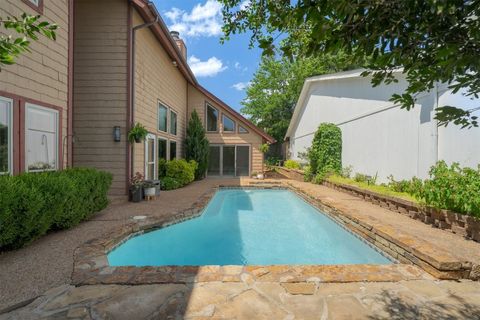
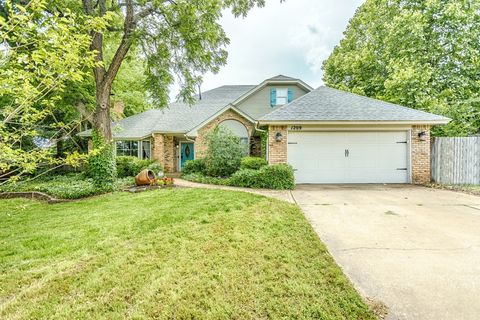
Active
$284,500
3
bds
|
2
ba
|
0
sqft
|
built
2014
2200 NW 159th Ter, Edmond, OK 73013
$-499
Cash flow
-9.2%
Cash-on-Cash Return
4.2%
Cap rate
0.6%
Rent to Value Ratio
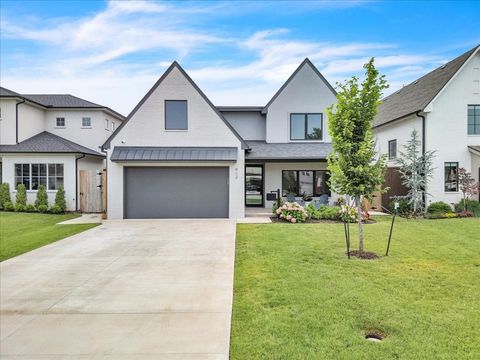
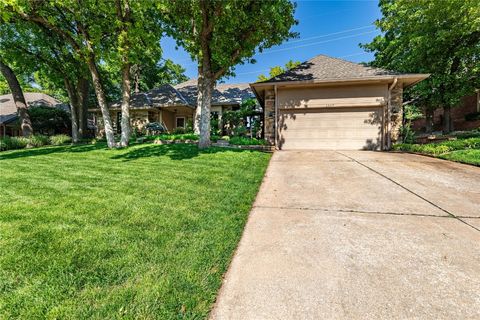
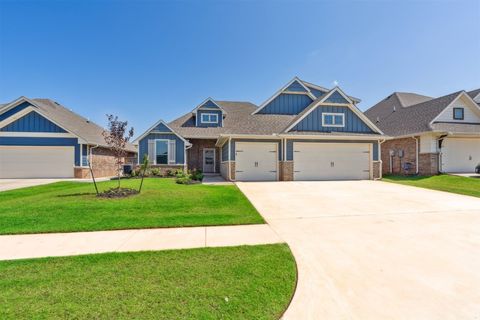
Active
$865,000
4
bds
|
3
ba
|
0
sqft
|
built
2021
2916 Wood Thrush Way, Edmond, OK 73012
$-3,072
Cash flow
-18.5%
Cash-on-Cash Return
2.0%
Cap rate
0.4%
Rent to Value Ratio
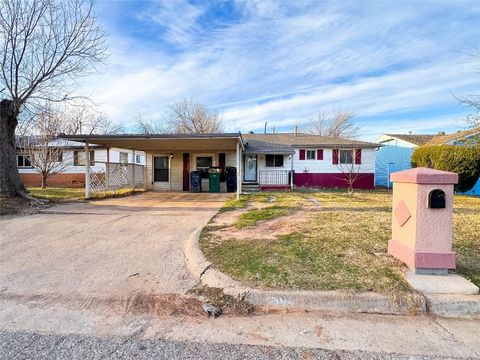
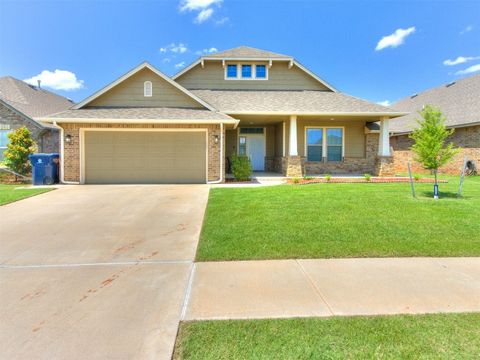
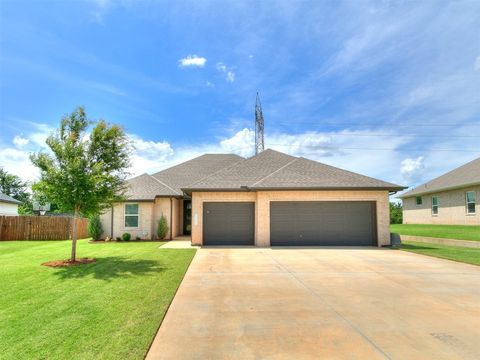
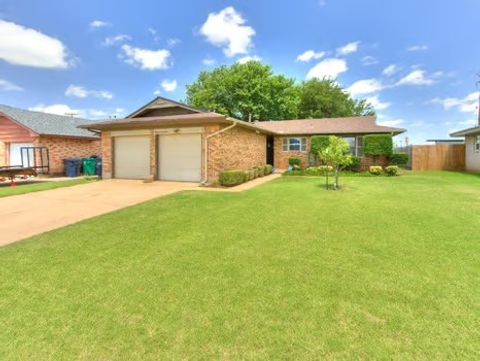
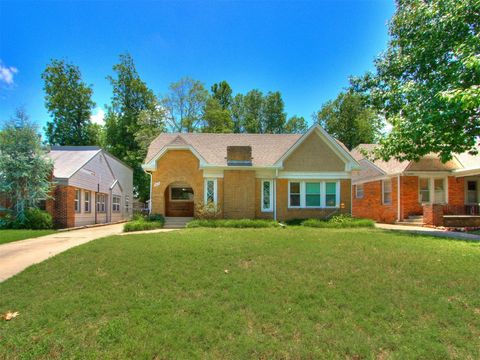
Active
$126,500
3
bds
|
1
ba
|
0
sqft
|
built
1952
4126 Jones Blvd, Oklahoma City, OK 73135
$97
Cash flow
4.0%
Cash-on-Cash Return
6.6%
Cap rate
0.9%
Rent to Value Ratio
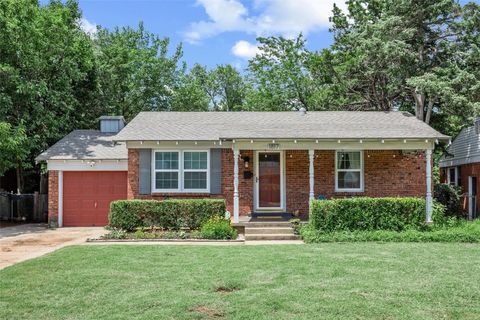
Active
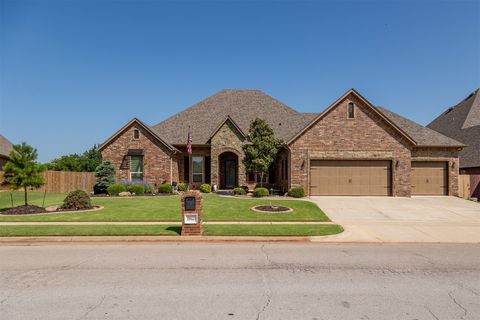
$419,900
4
bds
|
3
ba
|
0
sqft
|
built
1993
10517 SE 49th St, Oklahoma City, OK 73150
$-569
Cash flow
-7.1%
Cash-on-Cash Return
4.1%
Cap rate
0.6%
Rent to Value Ratio
Active
$210,000
3
bds
|
2
ba
|
0
sqft
|
built
1959
2528 Oakridge Dr, Bethany, OK 73008
$-163
Cash flow
-4.0%
Cash-on-Cash Return
4.7%
Cap rate
0.7%
Rent to Value Ratio
Active
$90,000
3
bds
|
2
ba
|
0
sqft
|
built
1955
2918 N Prospect Ave, Oklahoma City, OK 73111
$465
Cash flow
27.0%
Cash-on-Cash Return
11.9%
Cap rate
1.6%
Rent to Value Ratio
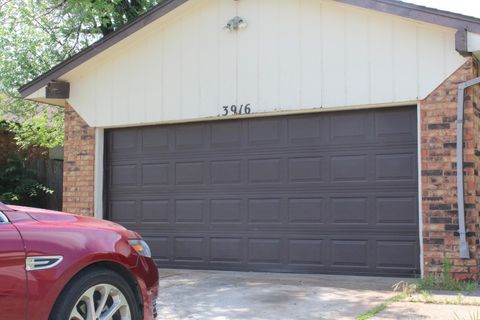
Active
$145,000
3
bds
|
2
ba
|
0
sqft
|
built
1978
3916 SE 46th St, Oklahoma City, OK 73135
$166
Cash flow
6.0%
Cash-on-Cash Return
7.1%
Cap rate
1.0%
Rent to Value Ratio
Active
$219,999
3
bds
|
2
ba
|
0
sqft
|
built
1963
2432 SW 80th St, Oklahoma City, OK 73159
$-121
Cash flow
-2.9%
Cash-on-Cash Return
5.0%
Cap rate
0.7%
Rent to Value Ratio
Active
$525,000
5
bds
|
4
ba
|
0
sqft
|
built
2002
125 NW 147th St, Edmond, OK 73013
$-1,094
Cash flow
-10.9%
Cash-on-Cash Return
3.8%
Cap rate
0.6%
Rent to Value Ratio
Active
$1,225,000
4
bds
|
4
ba
|
0
sqft
|
built
2003
13221 High Sierra Blvd, Edmond, OK 73013
$-4,259
Cash flow
-18.1%
Cash-on-Cash Return
2.1%
Cap rate
0.4%
Rent to Value Ratio
Active
$159,900
2
bds
|
1
ba
|
0
sqft
|
built
1950
4117 NW 21st St, Oklahoma City, OK 73107
$28
Cash flow
0.9%
Cash-on-Cash Return
5.9%
Cap rate
0.8%
Rent to Value Ratio
Active
$715,000
3
bds
|
3
ba
|
0
sqft
|
built
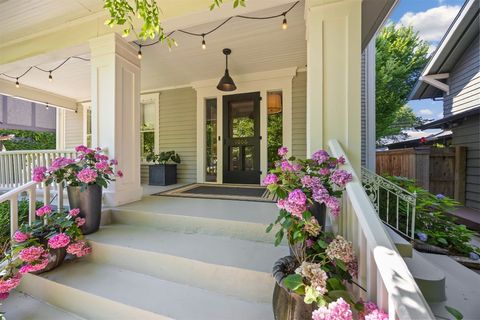
1918
1006 NW 18th St, Oklahoma City, OK 73106
$-2,209
Cash flow
-16.1%
Cash-on-Cash Return
2.0%
Cap rate
0.3%
Rent to Value Ratio
Active
$279,900
3
bds
|
2
ba
|
0
sqft
|
built
1960
2436 NW 43rd Cir, Oklahoma City, OK 73112
$-300
Cash flow
-5.6%
Cash-on-Cash Return
4.4%
Cap rate
0.6%
Rent to Value Ratio
Active
$155,000
3
bds
|
2
ba
|
0
sqft
|
built
1960
601 SE 70th St, Oklahoma City, OK 73149
$309
Cash flow
10.4%
Cash-on-Cash Return
8.1%
Cap rate
1.0%
Rent to Value Ratio
Active
$535,000
4
bds
|
4
ba
|
0
sqft
|
built
1982
1504 Canary Pl, Edmond, OK 73034
$-951
Cash flow
-9.3%
Cash-on-Cash Return
4.1%
Cap rate
0.6%
Rent to Value Ratio
Active
$465,000
4
bds
|
3
ba
|
0
sqft
|
built
2014
3325 Lakeshire Ridge Way, Edmond, OK 73034
$-758
Cash flow
-8.5%
Cash-on-Cash Return
4.3%
Cap rate
0.7%
Rent to Value Ratio
Active
$998,000
3
bds
|
4
ba
|
0
sqft
|
built
2022
912 NW 44th St, Oklahoma City, OK 73118
$-3,374
Cash flow
-17.6%
Cash-on-Cash Return
1.6%
Cap rate
0.4%
Rent to Value Ratio
Active
$415,000
4
bds
|
3
ba
|
0
sqft
|
built
2020
6713 NW 149th St, Oklahoma City, OK 73142
$-673
Cash flow
-8.5%
Cash-on-Cash Return
3.7%
Cap rate
0.6%
Rent to Value Ratio
Active
$372,500
4
bds
|
2
ba
|
0
sqft
|
built
2021
8401 Poplar Dr, Edmond, OK 73034
$-728
Cash flow
-10.2%
Cash-on-Cash Return
3.9%
Cap rate
0.6%
Rent to Value Ratio
Active
$300,000
3
bds
|
2
ba
|
0
sqft
|
built
2000
2455 Manchester Dr, Oklahoma City, OK 73120
$-777
Cash flow
-13.5%
Cash-on-Cash Return
2.6%
Cap rate
0.5%
Rent to Value Ratio
Active
$399,900
4
bds
|
3
ba
|
0
sqft
|
built
2022
15109 Caspian Ln, Edmond, OK 73013
$-1,006
Cash flow
-13.1%
Cash-on-Cash Return
3.2%
Cap rate
0.6%
Rent to Value Ratio
Active
$199,500
2
bds
|
1
ba
|
0
sqft
|
built
1950
1817 Westchester Dr, Oklahoma City, OK 73120
$-109
Cash flow
-2.9%
Cash-on-Cash Return
5.0%
Cap rate
0.7%
Rent to Value Ratio
Active
$239,000
3
bds
|
2
ba
|
0
sqft
|
built
1992
8517 SW 36th Ter, Oklahoma City, OK 73179
$-201
Cash flow
-4.4%
Cash-on-Cash Return
4.7%
Cap rate
0.7%
Rent to Value Ratio
Active
$435,000
3
bds
|
3
ba
|
0
sqft
|
built
1982
1615 Fox Hollow Rdg, Oklahoma City, OK 73131
$-643
Cash flow
-7.7%
Cash-on-Cash Return
3.9%
Cap rate
0.6%
Rent to Value Ratio
Active
$435,000
3
bds
|
3
ba
|
0
sqft
|
built
1983
1600 Turtlecreek Rd, Edmond, OK 73013
$-899
Cash flow
-10.8%
Cash-on-Cash Return
3.8%
Cap rate
0.6%
Rent to Value Ratio
Active
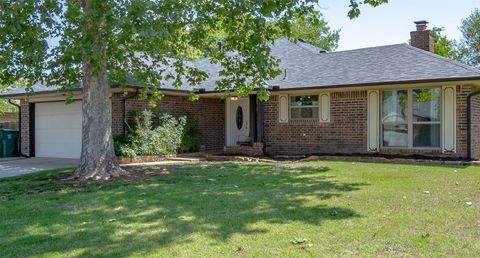
$164,900
3
bds
|
2
ba
|
0
sqft
|
built
1962
1329 SW 77th Ter, Oklahoma City, OK 73159
$48
Cash flow
1.5%
Cash-on-Cash Return
6.0%
Cap rate
0.8%
Rent to Value Ratio
Active
$145,000
3
bds
|
2
ba
|
0
sqft
|
built
1962
7300 S Brookline Ave, Oklahoma City, OK 73159
$314
Cash flow
11.3%
Cash-on-Cash Return
8.3%
Cap rate
1.1%
Rent to Value Ratio
Active
$473,400
3
bds
|
3
ba
|
0
sqft
|
built
1915
714 NW 32nd St, Oklahoma City, OK 73118
$-404
Cash flow
-4.5%
Cash-on-Cash Return
4.7%
Cap rate
0.7%
Rent to Value Ratio
Active
$395,900
3
bds
|
3
ba
|
0
sqft
|
built
1929
2523 NW 57th St, Oklahoma City, OK 73112
$-906
Cash flow
-11.9%
Cash-on-Cash Return
2.9%
Cap rate
0.5%
Rent to Value Ratio
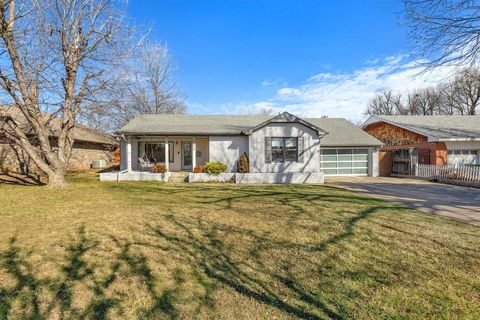
Active
$99,999
3
bds
|
1
ba
|
0
sqft
|
built
1962
905 Shalimar Dr, Oklahoma City, OK 73115
$360
Cash flow
18.8%
Cash-on-Cash Return
10.0%
Cap rate
1.3%
Rent to Value Ratio
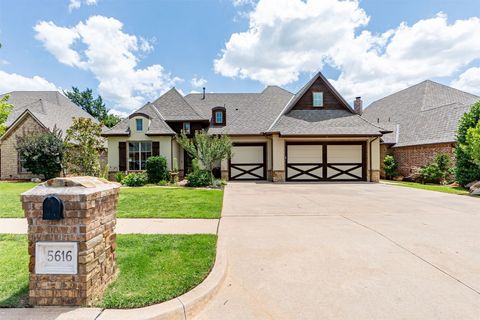
Active
$539,900
4
bds
|
3
ba
|
0
sqft
|
built
2010
5616 NW 130th St, Oklahoma City, OK 73142
$-1,160
Cash flow
-11.2%
Cash-on-Cash Return
3.1%
Cap rate
0.5%
Rent to Value Ratio
Active
$283,000
4
bds
|
2
ba
|
0
sqft
|
built
1979
1008 S Neptune Rd, Edmond, OK 73003
$-317
Cash flow
-5.8%
Cash-on-Cash Return
4.9%
Cap rate
0.7%
Rent to Value Ratio
Active
$450,000
4
bds
|
4
ba
|
0
sqft
|
built
1983
1209 Fox Bluff Ct, Edmond, OK 73034
$-768
Cash flow
-8.9%
Cash-on-Cash Return
4.2%
Cap rate
0.6%
Rent to Value Ratio
Active
$208,000
2
bds
|
1
ba
|
0
sqft
|
built
1929
2420 NW 21st St, Oklahoma City, OK 73107
$-214
Cash flow
-5.4%
Cash-on-Cash Return
4.4%
Cap rate
0.7%
Rent to Value Ratio
Active
$423,000
4
bds
|
3
ba
|
0
sqft
|
built
2022
3621 NW 190th St, Edmond, OK 73012
$-1,037
Cash flow
-12.8%
Cash-on-Cash Return
3.3%
Cap rate
0.6%
Rent to Value Ratio
Active
$725,000
4
bds
|
5
ba
|
0
sqft
|
built
2012
5000 Tower Bridge Ct, Edmond, OK 73034
$-1,936
Cash flow
-13.9%
Cash-on-Cash Return
3.1%
Cap rate
0.5%
Rent to Value Ratio
Active
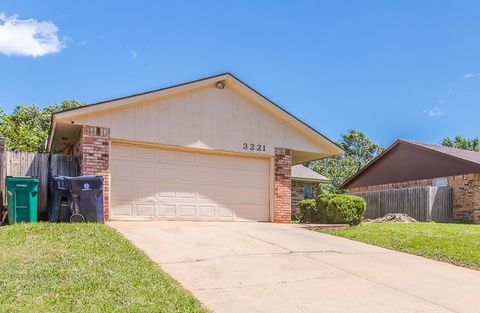
$162,000
3
bds
|
2
ba
|
0
sqft
|
built
1981
3221 SE 57th St, Oklahoma City, OK 73135
$91
Cash flow
2.9%
Cash-on-Cash Return
6.4%
Cap rate
0.9%
Rent to Value Ratio
Active
$255,000
3
bds
|
2
ba
|
0
sqft
|
built
1981
12612 Bannockburn Pl, Oklahoma City, OK 73142
$-279
Cash flow
-5.7%
Cash-on-Cash Return
4.4%
Cap rate
0.7%
Rent to Value Ratio
Active
$659,000
3
bds
|
3
ba
|
0
sqft
|
built
2014
19621 Stratmore Way, Edmond, OK 73012
$-1,806
Cash flow
-14.3%
Cash-on-Cash Return
3.0%
Cap rate
0.5%
Rent to Value Ratio