Oklahoma County Investment Properties for Sale
Browse homes for sale and investment properties in Oklahoma County. Refine your search by price, property type, or more.
Best cash flowing properties in Oklahoma County
Active
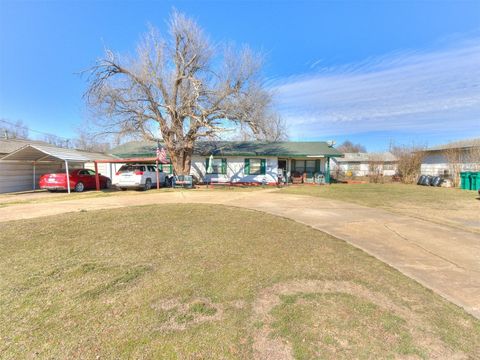
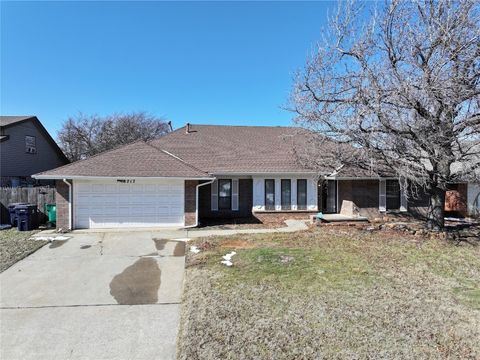
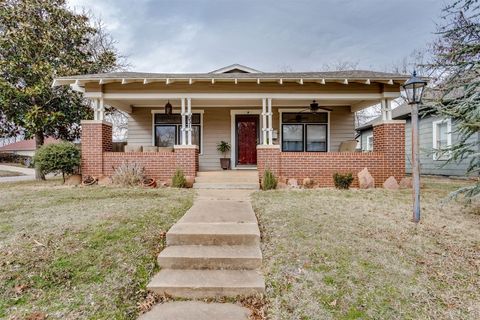
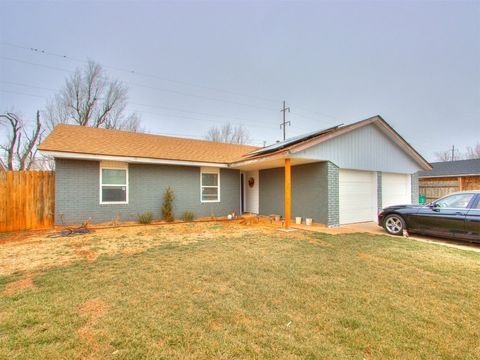
$250,000
7
bds
|
3
ba
|
0
sqft
|
built
1957
6835 SW 59th St, Oklahoma City, OK 73179
$326
Cash flow
6.8%
Cash-on-Cash Return
7.2%
Cap rate
0.9%
Rent to Value Ratio
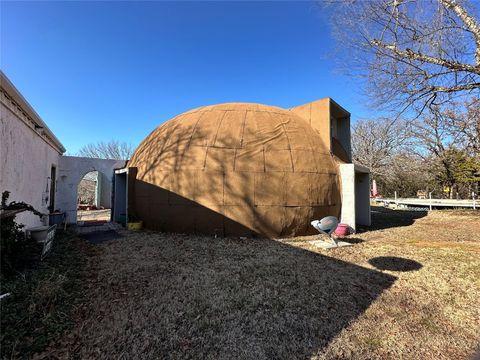
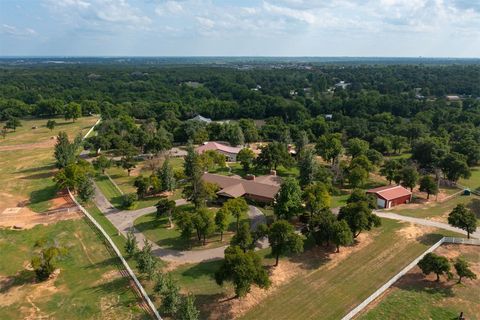
Active
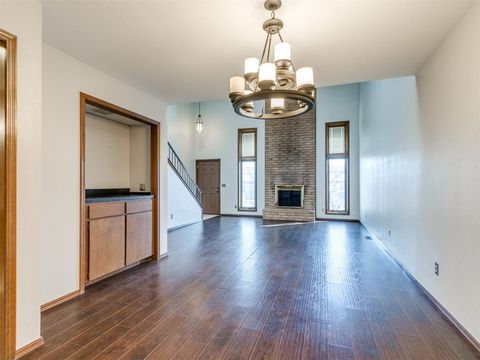
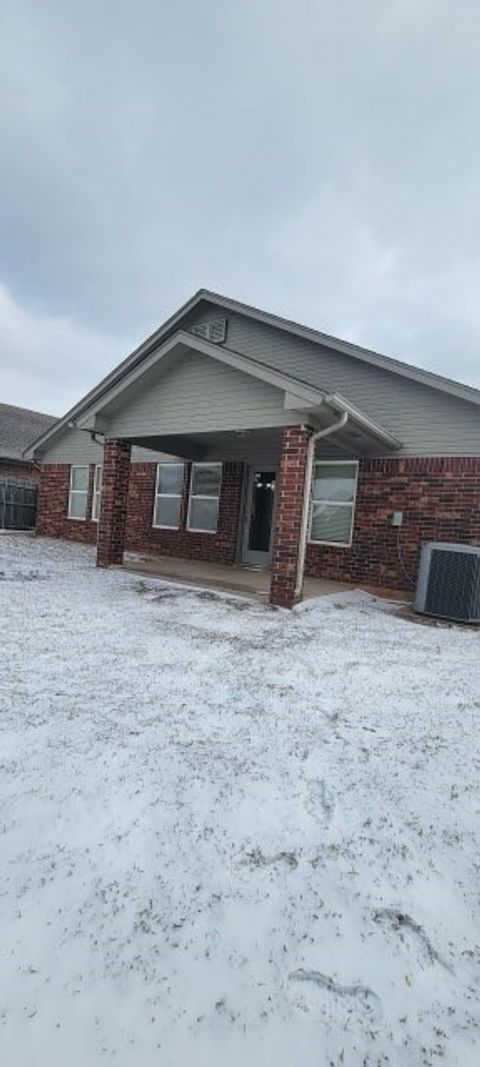
$195,000
2
bds
|
3
ba
|
0
sqft
|
built
1987
13401 N Luther Rd, Luther, OK 73054
$250
Cash flow
6.7%
Cash-on-Cash Return
7.2%
Cap rate
0.9%
Rent to Value Ratio
2,106 out of 2,924 properties for sale in Oklahoma County
Limited Results Shown
Create a free account, or log in to reveal all property listings and enjoy the complete experience.
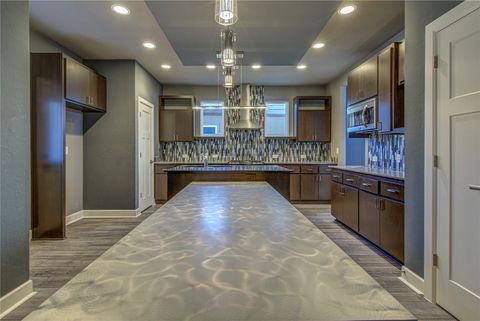
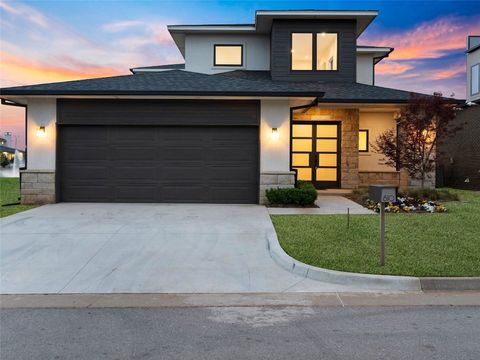
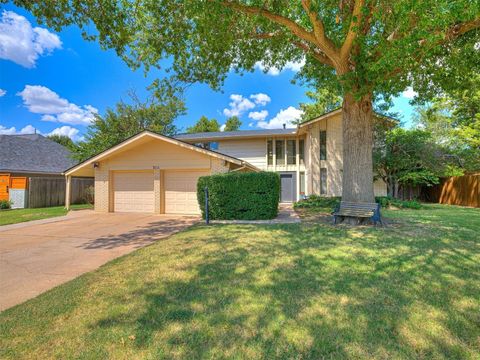
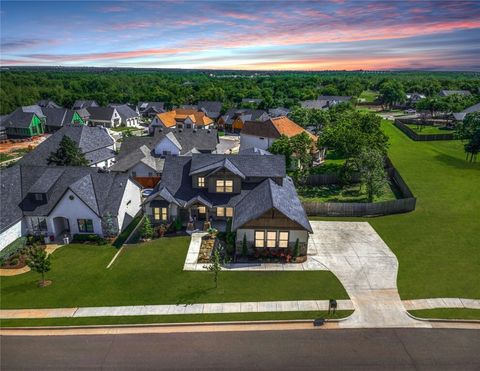
Active
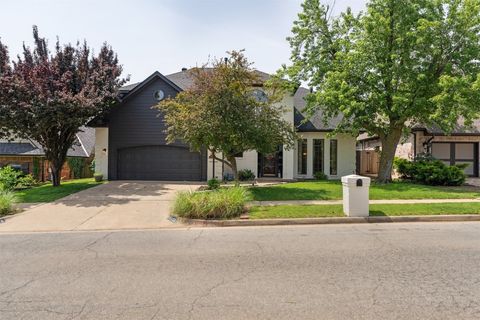
$362,900
3
bds
|
3
ba
|
0
sqft
|
built
2014
17337 Sparrow Hawk Ln, Edmond, OK 73012
$-245
Cash flow
-3.5%
Cash-on-Cash Return
4.9%
Cap rate
0.8%
Rent to Value Ratio
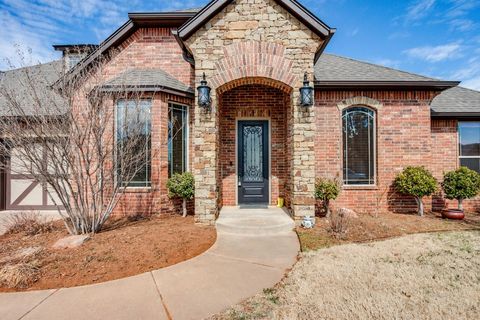
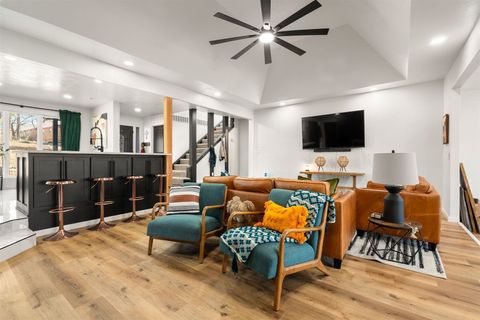
Active
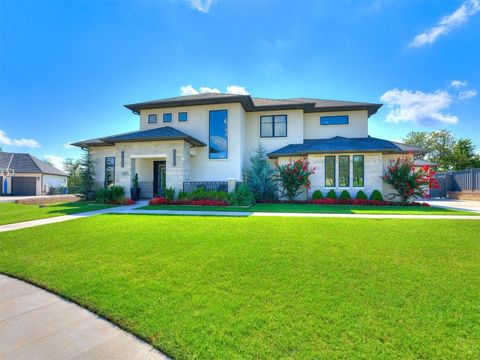
$475,499
4
bds
|
3
ba
|
0
sqft
|
built
2013
8521 NW 126th St, Oklahoma City, OK 73142
$-724
Cash flow
-7.9%
Cash-on-Cash Return
3.9%
Cap rate
0.6%
Rent to Value Ratio
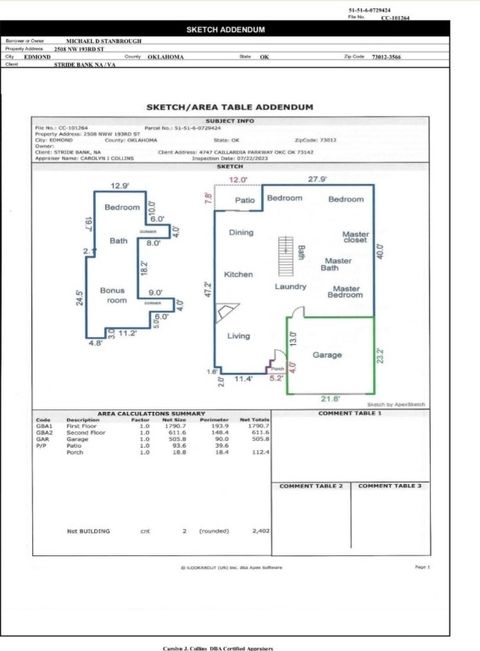
Active
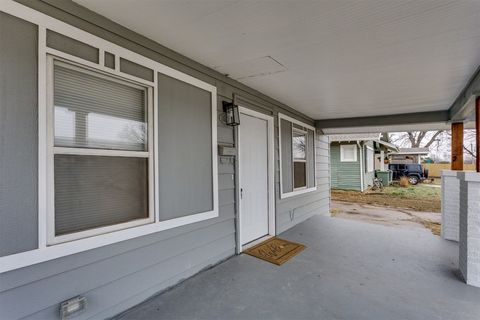
$387,500
4
bds
|
3
ba
|
0
sqft
|
built
2018
2508 NW 193rd St, Edmond, OK 73012
$-655
Cash flow
-8.8%
Cash-on-Cash Return
3.7%
Cap rate
0.6%
Rent to Value Ratio
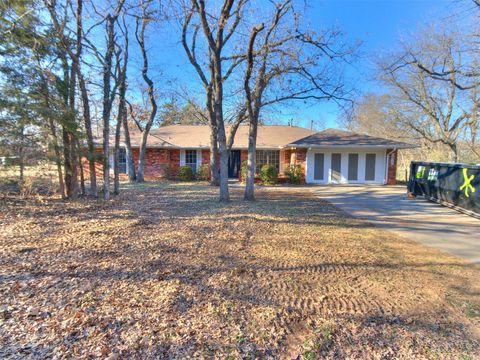
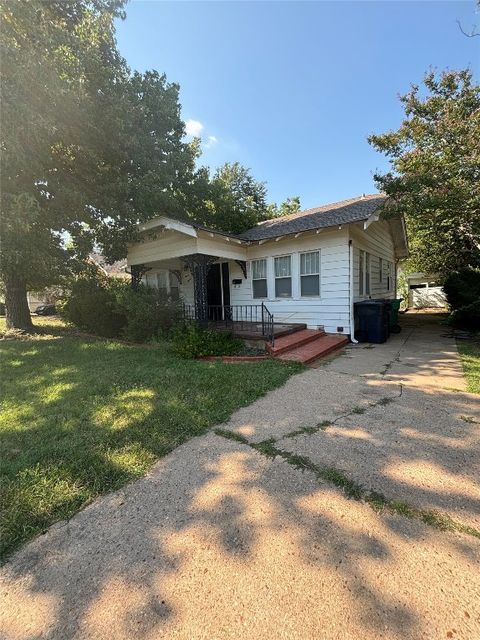
Active
$150,000
3
bds
|
2
ba
|
0
sqft
|
built
1948
505 SE 18th St, Oklahoma City, OK 73129
$175
Cash flow
6.1%
Cash-on-Cash Return
7.1%
Cap rate
0.9%
Rent to Value Ratio
Active
$577,500
1
bds
|
2
ba
|
0
sqft
|
built
2008
200 S Oklahoma Ave, Oklahoma City, OK 73104
$-2,839
Cash flow
-25.6%
Cash-on-Cash Return
-0.2%
Cap rate
0.3%
Rent to Value Ratio
Active
$250,000
7
bds
|
3
ba
|
0
sqft
|
built
1957
6835 SW 59th St, Oklahoma City, OK 73179
$326
Cash flow
6.8%
Cash-on-Cash Return
7.2%
Cap rate
0.9%
Rent to Value Ratio
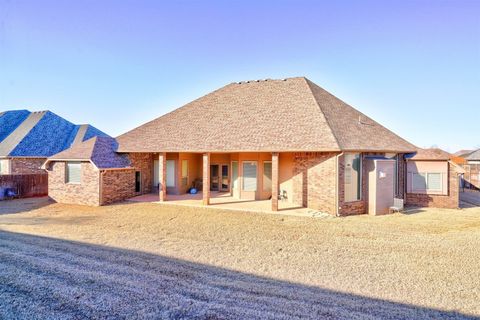
Active
$348,900
4
bds
|
3
ba
|
0
sqft
|
built
1974
1910 Leawood Pl, Edmond, OK 73034
$33
Cash flow
0.5%
Cash-on-Cash Return
5.8%
Cap rate
0.8%
Rent to Value Ratio
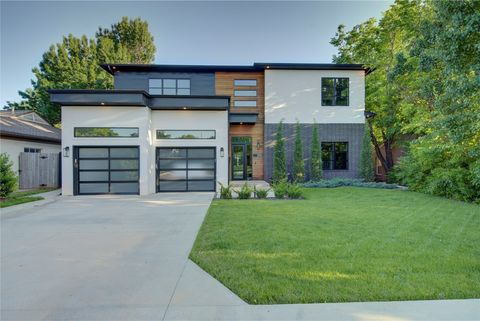
Active
$999,500
3
bds
|
4
ba
|
0
sqft
|
built
2022
810 NW 72nd St, Oklahoma City, OK 73116
$-2,672
Cash flow
-13.9%
Cash-on-Cash Return
2.5%
Cap rate
0.5%
Rent to Value Ratio
Active
$289,000
4
bds
|
3
ba
|
0
sqft
|
built
1973
1933 Red Fox Rd, Edmond, OK 73034
$68
Cash flow
1.2%
Cash-on-Cash Return
6.0%
Cap rate
0.8%
Rent to Value Ratio
Active
$717,900
4
bds
|
4
ba
|
0
sqft
|
built
2015
600 NW 153rd St, Edmond, OK 73013
$-1,647
Cash flow
-12.0%
Cash-on-Cash Return
2.9%
Cap rate
0.4%
Rent to Value Ratio
Active
$1,249,500
4
bds
|
3
ba
|
0
sqft
|
built
2019
1212 W Wilshire Blvd, Nichols Hills, OK 73116
$-3,513
Cash flow
-14.7%
Cash-on-Cash Return
2.3%
Cap rate
0.4%
Rent to Value Ratio
Active
$269,900
4
bds
|
3
ba
|
0
sqft
|
built
1977
8717 Rolling Green Ave, Oklahoma City, OK 73132
$-161
Cash flow
-3.1%
Cash-on-Cash Return
5.0%
Cap rate
0.7%
Rent to Value Ratio
Active
$130,000
2
bds
|
2
ba
|
0
sqft
|
built
1984
3525 NW 41st St, Oklahoma City, OK 73112
$48
Cash flow
1.9%
Cash-on-Cash Return
6.1%
Cap rate
1.2%
Rent to Value Ratio
Active
$329,000
3
bds
|
3
ba
|
0
sqft
|
built
1964
3111 Kent Dr, Oklahoma City, OK 73120
$-118
Cash flow
-1.9%
Cash-on-Cash Return
5.2%
Cap rate
0.8%
Rent to Value Ratio
Active
$369,000
4
bds
|
3
ba
|
0
sqft
|
built
1975
2009 Cedar Ridge Rd, Edmond, OK 73013
$-527
Cash flow
-7.5%
Cash-on-Cash Return
4.0%
Cap rate
0.6%
Rent to Value Ratio
Active
$725,000
4
bds
|
3
ba
|
0
sqft
|
built
2022
7308 Sunset Sail Ave, Edmond, OK 73034
$-1,409
Cash flow
-10.1%
Cash-on-Cash Return
3.3%
Cap rate
0.5%
Rent to Value Ratio
Active
$185,000
3
bds
|
2
ba
|
0
sqft
|
built
1977
5624 Shalimar Dr, Oklahoma City, OK 73135
$-15
Cash flow
-0.4%
Cash-on-Cash Return
5.6%
Cap rate
0.8%
Rent to Value Ratio
Active
$235,000
3
bds
|
1
ba
|
0
sqft
|
built
1935
1817 NW 32nd St, Oklahoma City, OK 73118
$-295
Cash flow
-6.5%
Cash-on-Cash Return
4.2%
Cap rate
0.6%
Rent to Value Ratio
Active
$195,000
2
bds
|
3
ba
|
0
sqft
|
built
1987
13401 N Luther Rd, Luther, OK 73054
$250
Cash flow
6.7%
Cash-on-Cash Return
7.2%
Cap rate
0.9%
Rent to Value Ratio
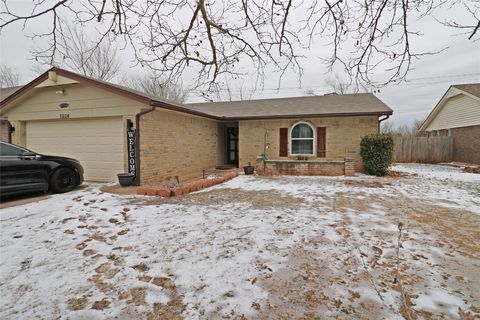
Active
$289,900
4
bds
|
2
ba
|
0
sqft
|
built
1937
3216 NW 14th St, Oklahoma City, OK 73107
$-38
Cash flow
-0.7%
Cash-on-Cash Return
5.5%
Cap rate
0.8%
Rent to Value Ratio
Active
$310,000
2
bds
|
3
ba
|
0
sqft
|
built
2012
519 S Fretz Ave, Edmond, OK 73003
$-553
Cash flow
-9.3%
Cash-on-Cash Return
3.5%
Cap rate
0.6%
Rent to Value Ratio
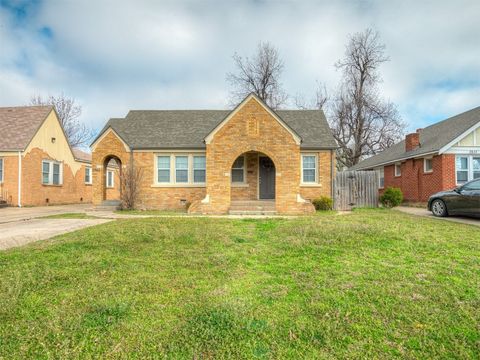
Active
$150,000
3
bds
|
1
ba
|
0
sqft
|
built
1920
3301 N Mc Kinley Ave, Oklahoma City, OK 73118
$216
Cash flow
7.5%
Cash-on-Cash Return
7.4%
Cap rate
1.1%
Rent to Value Ratio
Active
$385,000
3
bds
|
3
ba
|
0
sqft
|
built
1963
2532 NW 59th St, Oklahoma City, OK 73112
$-695
Cash flow
-9.4%
Cash-on-Cash Return
3.5%
Cap rate
0.6%
Rent to Value Ratio
Active
$247,000
3
bds
|
2
ba
|
0
sqft
|
built
1977
10404 Ryecroft Rd, Oklahoma City, OK 73162
$-113
Cash flow
-2.4%
Cash-on-Cash Return
5.1%
Cap rate
0.7%
Rent to Value Ratio
Active
$625,000
3
bds
|
3
ba
|
0
sqft
|
built
2019
923 NW 43rd St, Oklahoma City, OK 73118
$-1,574
Cash flow
-13.1%
Cash-on-Cash Return
2.7%
Cap rate
0.5%
Rent to Value Ratio
Active
$1,995,000
4
bds
|
4
ba
|
0
sqft
|
built
1970
6001 Jarrell Ln, Edmond, OK 73034
$-7,317
Cash flow
-19.1%
Cash-on-Cash Return
1.3%
Cap rate
0.2%
Rent to Value Ratio
Active
$415,000
4
bds
|
3
ba
|
0
sqft
|
built
1990
10420 SE 57th St, Oklahoma City, OK 73150
$-834
Cash flow
-10.5%
Cash-on-Cash Return
3.3%
Cap rate
0.6%
Rent to Value Ratio
Active
$279,900
3
bds
|
2
ba
|
0
sqft
|
built
1925
1413 NE 14th St, Oklahoma City, OK 73117
$-113
Cash flow
-2.1%
Cash-on-Cash Return
5.2%
Cap rate
0.6%
Rent to Value Ratio
Active
$479,900
5
bds
|
4
ba
|
0
sqft
|
built
1928
3013 NW 16th St, Oklahoma City, OK 73107
$-825
Cash flow
-9.0%
Cash-on-Cash Return
3.6%
Cap rate
0.5%
Rent to Value Ratio
Active
$629,000
3
bds
|
4
ba
|
0
sqft
|
built
2013
2104 NW 62nd St, Oklahoma City, OK 73112
$-1,111
Cash flow
-9.2%
Cash-on-Cash Return
3.6%
Cap rate
0.6%
Rent to Value Ratio
Active
$172,000
2
bds
|
3
ba
|
0
sqft
|
built
1982
4400 Hemingway Dr, Oklahoma City, OK 73118
$-235
Cash flow
-7.1%
Cash-on-Cash Return
4.0%
Cap rate
0.9%
Rent to Value Ratio
Active
$185,000
5
bds
|
3
ba
|
0
sqft
|
built
1930
1801 E Madison St, Oklahoma City, OK 73111
$-85
Cash flow
-2.4%
Cash-on-Cash Return
5.1%
Cap rate
0.7%
Rent to Value Ratio
Active
$405,000
3
bds
|
2
ba
|
0
sqft
|
built
1930
631 NW 26th St, Oklahoma City, OK 73103
$-682
Cash flow
-8.8%
Cash-on-Cash Return
3.7%
Cap rate
0.5%
Rent to Value Ratio
Active
$234,000
3
bds
|
2
ba
|
0
sqft
|
built
2007
2841 NW 184th Ter, Edmond, OK 73012
$-245
Cash flow
-5.5%
Cash-on-Cash Return
4.4%
Cap rate
0.7%
Rent to Value Ratio
Active
$195,000
3
bds
|
2
ba
|
0
sqft
|
built
1922
1115 NW 41st St, Oklahoma City, OK 73118
$-151
Cash flow
-4.0%
Cash-on-Cash Return
4.8%
Cap rate
0.7%
Rent to Value Ratio
Active
$375,000
4
bds
|
3
ba
|
0
sqft
|
built
1927
2843 NW 18th St, Oklahoma City, OK 73107
$-1,108
Cash flow
-15.4%
Cash-on-Cash Return
2.1%
Cap rate
0.4%
Rent to Value Ratio
Active
$200,000
3
bds
|
2
ba
|
0
sqft
|
built
1977
5021 Union Cir, Oklahoma City, OK 73135
$-20
Cash flow
-0.5%
Cash-on-Cash Return
5.6%
Cap rate
0.8%
Rent to Value Ratio
Active
$360,000
3
bds
|
3
ba
|
0
sqft
|
built
1992
1408 NW 147th St, Edmond, OK 73013
$-385
Cash flow
-5.6%
Cash-on-Cash Return
4.4%
Cap rate
0.7%
Rent to Value Ratio
Active
$1,150,000
4
bds
|
5
ba
|
0
sqft
|
built
2020
6209 Turnberry Pl, Edmond, OK 73025
$-3,153
Cash flow
-14.3%
Cash-on-Cash Return
2.4%
Cap rate
0.4%
Rent to Value Ratio
Active
$254,900
3
bds
|
2
ba
|
0
sqft
|
built
1930
1617 NW 31st St, Oklahoma City, OK 73118
$-124
Cash flow
-2.5%
Cash-on-Cash Return
5.1%
Cap rate
0.7%
Rent to Value Ratio