Oklahoma County Investment Properties for Sale
Browse homes for sale and investment properties in Oklahoma County. Refine your search by price, property type, or more.
Best cash flowing properties in Oklahoma County
Active
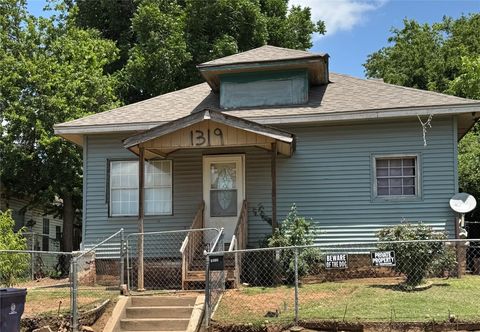
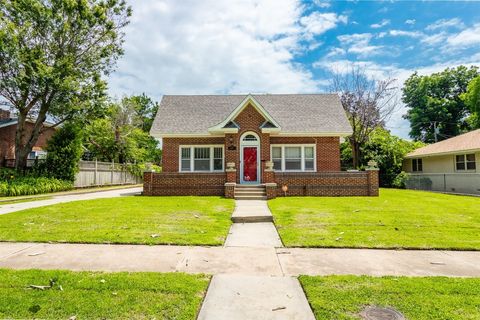
$155,000
4
bds
|
2
ba
|
0
sqft
|
built
1910
1317 NW 7th St, Oklahoma City, OK 73106
$136
Cash flow
4.6%
Cash-on-Cash Return
6.7%
Cap rate
0.8%
Rent to Value Ratio
Active
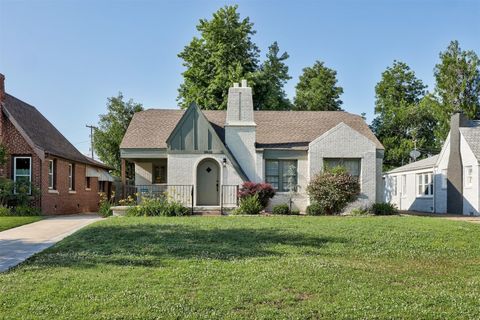
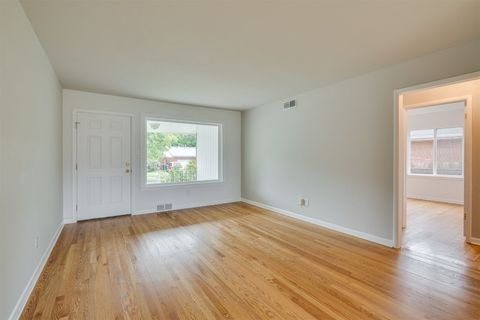
$225,000
2
bds
|
1
ba
|
0
sqft
|
built
1923
2832 NW 19th St, Oklahoma City, OK 73107
$34
Cash flow
0.8%
Cash-on-Cash Return
5.9%
Cap rate
0.8%
Rent to Value Ratio
2,111 out of 2,931 properties for sale in Oklahoma County
Limited Results Shown
Create a free account, or log in to reveal all property listings and enjoy the complete experience.
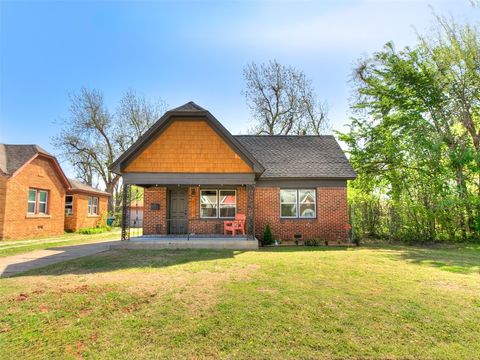
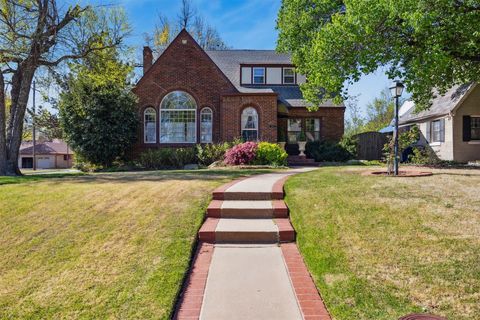
Active
$164,900
2
bds
|
1
ba
|
0
sqft
|
built
2025
2212 N Kelham Ave, Oklahoma City, OK 73111
$-82
Cash flow
-2.6%
Cash-on-Cash Return
5.1%
Cap rate
0.7%
Rent to Value Ratio
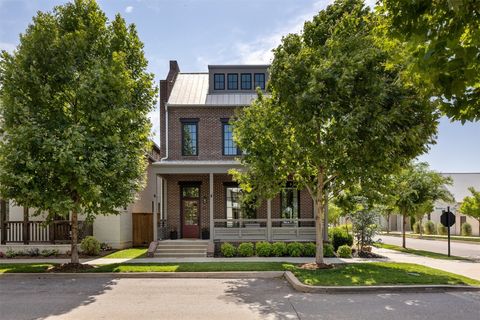
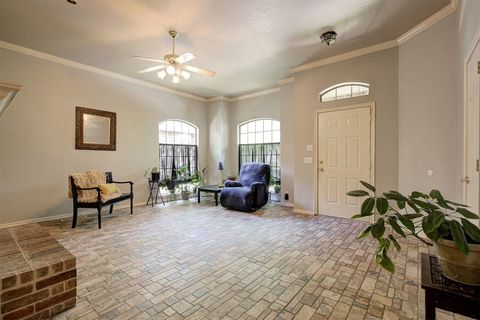
Active
$985,000
5
bds
|
4
ba
|
0
sqft
|
built
2019
1801 Runway Blvd, Oklahoma City, OK 73108
$-1,426
Cash flow
-7.6%
Cash-on-Cash Return
3.9%
Cap rate
0.5%
Rent to Value Ratio
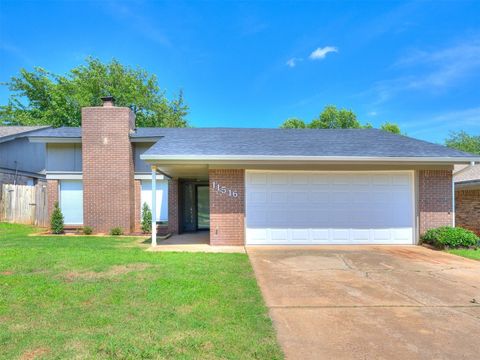
Active
$249,900
3
bds
|
2
ba
|
0
sqft
|
built
1973
11516 N Barnes Ave, Oklahoma City, OK 73120
$-236
Cash flow
-4.9%
Cash-on-Cash Return
4.5%
Cap rate
0.6%
Rent to Value Ratio
Active
$220,000
4
bds
|
1
ba
|
0
sqft
|
built
1950
2451 NW 42nd St, Oklahoma City, OK 73112
$-150
Cash flow
-3.6%
Cash-on-Cash Return
4.9%
Cap rate
0.7%
Rent to Value Ratio
Active
$667,800
4
bds
|
4
ba
|
0
sqft
|
built
2003
3133 Beacon Hill St, Edmond, OK 73034
$-1,875
Cash flow
-14.6%
Cash-on-Cash Return
2.9%
Cap rate
0.5%
Rent to Value Ratio
Active
$420,000
4
bds
|
3
ba
|
0
sqft
|
built
2004
8841 NW 120th St, Oklahoma City, OK 73162
$-342
Cash flow
-4.2%
Cash-on-Cash Return
4.7%
Cap rate
0.7%
Rent to Value Ratio

Active
$299,900
3
bds
|
2
ba
|
0
sqft
|
built
2012
3904 Normandy Rd, Edmond, OK 73013
$-635
Cash flow
-11.0%
Cash-on-Cash Return
3.7%
Cap rate
0.6%
Rent to Value Ratio
Active
$235,000
3
bds
|
2
ba
|
0
sqft
|
built
1981
5633 S Ventura Dr, Oklahoma City, OK 73135
$-211
Cash flow
-4.7%
Cash-on-Cash Return
4.6%
Cap rate
0.7%
Rent to Value Ratio
Active
$475,000
3
bds
|
2
ba
|
0
sqft
|
built
2023
1724 Campus Corner Pl, Edmond, OK 73034
$-906
Cash flow
-10.0%
Cash-on-Cash Return
4.0%
Cap rate
0.7%
Rent to Value Ratio
Active
$525,000
4
bds
|
3
ba
|
0
sqft
|
built
2008
4417 Man O War Dr, Edmond, OK 73025
$-1,355
Cash flow
-13.5%
Cash-on-Cash Return
3.2%
Cap rate
0.5%
Rent to Value Ratio
Active
$259,900
3
bds
|
2
ba
|
0
sqft
|
built
1983
2104 Tanglewood Dr, Edmond, OK 73013
$-334
Cash flow
-6.7%
Cash-on-Cash Return
4.7%
Cap rate
0.7%
Rent to Value Ratio
Active
$605,000
3
bds
|
3
ba
|
0
sqft
|
built
2020
209 Pont De Normandie Ct, Edmond, OK 73034
$-1,706
Cash flow
-14.7%
Cash-on-Cash Return
2.9%
Cap rate
0.5%
Rent to Value Ratio
Active
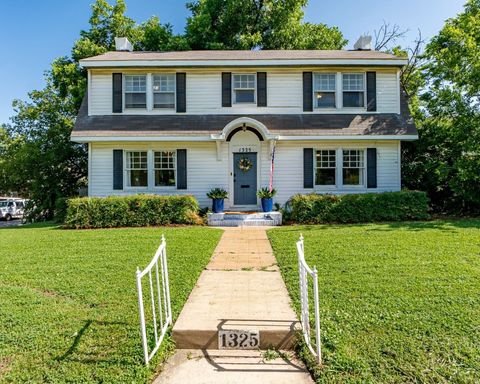
$575,000
3
bds
|
3
ba
|
0
sqft
|
built
1927
1325 NW 20th St, Oklahoma City, OK 73106
$-1,224
Cash flow
-11.1%
Cash-on-Cash Return
3.1%
Cap rate
0.5%
Rent to Value Ratio
Active
$219,900
3
bds
|
2
ba
|
0
sqft
|
built
1966
2401 Flair Dr, Oklahoma City, OK 73159
$-109
Cash flow
-2.6%
Cash-on-Cash Return
5.1%
Cap rate
0.7%
Rent to Value Ratio
Active
$264,900
3
bds
|
2
ba
|
0
sqft
|
built
1920
1123 NW 37th St, Oklahoma City, OK 73118
$-602
Cash flow
-11.9%
Cash-on-Cash Return
3.0%
Cap rate
0.4%
Rent to Value Ratio
Active
$225,000
3
bds
|
2
ba
|
0
sqft
|
built
1980
1229 S Gemini Rd, Edmond, OK 73003
$-187
Cash flow
-4.3%
Cash-on-Cash Return
5.3%
Cap rate
0.7%
Rent to Value Ratio
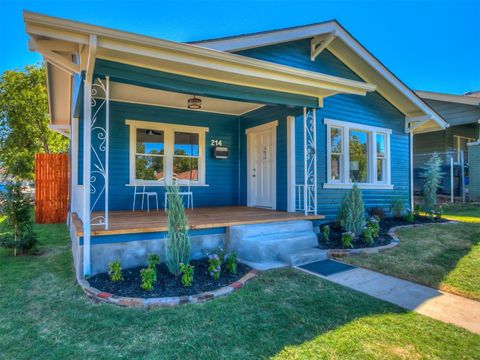
Active
$249,000
3
bds
|
2
ba
|
0
sqft
|
built
1929
214 NW 25th St, Oklahoma City, OK 73103
$-176
Cash flow
-3.7%
Cash-on-Cash Return
4.8%
Cap rate
0.6%
Rent to Value Ratio
Active
$200,000
1
bds
|
1
ba
|
0
sqft
|
built
2009
1 NE 2nd St, Oklahoma City, OK 73104
$-413
Cash flow
-10.8%
Cash-on-Cash Return
3.2%
Cap rate
0.7%
Rent to Value Ratio
Active
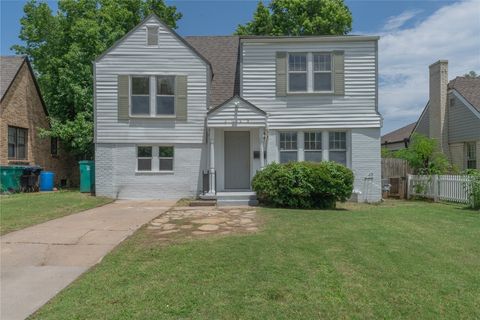
$155,000
4
bds
|
2
ba
|
0
sqft
|
built
1910
1317 NW 7th St, Oklahoma City, OK 73106
$136
Cash flow
4.6%
Cash-on-Cash Return
6.7%
Cap rate
0.8%
Rent to Value Ratio
Active
$235,000
3
bds
|
2
ba
|
0
sqft
|
built
1978
2228 Butternut Pl, Edmond, OK 73013
$-285
Cash flow
-6.3%
Cash-on-Cash Return
4.8%
Cap rate
0.7%
Rent to Value Ratio
Active
$240,000
3
bds
|
2
ba
|
0
sqft
|
built
2011
2233 NW 196th St, Edmond, OK 73012
$-397
Cash flow
-8.6%
Cash-on-Cash Return
4.3%
Cap rate
0.7%
Rent to Value Ratio
Active
$225,000
2
bds
|
1
ba
|
0
sqft
|
built
1923
2832 NW 19th St, Oklahoma City, OK 73107
$34
Cash flow
0.8%
Cash-on-Cash Return
5.9%
Cap rate
0.8%
Rent to Value Ratio
Active
$975,000
12
bds
|
7
ba
|
0
sqft
|
built
1925
1231 NW 33rd St, Oklahoma City, OK 73118
$-4,625
Cash flow
-24.7%
Cash-on-Cash Return
0.0%
Cap rate
0.2%
Rent to Value Ratio
Active
$435,000
4
bds
|
2
ba
|
0
sqft
|
built
2001
8408 NW 74th St, Oklahoma City, OK 73132
$-913
Cash flow
-11.0%
Cash-on-Cash Return
3.2%
Cap rate
0.5%
Rent to Value Ratio
Active
$475,000
3
bds
|
3
ba
|
0
sqft
|
built
2005
16217 Old Oak Dr, Edmond, OK 73013
$-770
Cash flow
-8.5%
Cash-on-Cash Return
4.3%
Cap rate
0.7%
Rent to Value Ratio
Active
$200,000
4
bds
|
1
ba
|
0
sqft
|
built
1936
3125 NW 24th St, Oklahoma City, OK 73107
$5
Cash flow
0.1%
Cash-on-Cash Return
5.7%
Cap rate
0.8%
Rent to Value Ratio
Active
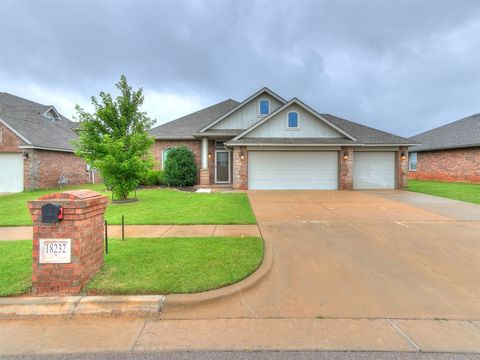
$344,400
3
bds
|
2
ba
|
0
sqft
|
built
2017
18232 Scarborough Dr, Edmond, OK 73012
$-624
Cash flow
-9.5%
Cash-on-Cash Return
3.5%
Cap rate
0.6%
Rent to Value Ratio
Active
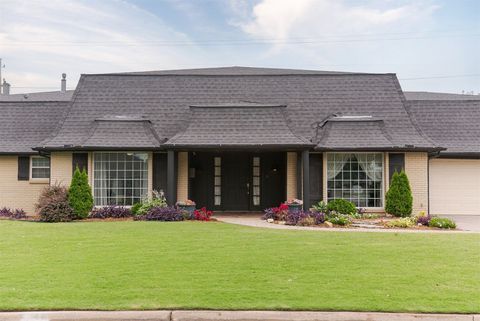
$652,000
4
bds
|
3
ba
|
0
sqft
|
built
1961
8625 Lakehurst Dr, Oklahoma City, OK 73120
$-999
Cash flow
-8.0%
Cash-on-Cash Return
3.8%
Cap rate
0.6%
Rent to Value Ratio
Active
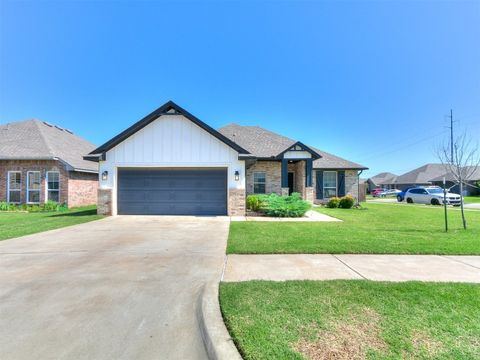
$293,000
3
bds
|
2
ba
|
0
sqft
|
built
2021
4101 NW 151st St, Edmond, OK 73013
$-513
Cash flow
-9.1%
Cash-on-Cash Return
4.2%
Cap rate
0.6%
Rent to Value Ratio
Active
$275,000
3
bds
|
2
ba
|
0
sqft
|
built
1981
4213 NE 143rd St, Edmond, OK 73013
$-540
Cash flow
-10.2%
Cash-on-Cash Return
3.9%
Cap rate
0.6%
Rent to Value Ratio
Active
$575,000
4
bds
|
3
ba
|
0
sqft
|
built
1955
1503 Brighton Ave, Oklahoma City, OK 73120
$-1,075
Cash flow
-9.8%
Cash-on-Cash Return
3.4%
Cap rate
0.5%
Rent to Value Ratio
Active
$395,000
3
bds
|
4
ba
|
0
sqft
|
built
2014
6813 Chelsey Ln, Oklahoma City, OK 73132
$-627
Cash flow
-8.3%
Cash-on-Cash Return
3.8%
Cap rate
0.6%
Rent to Value Ratio
Active
$395,000
4
bds
|
3
ba
|
0
sqft
|
built
2017
8408 NW 134th St, Oklahoma City, OK 73142
$-974
Cash flow
-12.9%
Cash-on-Cash Return
2.7%
Cap rate
0.5%
Rent to Value Ratio
Active
$320,000
5
bds
|
3
ba
|
0
sqft
|
built
1926
2724 NW 13th St, Oklahoma City, OK 73107
$-357
Cash flow
-5.8%
Cash-on-Cash Return
4.3%
Cap rate
0.7%
Rent to Value Ratio
Active
$200,000
3
bds
|
1
ba
|
0
sqft
|
built
1954
3033 N Vermont Ave, Oklahoma City, OK 73107
$-241
Cash flow
-6.3%
Cash-on-Cash Return
4.2%
Cap rate
0.6%
Rent to Value Ratio

Active
$495,000
4
bds
|
2
ba
|
0
sqft
|
built
1910
904 NW 19th St, Oklahoma City, OK 73106
$-677
Cash flow
-7.1%
Cash-on-Cash Return
4.0%
Cap rate
0.6%
Rent to Value Ratio
Active
$609,500
2
bds
|
2
ba
|
0
sqft
|
built
1936
500 NW 41st St, Oklahoma City, OK 73118
$-882
Cash flow
-7.6%
Cash-on-Cash Return
3.9%
Cap rate
0.6%
Rent to Value Ratio
Active
$195,000
2
bds
|
2
ba
|
0
sqft
|
built
1998
1707 Tenbears Rd, Edmond, OK 73034
$-119
Cash flow
-3.2%
Cash-on-Cash Return
5.5%
Cap rate
0.9%
Rent to Value Ratio

Active
$370,000
2
bds
|
2
ba
|
0
sqft
|
built
1950
434 NW 48th St, Oklahoma City, OK 73118
$-848
Cash flow
-12.0%
Cash-on-Cash Return
2.9%
Cap rate
0.5%
Rent to Value Ratio
Active
$200,000
3
bds
|
1
ba
|
0
sqft
|
built
1952
3020 NW 71st St, Oklahoma City, OK 73116
$-126
Cash flow
-3.3%
Cash-on-Cash Return
4.9%
Cap rate
0.7%
Rent to Value Ratio