Oklahoma County Investment Properties for Sale
Browse homes for sale and investment properties in Oklahoma County. Refine your search by price, property type, or more.
Best cash flowing properties in Oklahoma County
Active
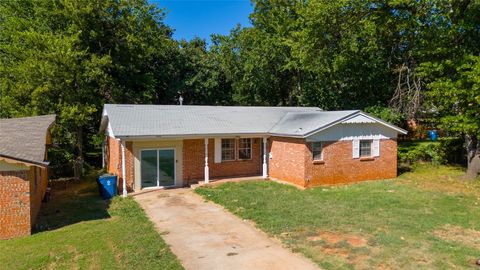
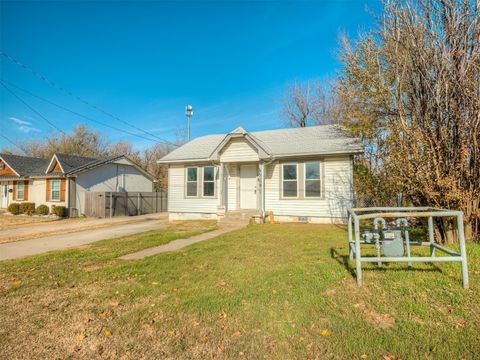
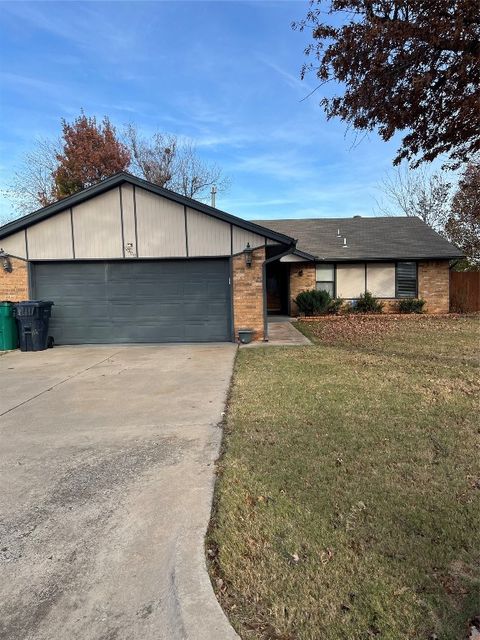
$172,333
4
bds
|
2
ba
|
0
sqft
|
built
1961
1309 Parkwoods Ct, Midwest City, OK 73110
$198
Cash flow
6.0%
Cash-on-Cash Return
7.1%
Cap rate
0.9%
Rent to Value Ratio
Active
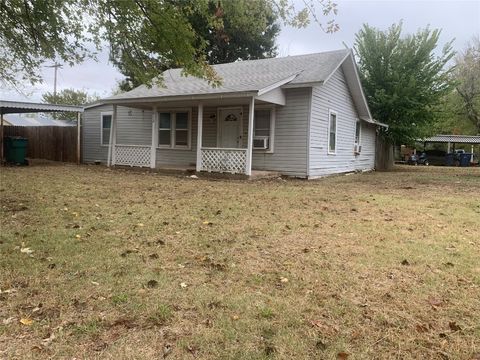
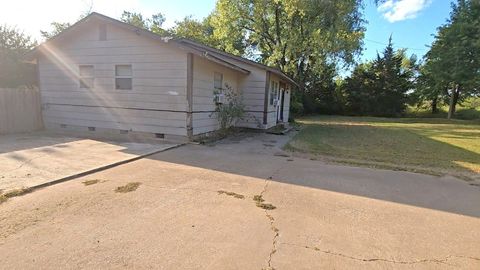
$94,500
1
bds
|
1
ba
|
0
sqft
|
built
1936
7812 Ellis St, Oklahoma City, OK 73169
$192
Cash flow
10.6%
Cash-on-Cash Return
8.1%
Cap rate
1.1%
Rent to Value Ratio
2,111 out of 2,931 properties for sale in Oklahoma County
Limited Results Shown
Create a free account, or log in to reveal all property listings and enjoy the complete experience.
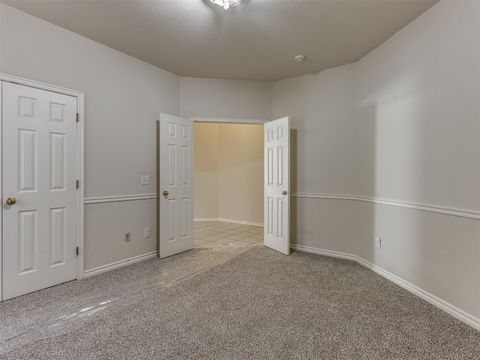
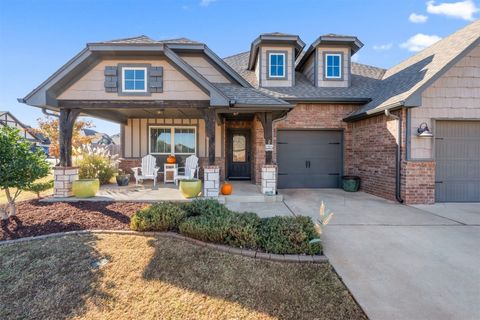
Active
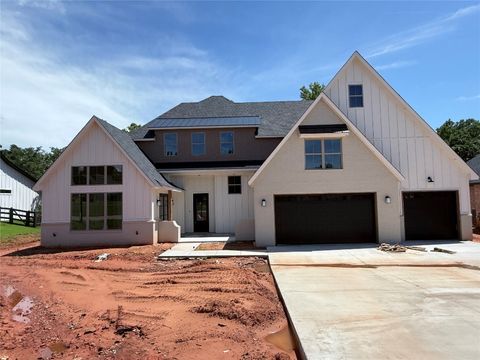
$269,000
3
bds
|
2
ba
|
0
sqft
|
built
2002
25 Red Admiral Way, Edmond, OK 73013
$-619
Cash flow
-12.0%
Cash-on-Cash Return
2.9%
Cap rate
0.6%
Rent to Value Ratio
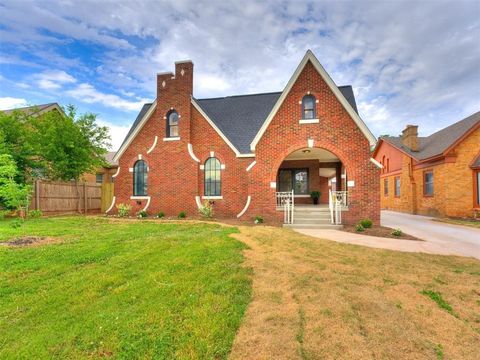
Active
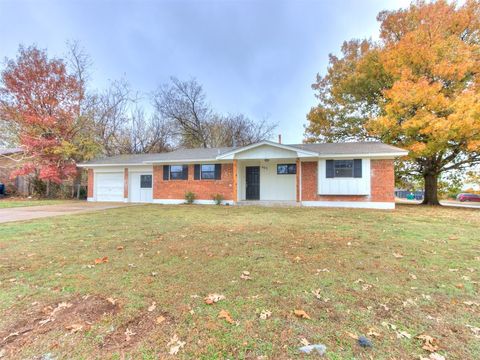
$625,000
5
bds
|
4
ba
|
0
sqft
|
built
1928
809 NE 18th St, Oklahoma City, OK 73105
$-724
Cash flow
-6.0%
Cash-on-Cash Return
4.3%
Cap rate
0.6%
Rent to Value Ratio
Active
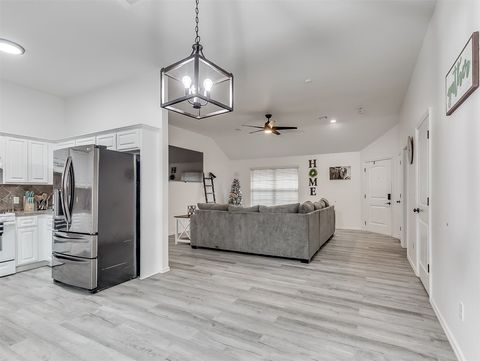
$419,000
4
bds
|
3
ba
|
0
sqft
|
built
2017
4809 Crater Lake Dr, Edmond, OK 73025
$-447
Cash flow
-5.6%
Cash-on-Cash Return
4.4%
Cap rate
0.7%
Rent to Value Ratio
Active
$395,000
3
bds
|
3
ba
|
0
sqft
|
built
2009
5609 NW 130th St, Oklahoma City, OK 73142
$-570
Cash flow
-7.5%
Cash-on-Cash Return
3.9%
Cap rate
0.6%
Rent to Value Ratio
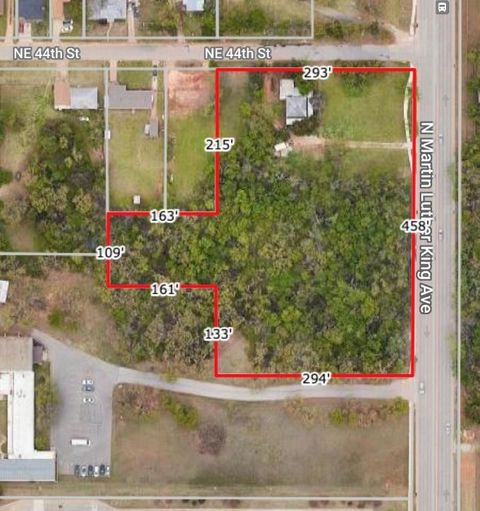
Active
$399,000
3
bds
|
2
ba
|
0
sqft
|
built
1936
4435 N Martin Luther King Ave, Oklahoma City, OK 73111
$-461
Cash flow
-6.0%
Cash-on-Cash Return
4.3%
Cap rate
0.6%
Rent to Value Ratio
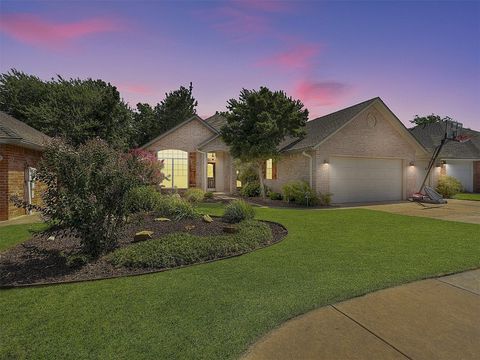
Active
$312,000
3
bds
|
2
ba
|
0
sqft
|
built
2001
1801 Del Simmons Dr, Edmond, OK 73003
$-379
Cash flow
-6.3%
Cash-on-Cash Return
4.2%
Cap rate
0.6%
Rent to Value Ratio
Active
$900,000
4
bds
|
5
ba
|
0
sqft
|
built
1987
5801 Oak Tree Rd, Edmond, OK 73025
$-1,687
Cash flow
-9.8%
Cash-on-Cash Return
3.4%
Cap rate
0.6%
Rent to Value Ratio
Active
$899,800
4
bds
|
4
ba
|
0
sqft
|
built
2024
2220 NW 27th St, Oklahoma City, OK 73107
$-3,150
Cash flow
-18.3%
Cash-on-Cash Return
1.5%
Cap rate
0.2%
Rent to Value Ratio
Active
$172,333
4
bds
|
2
ba
|
0
sqft
|
built
1961
1309 Parkwoods Ct, Midwest City, OK 73110
$198
Cash flow
6.0%
Cash-on-Cash Return
7.1%
Cap rate
0.9%
Rent to Value Ratio
Active
$379,900
4
bds
|
3
ba
|
0
sqft
|
built
2006
804 NW 193rd St, Edmond, OK 73012
$-612
Cash flow
-8.4%
Cash-on-Cash Return
3.7%
Cap rate
0.6%
Rent to Value Ratio
Active
$225,000
3
bds
|
2
ba
|
0
sqft
|
built
1971
2921 Shadybrook Dr, Midwest City, OK 73110
$-8
Cash flow
-0.2%
Cash-on-Cash Return
5.6%
Cap rate
0.8%
Rent to Value Ratio
Active
$284,900
5
bds
|
3
ba
|
0
sqft
|
built
1957
5900 NW 62nd St, Oklahoma City, OK 73122
$-97
Cash flow
-1.8%
Cash-on-Cash Return
5.3%
Cap rate
0.8%
Rent to Value Ratio
Active
$141,999
3
bds
|
1
ba
|
0
sqft
|
built
1954
2924 N Vermont Ave, Oklahoma City, OK 73107
$-14
Cash flow
-0.5%
Cash-on-Cash Return
5.6%
Cap rate
0.8%
Rent to Value Ratio
Active
$415,000
4
bds
|
3
ba
|
0
sqft
|
built
2021
4236 NW 152nd Ter, Edmond, OK 73013
$-698
Cash flow
-8.8%
Cash-on-Cash Return
3.7%
Cap rate
0.6%
Rent to Value Ratio
Active
$1,475,000
6
bds
|
7
ba
|
0
sqft
|
built
2018
12415 Roberts Rd, Edmond, OK 73013
$-4,260
Cash flow
-15.1%
Cash-on-Cash Return
2.2%
Cap rate
0.3%
Rent to Value Ratio
Active
$124,900
4
bds
|
1
ba
|
0
sqft
|
built
1941
6009 NW 19th St, Oklahoma City, OK 73127
$156
Cash flow
6.5%
Cash-on-Cash Return
7.2%
Cap rate
1.0%
Rent to Value Ratio
Active
$837,045
4
bds
|
4
ba
|
0
sqft
|
built
2024
400 Eagle Creek Way, Oklahoma City, OK 73117
$-2,890
Cash flow
-18.0%
Cash-on-Cash Return
1.5%
Cap rate
0.2%
Rent to Value Ratio
Active
$169,000
4
bds
|
2
ba
|
0
sqft
|
built
1964
401 NW 86th St, Oklahoma City, OK 73114
$97
Cash flow
3.0%
Cash-on-Cash Return
6.4%
Cap rate
0.8%
Rent to Value Ratio
Active
$221,000
3
bds
|
2
ba
|
0
sqft
|
built
2013
5612 Marblewood Dr, Oklahoma City, OK 73179
$-136
Cash flow
-3.2%
Cash-on-Cash Return
4.9%
Cap rate
0.7%
Rent to Value Ratio
Active
$259,900
3
bds
|
2
ba
|
0
sqft
|
built
1964
5511 Judy Dr, Del City, OK 73115
$142
Cash flow
2.9%
Cash-on-Cash Return
6.3%
Cap rate
0.8%
Rent to Value Ratio
Active
$212,000
3
bds
|
2
ba
|
0
sqft
|
built
1983
9000 Kimberly Rd, Oklahoma City, OK 73132
$-91
Cash flow
-2.2%
Cash-on-Cash Return
5.2%
Cap rate
0.8%
Rent to Value Ratio

Active
$289,000
2
bds
|
2
ba
|
0
sqft
|
built
1927
1140 N Kentucky Ave, Oklahoma City, OK 73106
$-518
Cash flow
-9.4%
Cash-on-Cash Return
3.5%
Cap rate
0.5%
Rent to Value Ratio
Active
$99,000
2
bds
|
2
ba
|
0
sqft
|
built
1986
6900 N Westminster Rd, Spencer, OK 73084
$153
Cash flow
8.1%
Cash-on-Cash Return
7.5%
Cap rate
1.1%
Rent to Value Ratio

Active
$304,000
2
bds
|
2
ba
|
0
sqft
|
built
1927
1840 NW 11th St, Oklahoma City, OK 73106
$-604
Cash flow
-10.4%
Cash-on-Cash Return
3.3%
Cap rate
0.5%
Rent to Value Ratio
Active
$204,900
3
bds
|
1
ba
|
0
sqft
|
built
1928
1108 NE 16th St, Oklahoma City, OK 73117
$34
Cash flow
0.9%
Cash-on-Cash Return
5.9%
Cap rate
0.8%
Rent to Value Ratio
Active
$235,000
3
bds
|
1
ba
|
0
sqft
|
built
1952
2100 Barclay Rd, Oklahoma City, OK 73120
$-96
Cash flow
-2.1%
Cash-on-Cash Return
5.2%
Cap rate
0.7%
Rent to Value Ratio
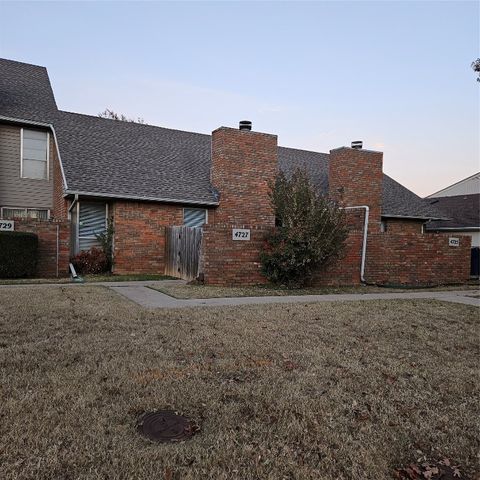
Active
$154,000
2
bds
|
2
ba
|
0
sqft
|
built
1982
4727 NW 72nd St, Oklahoma City, OK 73132
$-7
Cash flow
-0.2%
Cash-on-Cash Return
5.6%
Cap rate
0.8%
Rent to Value Ratio
Active
$1,150,000
12
bds
|
11
ba
|
0
sqft
|
built
1915
732 NW 18th St, Oklahoma City, OK 73103
$-4,866
Cash flow
-22.1%
Cash-on-Cash Return
0.6%
Cap rate
0.2%
Rent to Value Ratio
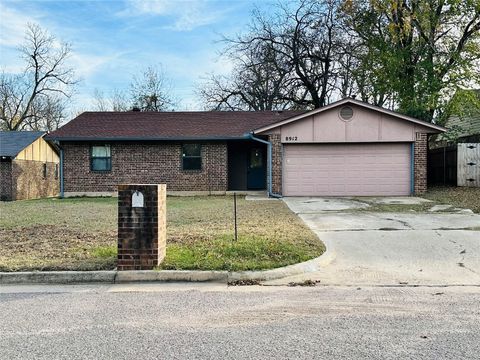
Active
$149,000
3
bds
|
2
ba
|
0
sqft
|
built
1984
8912 Muriel Way, Spencer, OK 73084
$180
Cash flow
6.3%
Cash-on-Cash Return
7.1%
Cap rate
0.9%
Rent to Value Ratio
Active
$89,000
3
bds
|
2
ba
|
0
sqft
|
built
1975
2620 N Ann Arbor Ave, Oklahoma City, OK 73127
$-57
Cash flow
-3.3%
Cash-on-Cash Return
4.9%
Cap rate
1.2%
Rent to Value Ratio
Active
$83,000
2
bds
|
3
ba
|
0
sqft
|
built
1975
2616 N Ann Arbor Ave, Oklahoma City, OK 73127
$-130
Cash flow
-8.2%
Cash-on-Cash Return
3.8%
Cap rate
1.2%
Rent to Value Ratio
Active
$168,333
2
bds
|
1
ba
|
0
sqft
|
built
1934
2509 NW 22nd St, Oklahoma City, OK 73107
$10
Cash flow
0.3%
Cash-on-Cash Return
5.8%
Cap rate
0.8%
Rent to Value Ratio
Active
$540,000
4
bds
|
3
ba
|
0
sqft
|
built
2023
913 NW 43rd St, Oklahoma City, OK 73118
$-666
Cash flow
-6.4%
Cash-on-Cash Return
4.2%
Cap rate
0.6%
Rent to Value Ratio
Active
$149,900
3
bds
|
2
ba
|
0
sqft
|
built
1920
1212 SW 22nd St, Oklahoma City, OK 73109
$119
Cash flow
4.1%
Cash-on-Cash Return
6.6%
Cap rate
0.9%
Rent to Value Ratio
Active
$527,850
4
bds
|
3
ba
|
0
sqft
|
built
2024
216 Pont Neuf Ct, Edmond, OK 73034
$-288
Cash flow
-2.8%
Cash-on-Cash Return
5.0%
Cap rate
0.7%
Rent to Value Ratio
Active
$527,850
4
bds
|
3
ba
|
0
sqft
|
built
2023
201 Pont Neuf Ct, Edmond, OK 73034
$-288
Cash flow
-2.8%
Cash-on-Cash Return
5.0%
Cap rate
0.7%
Rent to Value Ratio
Active
$573,750
4
bds
|
3
ba
|
0
sqft
|
built
2023
208 Pont Neuf Ct, Edmond, OK 73034
$-436
Cash flow
-4.0%
Cash-on-Cash Return
4.8%
Cap rate
0.6%
Rent to Value Ratio
Active
$94,500
1
bds
|
1
ba
|
0
sqft
|
built
1936
7812 Ellis St, Oklahoma City, OK 73169
$192
Cash flow
10.6%
Cash-on-Cash Return
8.1%
Cap rate
1.1%
Rent to Value Ratio
Active
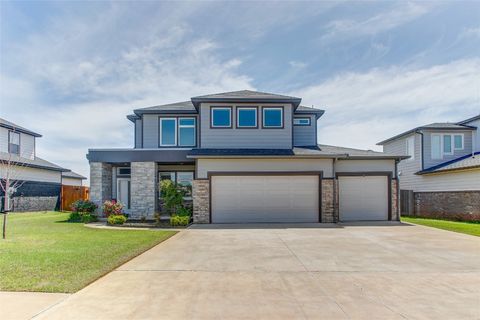
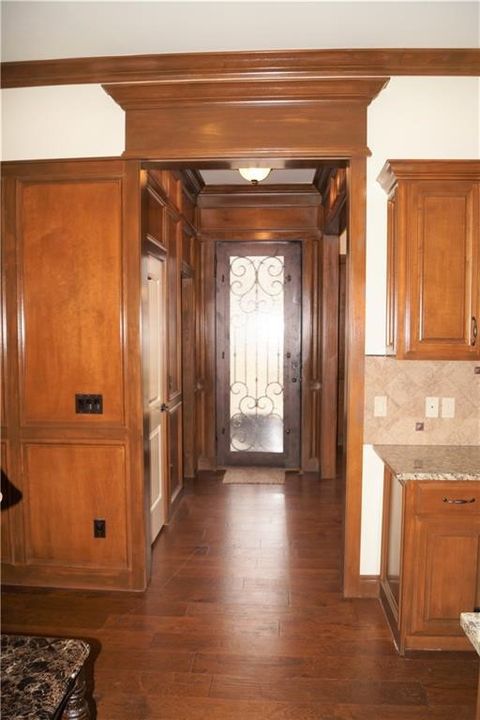
$429,900
4
bds
|
3
ba
|
0
sqft
|
built
2021
2200 El Cajon St, Edmond, OK 73034
$-351
Cash flow
-4.3%
Cash-on-Cash Return
4.7%
Cap rate
0.7%
Rent to Value Ratio
Active
$699,900
4
bds
|
4
ba
|
0
sqft
|
built
2016
17117 Royal Troon Dr, Edmond, OK 73012
$-1,250
Cash flow
-9.3%
Cash-on-Cash Return
3.5%
Cap rate
0.5%
Rent to Value Ratio