Oklahoma County Investment Properties for Sale
Browse homes for sale and investment properties in Oklahoma County. Refine your search by price, property type, or more.
Best cash flowing properties in Oklahoma County

Active
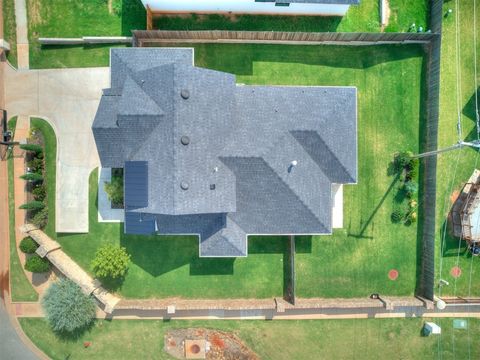
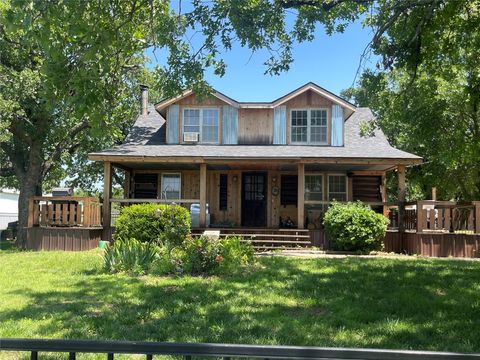
$169,900
3
bds
|
2
ba
|
0
sqft
|
built
1965
4905 Woodland Park Ter, Spencer, OK 73084
$226
Cash flow
6.9%
Cash-on-Cash Return
7.3%
Cap rate
0.9%
Rent to Value Ratio

Active
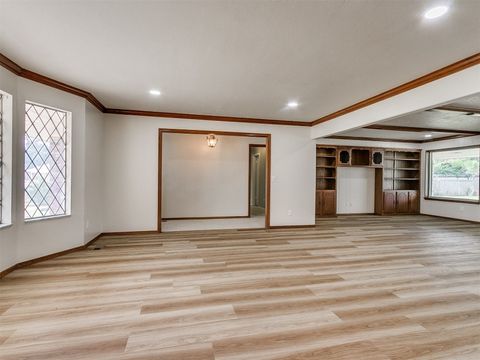
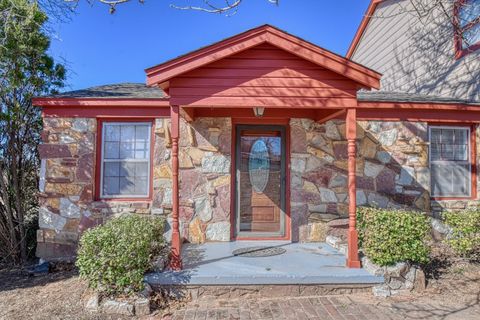
$104,999
2
bds
|
1
ba
|
0
sqft
|
built
1951
4108 SE 10th St, Del City, OK 73115
$213
Cash flow
10.6%
Cash-on-Cash Return
8.1%
Cap rate
1.0%
Rent to Value Ratio
2,112 out of 2,932 properties for sale in Oklahoma County
Limited Results Shown
Create a free account, or log in to reveal all property listings and enjoy the complete experience.
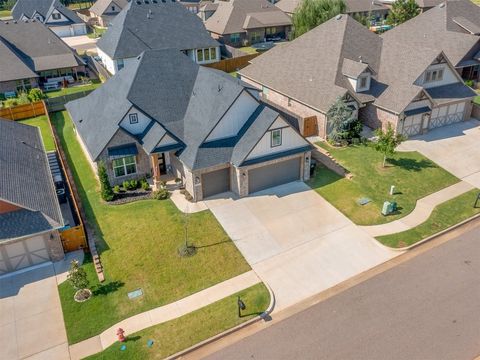
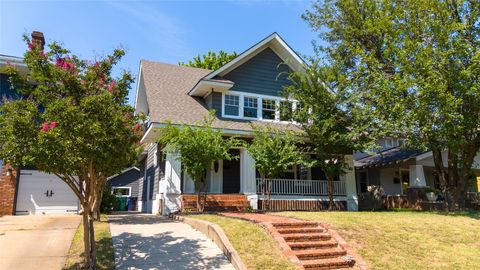
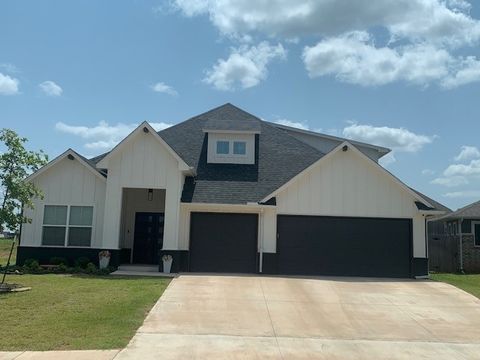
Active
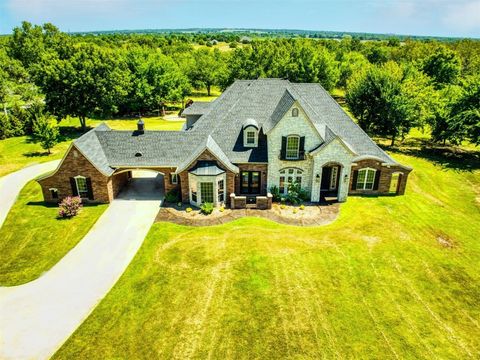
$497,000
4
bds
|
3
ba
|
0
sqft
|
built
2021
8928 NW 130th St, Oklahoma City, OK 73142
$-653
Cash flow
-6.9%
Cash-on-Cash Return
4.1%
Cap rate
0.7%
Rent to Value Ratio
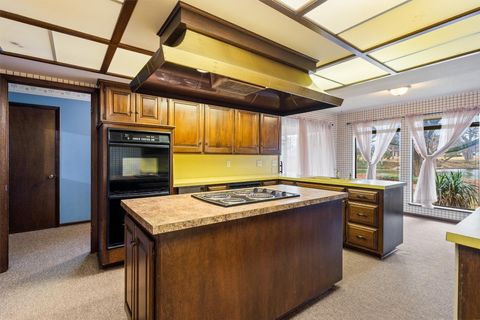
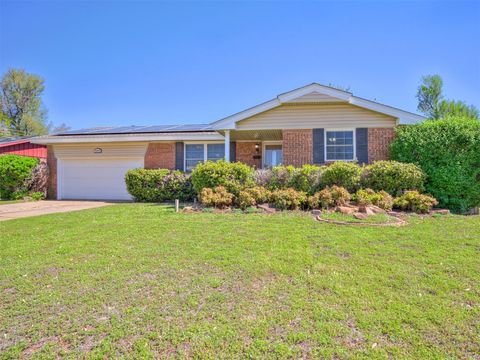
Active
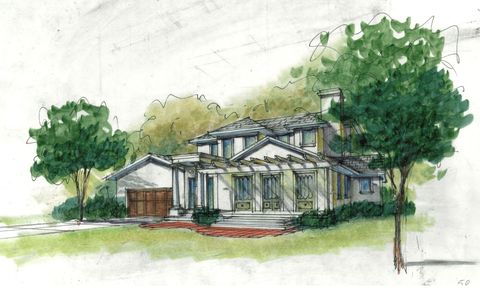
$339,900
4
bds
|
3
ba
|
0
sqft
|
built
1964
4997 NW 30th Pl, Oklahoma City, OK 73122
$-347
Cash flow
-5.3%
Cash-on-Cash Return
4.5%
Cap rate
0.6%
Rent to Value Ratio

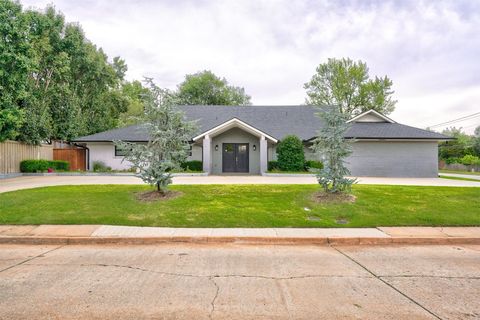
Active
$224,900
2
bds
|
1
ba
|
0
sqft
|
built
1927
2045 NW 21st St, Oklahoma City, OK 73106
$-195
Cash flow
-4.5%
Cash-on-Cash Return
4.6%
Cap rate
0.7%
Rent to Value Ratio
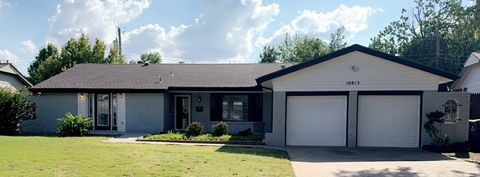
Active
$184,333
6
bds
|
2
ba
|
0
sqft
|
built
1956
904 Cypress Cv, Midwest City, OK 73110
$13
Cash flow
0.4%
Cash-on-Cash Return
5.8%
Cap rate
0.8%
Rent to Value Ratio
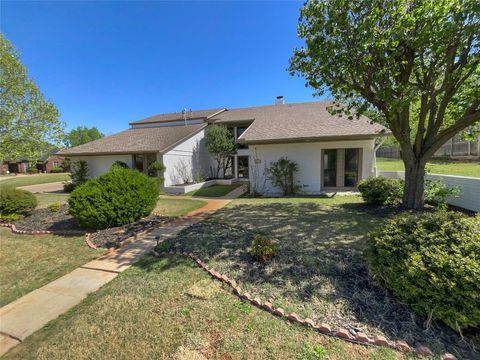
Active
$292,000
4
bds
|
3
ba
|
0
sqft
|
built
1964
3208 NW 54th St, Oklahoma City, OK 73112
$-251
Cash flow
-4.5%
Cash-on-Cash Return
4.6%
Cap rate
0.7%
Rent to Value Ratio
Active
$500,000
4
bds
|
3
ba
|
0
sqft
|
built
2021
8216 Crew Ln, Edmond, OK 73034
$-730
Cash flow
-7.6%
Cash-on-Cash Return
3.9%
Cap rate
0.6%
Rent to Value Ratio
Active
$549,900
3
bds
|
3
ba
|
0
sqft
|
built
1975
2940 Browne Stone Rd, Oklahoma City, OK 73120
$-547
Cash flow
-5.2%
Cash-on-Cash Return
4.5%
Cap rate
0.6%
Rent to Value Ratio
Active
$378,000
4
bds
|
3
ba
|
0
sqft
|
built
1983
829 Glenridge Dr, Edmond, OK 73013
$-214
Cash flow
-3.0%
Cash-on-Cash Return
5.0%
Cap rate
0.7%
Rent to Value Ratio
Active
$169,900
3
bds
|
2
ba
|
0
sqft
|
built
1965
4905 Woodland Park Ter, Spencer, OK 73084
$226
Cash flow
6.9%
Cash-on-Cash Return
7.3%
Cap rate
0.9%
Rent to Value Ratio
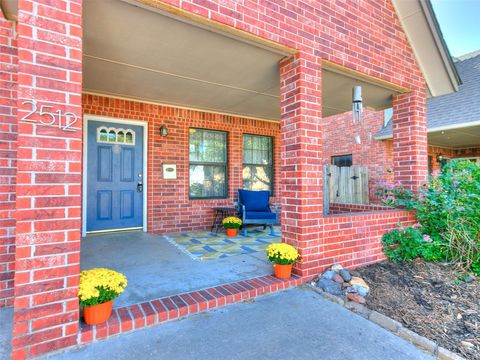
Active
$289,900
4
bds
|
3
ba
|
0
sqft
|
built
2004
2512 NW 24th St, Oklahoma City, OK 73107
$-214
Cash flow
-3.9%
Cash-on-Cash Return
4.8%
Cap rate
0.7%
Rent to Value Ratio
Active
$589,333
3
bds
|
2
ba
|
0
sqft
|
built
1915
615 NW 18th St, Oklahoma City, OK 73103
$-943
Cash flow
-8.3%
Cash-on-Cash Return
3.8%
Cap rate
0.5%
Rent to Value Ratio
Active
$8,500,000
4
bds
|
7
ba
|
10,891
sqft
|
built
1987
2701 Twin Creek Dr, Oklahoma City, OK 73131
$-38,556
Cash flow
-23.7%
Cash-on-Cash Return
0.2%
Cap rate
0.1%
Rent to Value Ratio

Active
$255,000
4
bds
|
2
ba
|
0
sqft
|
built
1920
2744 NW 57th St, Oklahoma City, OK 73112
$-261
Cash flow
-5.3%
Cash-on-Cash Return
4.5%
Cap rate
0.6%
Rent to Value Ratio
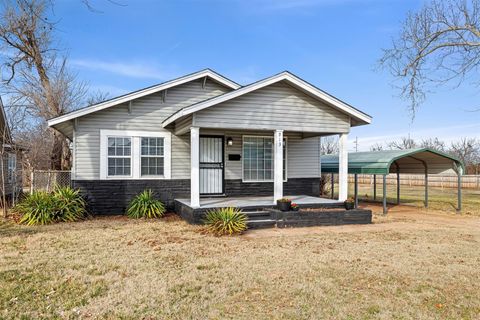
Active
$169,000
3
bds
|
1
ba
|
0
sqft
|
built
1931
913 NE 28th St, Oklahoma City, OK 73105
$69
Cash flow
2.1%
Cash-on-Cash Return
6.2%
Cap rate
0.8%
Rent to Value Ratio
Active
$124,999
3
bds
|
2
ba
|
0
sqft
|
built
1962
3305 S Kelley Ave, Oklahoma City, OK 73129
$28
Cash flow
1.2%
Cash-on-Cash Return
6.0%
Cap rate
0.8%
Rent to Value Ratio
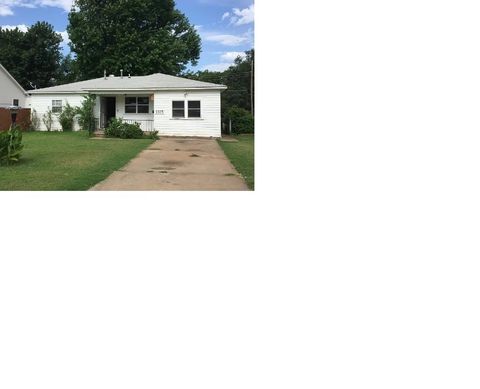
Active
$104,999
2
bds
|
1
ba
|
0
sqft
|
built
1951
4108 SE 10th St, Del City, OK 73115
$213
Cash flow
10.6%
Cash-on-Cash Return
8.1%
Cap rate
1.0%
Rent to Value Ratio
Active
$445,500
5
bds
|
3
ba
|
0
sqft
|
built
2022
6124 Dale Ave, Edmond, OK 73034
$-654
Cash flow
-7.7%
Cash-on-Cash Return
4.5%
Cap rate
0.7%
Rent to Value Ratio

Active
$650,000
3
bds
|
1
ba
|
0
sqft
|
built
1938
16943 NE 23rd St, Choctaw, OK 73020
$-1,776
Cash flow
-14.3%
Cash-on-Cash Return
2.4%
Cap rate
0.3%
Rent to Value Ratio
Active
$165,000
3
bds
|
1
ba
|
0
sqft
|
built
1959
2104 Clary Dr, Midwest City, OK 73110
$-45
Cash flow
-1.4%
Cash-on-Cash Return
5.4%
Cap rate
0.8%
Rent to Value Ratio
Active
$665,000
5
bds
|
5
ba
|
0
sqft
|
built
1972
3158 Thorn Ridge Rd, Oklahoma City, OK 73120
$-1,081
Cash flow
-8.5%
Cash-on-Cash Return
3.7%
Cap rate
0.6%
Rent to Value Ratio

Active
$899,900
5
bds
|
4
ba
|
0
sqft
|
built
2023
1425 N Harvard Ave, Oklahoma City, OK 73127
$-11,728
Cash flow
-68.0%
Cash-on-Cash Return
-10.0%
Cap rate
0.1%
Rent to Value Ratio
Active
$309,999
3
bds
|
3
ba
|
0
sqft
|
built
1969
10813 Quail Cir, Oklahoma City, OK 73120
$-420
Cash flow
-7.1%
Cash-on-Cash Return
4.1%
Cap rate
0.6%
Rent to Value Ratio

Active
$515,000
5
bds
|
3
ba
|
0
sqft
|
built
1966
3305 W Rock Creek Rd, Oklahoma City, OK 73120
$-486
Cash flow
-4.9%
Cash-on-Cash Return
4.5%
Cap rate
0.6%
Rent to Value Ratio

Active
$235,000
2
bds
|
1
ba
|
0
sqft
|
built
1939
614 W Main St, Edmond, OK 73003
$-223
Cash flow
-5.0%
Cash-on-Cash Return
4.5%
Cap rate
0.6%
Rent to Value Ratio

Active
$269,000
5
bds
|
3
ba
|
0
sqft
|
built
1950
1915 S Mansfield Ave, Del City, OK 73115
$-41
Cash flow
-0.8%
Cash-on-Cash Return
5.5%
Cap rate
0.7%
Rent to Value Ratio

Active
$334,990
2
bds
|
3
ba
|
0
sqft
|
built
1974
1110 Sherwood Ln, Nichols Hills, OK 73116
$-927
Cash flow
-14.4%
Cash-on-Cash Return
2.4%
Cap rate
0.6%
Rent to Value Ratio
Active
$498,750
3
bds
|
3
ba
|
0
sqft
|
built
1968
13900 Deer Run, Jones, OK 73049
$-855
Cash flow
-8.9%
Cash-on-Cash Return
3.6%
Cap rate
0.5%
Rent to Value Ratio
Active
$339,900
3
bds
|
3
ba
|
0
sqft
|
built
1954
6301 S Choctaw Rd, Choctaw, OK 73020
$-442
Cash flow
-6.8%
Cash-on-Cash Return
4.1%
Cap rate
0.6%
Rent to Value Ratio
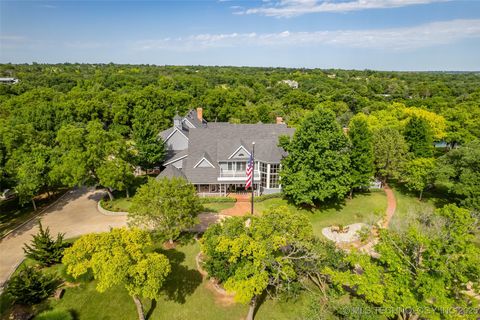
Active
$1,100,000
4
bds
|
5
ba
|
0
sqft
|
built
2006
5900 N Choctaw Rd, Choctaw, OK 73020
$-2,229
Cash flow
-10.6%
Cash-on-Cash Return
3.2%
Cap rate
0.5%
Rent to Value Ratio
Active
$524,900
4
bds
|
0
ba
|
0
sqft
|
built
1951
1823 Dorchester Dr, Nichols Hills, OK 73120
$-1,133
Cash flow
-11.3%
Cash-on-Cash Return
3.1%
Cap rate
0.5%
Rent to Value Ratio

Active
$309,901
3
bds
|
2
ba
|
0
sqft
|
built
2024
20091 Park Ln, Harrah, OK 73045
$-111
Cash flow
-1.9%
Cash-on-Cash Return
5.3%
Cap rate
0.6%
Rent to Value Ratio
Active
$274,700
2
bds
|
1
ba
|
0
sqft
|
built
1947
14536 SE 29th Pl, Choctaw, OK 73020
$-276
Cash flow
-5.2%
Cash-on-Cash Return
4.5%
Cap rate
0.6%
Rent to Value Ratio