Rogers County Investment Properties for Sale
Browse homes for sale and investment properties in Rogers County. Refine your search by price, property type, or more.
Best cash flowing properties in Rogers County
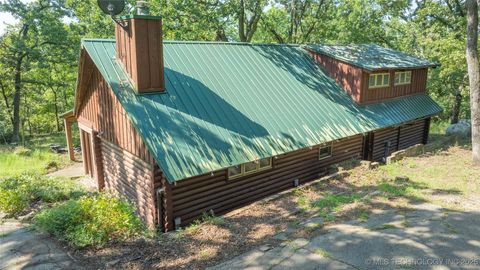
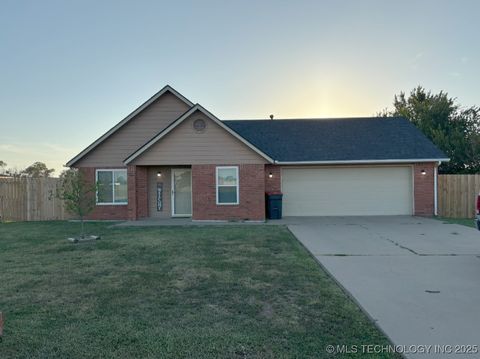
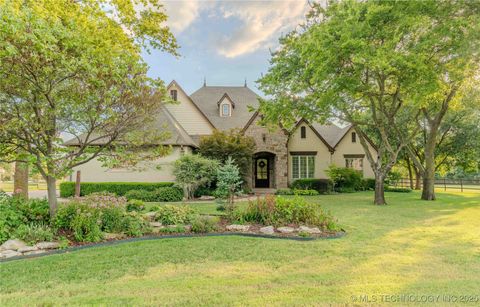
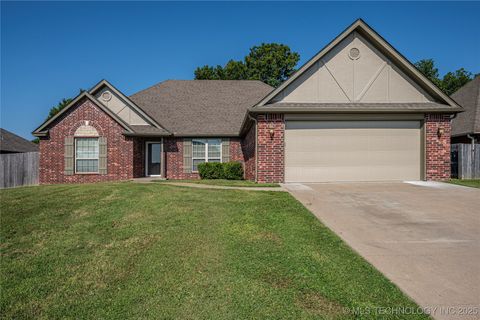
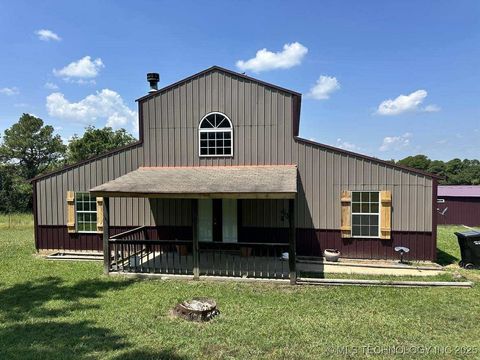
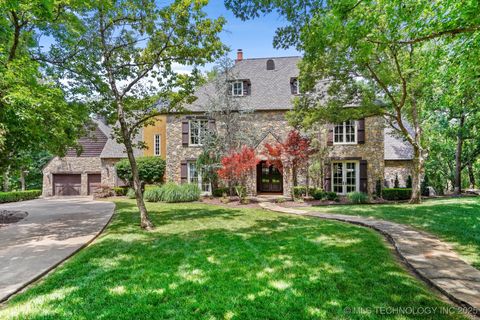
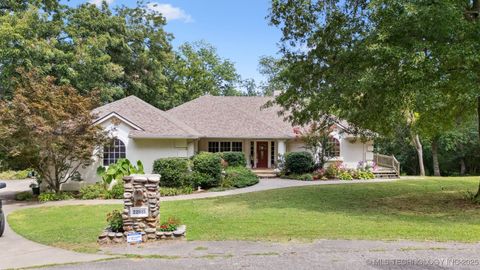
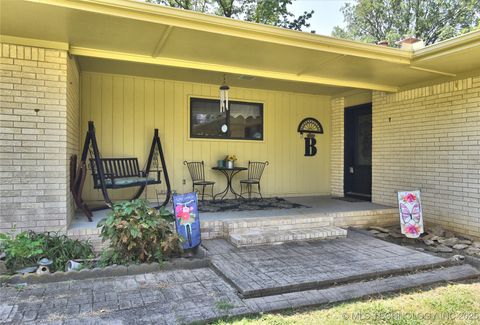
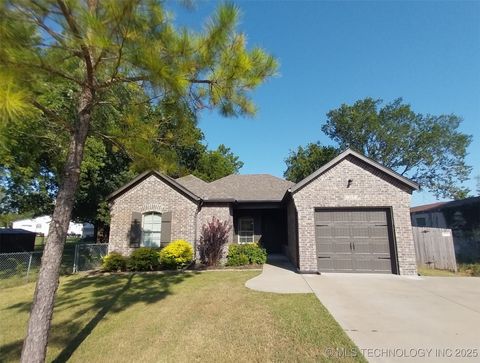
Active
$169,900
1
bds
|
2
ba
|
1,506
sqft
|
built
1978
18402 E 480 Rd, Claremore, OK 74019
$39
Cash flow
1.2%
Cash-on-Cash Return
6.0%
Cap rate
0.8%
Rent to Value Ratio
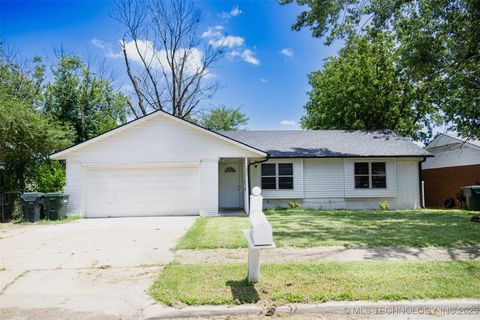
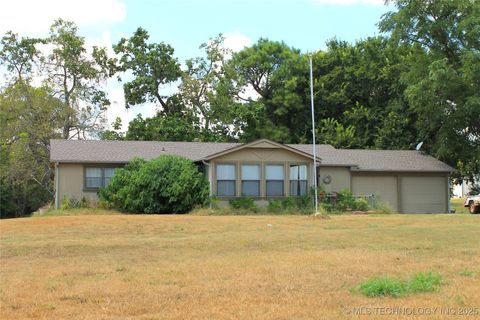
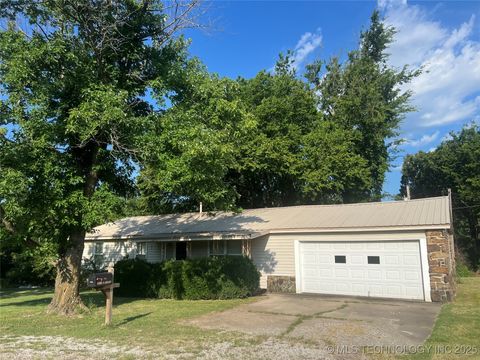
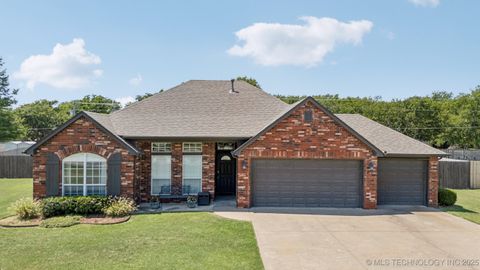
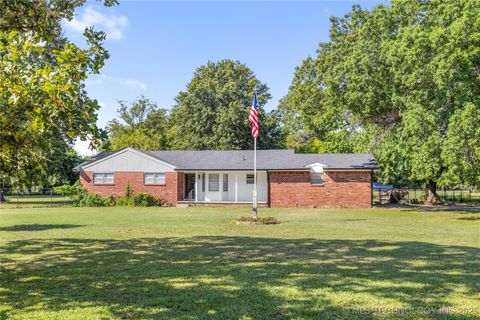
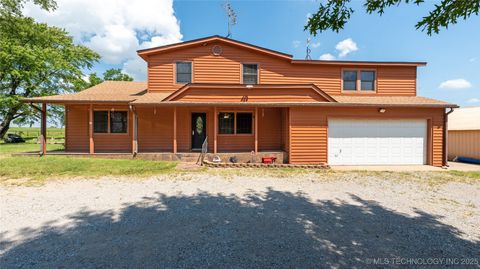
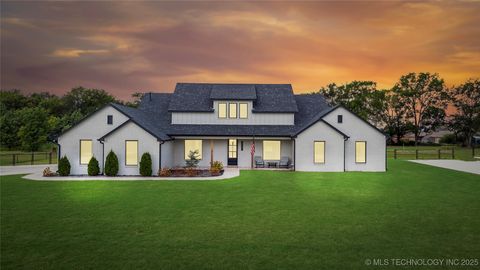
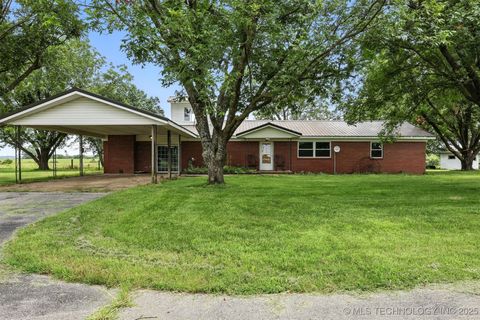
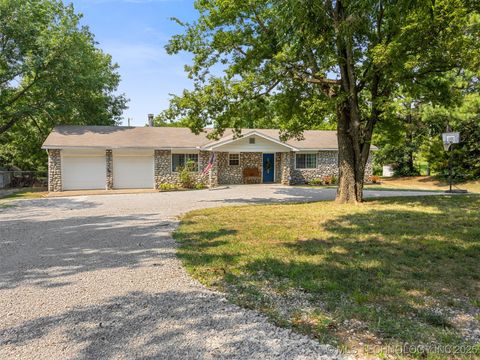
Active
$185,500
3
bds
|
1
ba
|
1,091
sqft
|
built
1971
1606 N Chambers Ter, Claremore, OK 74017
$27
Cash flow
0.8%
Cash-on-Cash Return
5.9%
Cap rate
0.8%
Rent to Value Ratio
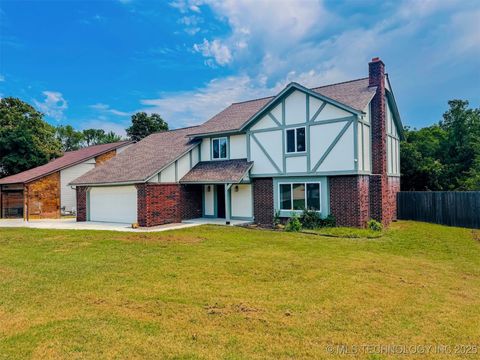
149 out of 239 properties for sale in Rogers County
Limited Results Shown
Create a free account, or log in to reveal all property listings and enjoy the complete experience.
Active
$299,900
3
bds
|
3
ba
|
2,595
sqft
|
built
1957
1335 N Mc Farland Pl, Claremore, OK 74017
$-386
Cash flow
-6.7%
Cash-on-Cash Return
4.1%
Cap rate
0.6%
Rent to Value Ratio
Active
$305,000
4
bds
|
2
ba
|
1,831
sqft
|
built
2021
26550 Columbia Crest Dr, Claremore, OK 74019
$-387
Cash flow
-6.6%
Cash-on-Cash Return
4.2%
Cap rate
0.6%
Rent to Value Ratio
Active
$215,000
3
bds
|
2
ba
|
1,625
sqft
|
built
2003
5950 S Prairie Dr, Chelsea, OK 74016
$-18
Cash flow
-0.4%
Cash-on-Cash Return
5.6%
Cap rate
0.7%
Rent to Value Ratio
Active
$260,000
3
bds
|
2
ba
|
1,483
sqft
|
built
1972
9730 S 4050 Rd, Talala, OK 74080
$-485
Cash flow
-9.7%
Cash-on-Cash Return
3.4%
Cap rate
0.5%
Rent to Value Ratio
Active
$245,000
3
bds
|
2
ba
|
1,431
sqft
|
built
2009
15108 E 108th St N, Owasso, OK 74055
$-261
Cash flow
-5.6%
Cash-on-Cash Return
4.4%
Cap rate
0.7%
Rent to Value Ratio
Active
$525,000
4
bds
|
3
ba
|
2,636
sqft
|
built
2017
2644 Creekview Rd, Oologah, OK 74053
$-742
Cash flow
-7.4%
Cash-on-Cash Return
4.0%
Cap rate
0.6%
Rent to Value Ratio
Active
$899,000
4
bds
|
6
ba
|
4,813
sqft
|
built
2010
6940 N Garden Stone Ln, Owasso, OK 74055
$-1,654
Cash flow
-9.6%
Cash-on-Cash Return
3.5%
Cap rate
0.6%
Rent to Value Ratio
Active
$225,000
3
bds
|
1
ba
|
1,092
sqft
|
built
1979
15333 E Colt Dr, Claremore, OK 74017
$-205
Cash flow
-4.8%
Cash-on-Cash Return
4.6%
Cap rate
0.6%
Rent to Value Ratio
Active
$500,000
2
bds
|
1
ba
|
1,071
sqft
|
built
1972
36087 S 4205 Rd, Inola, OK 74036
$-1,483
Cash flow
-15.5%
Cash-on-Cash Return
2.1%
Cap rate
0.3%
Rent to Value Ratio
Active
$315,000
5
bds
|
3
ba
|
2,175
sqft
|
built
1975
602 Rosewood Ct, Claremore, OK 74017
$-33
Cash flow
-0.5%
Cash-on-Cash Return
5.6%
Cap rate
0.8%
Rent to Value Ratio
Active
$314,900
4
bds
|
2
ba
|
1,856
sqft
|
built
2004
25204 Shade Tree Pl, Claremore, OK 74019
$-488
Cash flow
-8.1%
Cash-on-Cash Return
3.8%
Cap rate
0.6%
Rent to Value Ratio
Active
$320,000
4
bds
|
2
ba
|
1,888
sqft
|
built
2004
7710 N 161st East Ct, Owasso, OK 74055
$-498
Cash flow
-8.1%
Cash-on-Cash Return
3.8%
Cap rate
0.6%
Rent to Value Ratio
Active
$450,000
4
bds
|
4
ba
|
2,328
sqft
|
built
2021
13801 E 460 Rd, Claremore, OK 74017
$-531
Cash flow
-6.2%
Cash-on-Cash Return
4.3%
Cap rate
0.6%
Rent to Value Ratio
Active
$595,000
3
bds
|
3
ba
|
2,548
sqft
|
built
1980
8401 S 4130 Rd, Talala, OK 74080
$-820
Cash flow
-7.2%
Cash-on-Cash Return
4.0%
Cap rate
0.5%
Rent to Value Ratio
Active
$415,000
4
bds
|
3
ba
|
2,760
sqft
|
built
2007
11822 S Rawhide Rd, Claremore, OK 74017
$-884
Cash flow
-11.1%
Cash-on-Cash Return
3.1%
Cap rate
0.4%
Rent to Value Ratio
Active
$259,000
4
bds
|
2
ba
|
1,605
sqft
|
built
1970
5950 E Everetts Pt, Oologah, OK 74053
$-315
Cash flow
-6.3%
Cash-on-Cash Return
4.2%
Cap rate
0.6%
Rent to Value Ratio
Active
$680,000
4
bds
|
3
ba
|
3,380
sqft
|
built
2005
3300 S 4230 Rd, Chelsea, OK 74016
$-1,427
Cash flow
-10.9%
Cash-on-Cash Return
3.2%
Cap rate
0.4%
Rent to Value Ratio
Active
$285,000
2
bds
|
2
ba
|
1,762
sqft
|
built
1982
6255 E Canyon View Dr, Claremore, OK 74019
$-337
Cash flow
-6.2%
Cash-on-Cash Return
4.3%
Cap rate
0.6%
Rent to Value Ratio
Active
$850,000
4
bds
|
5
ba
|
5,110
sqft
|
built
2001
10144 N Dover Pl, Owasso, OK 74055
$-1,309
Cash flow
-8.0%
Cash-on-Cash Return
3.8%
Cap rate
0.6%
Rent to Value Ratio
Active
$699,000
5
bds
|
4
ba
|
4,104
sqft
|
built
1985
23611 E 300 Rd, Chelsea, OK 74016
$-786
Cash flow
-5.9%
Cash-on-Cash Return
4.3%
Cap rate
0.6%
Rent to Value Ratio
Active
$249,300
4
bds
|
2
ba
|
1,552
sqft
|
built
1963
17995 S 4160 Rd, Claremore, OK 74017
$-184
Cash flow
-3.9%
Cash-on-Cash Return
4.8%
Cap rate
0.6%
Rent to Value Ratio
Active
$585,900
4
bds
|
4
ba
|
3,243
sqft
|
built
2019
5256 E Hickory Hollow Dr, Claremore, OK 74019
$-871
Cash flow
-7.8%
Cash-on-Cash Return
3.9%
Cap rate
0.6%
Rent to Value Ratio
Active
$525,000
3
bds
|
4
ba
|
3,506
sqft
|
built
1998
22815 Woodridge Dr, Claremore, OK 74019
$-565
Cash flow
-5.6%
Cash-on-Cash Return
4.4%
Cap rate
0.5%
Rent to Value Ratio
Active
$735,000
4
bds
|
4
ba
|
3,525
sqft
|
built
2023
24580 S Eliza Dr, Claremore, OK 74019
$-1,191
Cash flow
-8.5%
Cash-on-Cash Return
3.7%
Cap rate
0.5%
Rent to Value Ratio
Active
$525,000
3
bds
|
4
ba
|
3,142
sqft
|
built
1992
5633 E Covey Ct, Claremore, OK 74019
$-1,067
Cash flow
-10.6%
Cash-on-Cash Return
3.2%
Cap rate
0.5%
Rent to Value Ratio

Active
$298,000
4
bds
|
3
ba
|
1,770
sqft
|
built
2017
14602 E 114th St N, Owasso, OK 74055
$-411
Cash flow
-7.2%
Cash-on-Cash Return
4.0%
Cap rate
0.6%
Rent to Value Ratio
Active
$115,000
3
bds
|
2
ba
|
1,694
sqft
|
built
1979
17101 E Newton Pl, Tulsa, OK 74116
$-115
Cash flow
-5.2%
Cash-on-Cash Return
4.5%
Cap rate
1.4%
Rent to Value Ratio
Active
$380,000
3
bds
|
3
ba
|
2,562
sqft
|
built
1978
9452 E 460 Rd, Claremore, OK 74017
$-495
Cash flow
-6.8%
Cash-on-Cash Return
4.1%
Cap rate
0.6%
Rent to Value Ratio
Active
$545,000
3
bds
|
2
ba
|
2,146
sqft
|
built
1967
2251 S 4260 Rd, Chelsea, OK 74016
$-1,085
Cash flow
-10.4%
Cash-on-Cash Return
3.3%
Cap rate
0.4%
Rent to Value Ratio
Active
$542,662
4
bds
|
2
ba
|
2,266
sqft
|
built
2006
19854 E 470 Rd, Claremore, OK 74019
$-1,163
Cash flow
-11.2%
Cash-on-Cash Return
3.1%
Cap rate
0.4%
Rent to Value Ratio
Active
$210,000
3
bds
|
2
ba
|
1,152
sqft
|
built
2005
310 N Cromwell St, Catoosa, OK 74015
$-136
Cash flow
-3.4%
Cash-on-Cash Return
4.9%
Cap rate
0.7%
Rent to Value Ratio
Active
$214,900
3
bds
|
1
ba
|
1,305
sqft
|
built
2016
217 N Cromwell St, Catoosa, OK 74015
$-132
Cash flow
-3.2%
Cash-on-Cash Return
4.9%
Cap rate
0.7%
Rent to Value Ratio
Active
$240,000
3
bds
|
2
ba
|
1,352
sqft
|
built
1977
11971 E 400 Rd, Claremore, OK 74017
$-244
Cash flow
-5.3%
Cash-on-Cash Return
4.5%
Cap rate
0.6%
Rent to Value Ratio
Active
$310,000
4
bds
|
3
ba
|
2,289
sqft
|
built
1978
2502 W Driftwood Dr, Claremore, OK 74017
$-399
Cash flow
-6.7%
Cash-on-Cash Return
4.1%
Cap rate
0.6%
Rent to Value Ratio
Active
$620,000
3
bds
|
2
ba
|
1,752
sqft
|
built
1968
16370 E 450 Rd, Claremore, OK 74017
$-1,791
Cash flow
-15.1%
Cash-on-Cash Return
2.2%
Cap rate
0.3%
Rent to Value Ratio
Active
$299,000
3
bds
|
3
ba
|
2,415
sqft
|
built
1992
11901 Laurel Ln, Claremore, OK 74017
$-391
Cash flow
-6.8%
Cash-on-Cash Return
4.1%
Cap rate
0.6%
Rent to Value Ratio
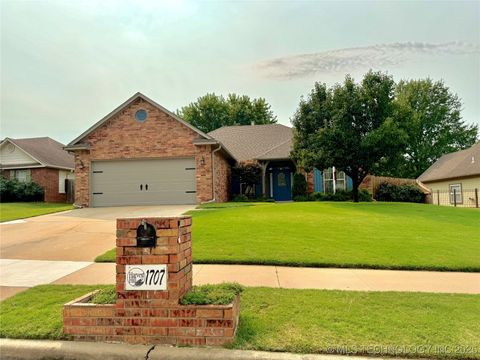
Active
$262,500
4
bds
|
2
ba
|
1,661
sqft
|
built
2001
1707 Walnut Hill Ln, Claremore, OK 74019
$-309
Cash flow
-6.1%
Cash-on-Cash Return
4.3%
Cap rate
0.6%
Rent to Value Ratio
Active
$217,500
3
bds
|
2
ba
|
1,152
sqft
|
built
2011
25082 S Brook Ln, Claremore, OK 74019
$-218
Cash flow
-5.2%
Cash-on-Cash Return
4.5%
Cap rate
0.6%
Rent to Value Ratio