Oklahoma Investment Properties for Sale
Browse homes for sale and investment properties in Oklahoma. Refine your search by price, property type, or more.
Best cash flowing properties in Oklahoma
Active
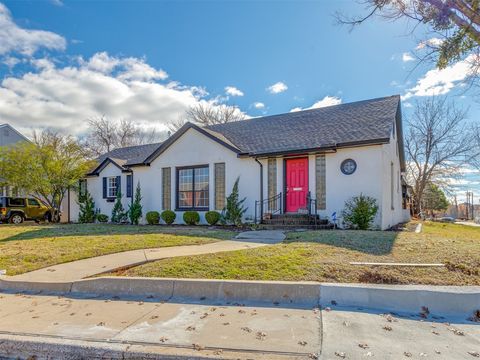
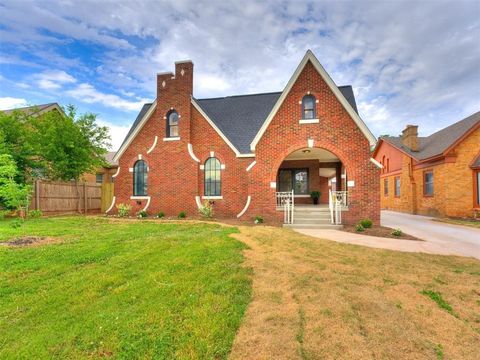
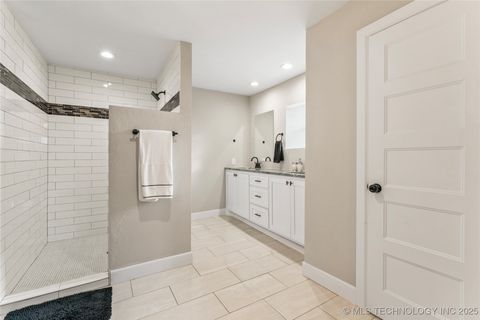
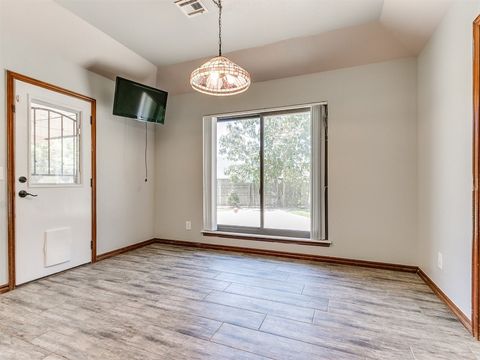
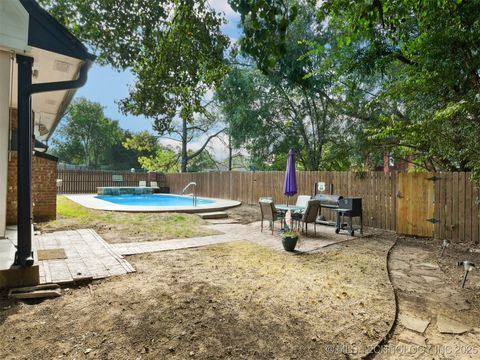
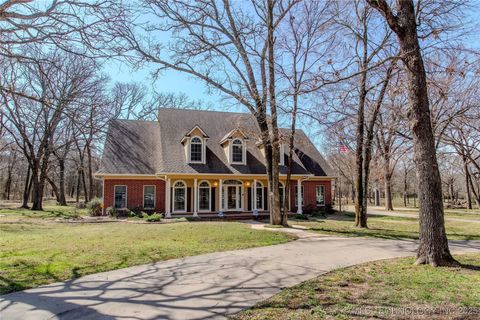
$35,000
5
bds
|
2
ba
|
2,566
sqft
|
built
1930
419 Callahan St, Muskogee, OK 74403
$806
Cash flow
26.8%
Cash-on-Cash Return
27.6%
Cap rate
3.4%
Rent to Value Ratio
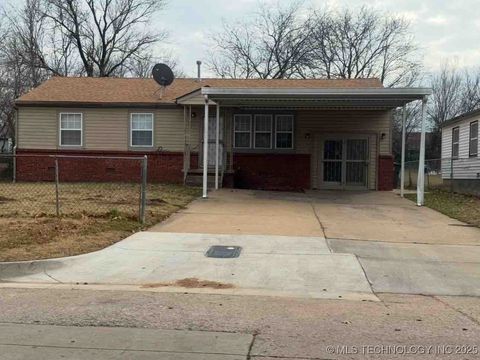
Active
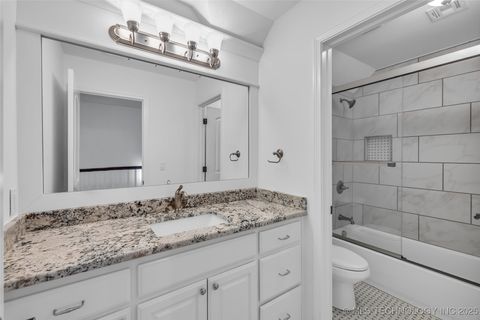
$265,000
3
bds
|
2
ba
|
0
sqft
|
built
2023
607 SW 31st St, Oklahoma City, OK 73109
$124
Cash flow
2.4%
Cash-on-Cash Return
6.2%
Cap rate
0.8%
Rent to Value Ratio
6,621 out of 13,274 properties for sale in Oklahoma
Limited Results Shown
Create a free account, or log in to reveal all property listings and enjoy the complete experience.
Active
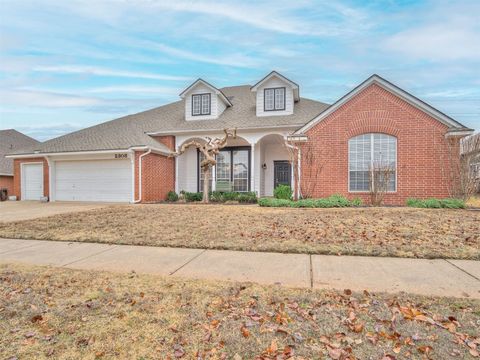
$1,895,000
5
bds
|
7
ba
|
0
sqft
|
built
1997
5616 New Canaan Rd, Edmond, OK 73034
$-6,131
Cash flow
-16.9%
Cash-on-Cash Return
1.8%
Cap rate
0.3%
Rent to Value Ratio
Active
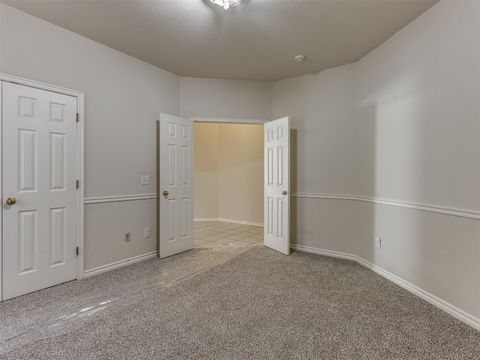
$277,500
3
bds
|
2
ba
|
0
sqft
|
built
1956
1847 N Allen Ln, Oklahoma City, OK 73127
$-138
Cash flow
-2.6%
Cash-on-Cash Return
5.1%
Cap rate
0.6%
Rent to Value Ratio
Active
$306,500
3
bds
|
3
ba
|
2,202
sqft
|
built
2006
4419 Fairview Rd, Bartlesville, OK 74006
$-452
Cash flow
-7.7%
Cash-on-Cash Return
3.9%
Cap rate
0.6%
Rent to Value Ratio
Active
$209,000
2
bds
|
1
ba
|
0
sqft
|
built
1923
2244 NW 20th St, Oklahoma City, OK 73107
$102
Cash flow
2.5%
Cash-on-Cash Return
6.3%
Cap rate
0.8%
Rent to Value Ratio
Active
$550,000
4
bds
|
5
ba
|
0
sqft
|
built
2001
6200 Blue Hills Ct, Norman, OK 73026
$-752
Cash flow
-7.1%
Cash-on-Cash Return
4.0%
Cap rate
0.7%
Rent to Value Ratio
Active
$889,999
5
bds
|
6
ba
|
4,615
sqft
|
built
2020
5804 W Waco St, Broken Arrow, OK 74011
$-1,947
Cash flow
-11.4%
Cash-on-Cash Return
3.1%
Cap rate
0.6%
Rent to Value Ratio

Active
$139,900
3
bds
|
3
ba
|
0
sqft
|
built
1975
8808 N Rockwell Dr, Oklahoma City, OK 73132
$-94
Cash flow
-3.5%
Cash-on-Cash Return
4.9%
Cap rate
1.0%
Rent to Value Ratio
Active
$277,900
3
bds
|
2
ba
|
2,188
sqft
|
built
1975
515 E South Ave, Fort Gibson, OK 74434
$-115
Cash flow
-2.2%
Cash-on-Cash Return
5.2%
Cap rate
0.7%
Rent to Value Ratio
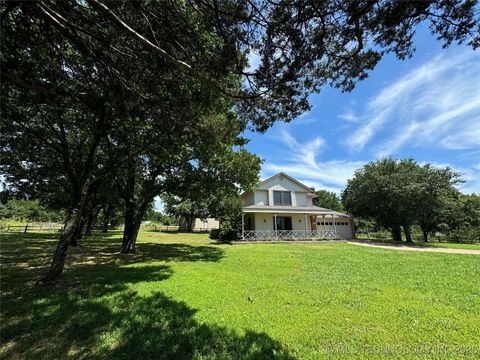
Active
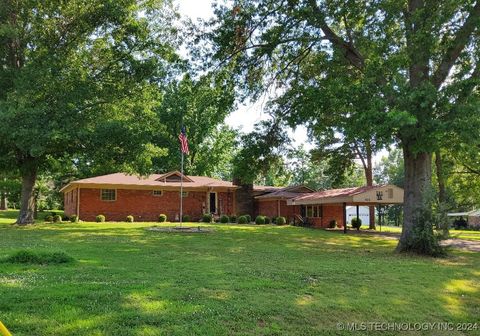
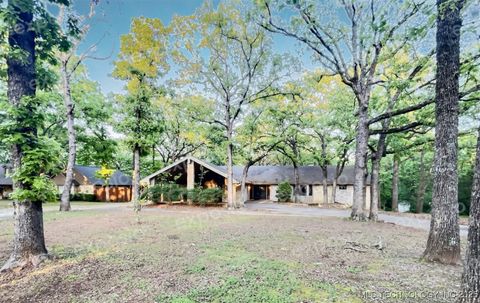
$499,900
5
bds
|
4
ba
|
5,500
sqft
|
built
1982
1824 Radio Rd, Durant, OK 74701
$-907
Cash flow
-9.5%
Cash-on-Cash Return
3.5%
Cap rate
0.6%
Rent to Value Ratio
Active
$539,000
3
bds
|
4
ba
|
0
sqft
|
built
2001
5100 Burr Oaks Rd, Oklahoma City, OK 73105
$-630
Cash flow
-6.1%
Cash-on-Cash Return
4.3%
Cap rate
0.6%
Rent to Value Ratio
Active
$540,000
3
bds
|
3
ba
|
2,337
sqft
|
built
2006
2480 Gene Autry Rd, Ardmore, OK 73401
$-1,191
Cash flow
-11.5%
Cash-on-Cash Return
3.0%
Cap rate
0.5%
Rent to Value Ratio
Active
$649,900
3
bds
|
3
ba
|
0
sqft
|
built
2022
10022 Deer Creek Rd, Weatherford, OK 73096
$-2,112
Cash flow
-17.0%
Cash-on-Cash Return
1.8%
Cap rate
0.3%
Rent to Value Ratio
Active
$399,900
3
bds
|
2
ba
|
2,874
sqft
|
built
2009
7816 E Galveston St, Broken Arrow, OK 74014
$-558
Cash flow
-7.3%
Cash-on-Cash Return
4.0%
Cap rate
0.7%
Rent to Value Ratio
Active
$259,000
3
bds
|
2
ba
|
0
sqft
|
built
1931
4603 N Wheeler Ave, Bethany, OK 73008
$-153
Cash flow
-3.1%
Cash-on-Cash Return
5.0%
Cap rate
0.8%
Rent to Value Ratio
Active
$35,000
5
bds
|
2
ba
|
2,566
sqft
|
built
1930
419 Callahan St, Muskogee, OK 74403
$806
Cash flow
26.8%
Cash-on-Cash Return
27.6%
Cap rate
3.4%
Rent to Value Ratio
Active
$699,000
5
bds
|
6
ba
|
5,650
sqft
|
built
1989
1224 Garner Ave, Tahlequah, OK 74464
$-1,613
Cash flow
-12.0%
Cash-on-Cash Return
2.9%
Cap rate
0.4%
Rent to Value Ratio
Active
$320,000
3
bds
|
2
ba
|
0
sqft
|
built
1947
2832 NW 45th St, Oklahoma City, OK 73112
$-282
Cash flow
-4.6%
Cash-on-Cash Return
4.6%
Cap rate
0.7%
Rent to Value Ratio
Active
$589,000
4
bds
|
3
ba
|
3,123
sqft
|
built
2018
12050 S 68th East Ave, Bixby, OK 74008
$-932
Cash flow
-8.3%
Cash-on-Cash Return
3.8%
Cap rate
0.6%
Rent to Value Ratio
Active
$425,000
4
bds
|
3
ba
|
0
sqft
|
built
1997
2308 Renwick Ave, Oklahoma City, OK 73128
$-502
Cash flow
-6.2%
Cash-on-Cash Return
4.3%
Cap rate
0.6%
Rent to Value Ratio
Active
$269,000
3
bds
|
2
ba
|
0
sqft
|
built
2002
25 Red Admiral Way, Edmond, OK 73013
$-619
Cash flow
-12.0%
Cash-on-Cash Return
2.9%
Cap rate
0.6%
Rent to Value Ratio
Active
$265,000
3
bds
|
2
ba
|
0
sqft
|
built
2023
607 SW 31st St, Oklahoma City, OK 73109
$124
Cash flow
2.4%
Cash-on-Cash Return
6.2%
Cap rate
0.8%
Rent to Value Ratio
Active
$625,000
5
bds
|
4
ba
|
0
sqft
|
built
1928
809 NE 18th St, Oklahoma City, OK 73105
$-724
Cash flow
-6.0%
Cash-on-Cash Return
4.3%
Cap rate
0.6%
Rent to Value Ratio
Active
$568,000
5
bds
|
5
ba
|
4,289
sqft
|
built
1930
2448 E 56th Pl, Tulsa, OK 74105
$-490
Cash flow
-4.5%
Cash-on-Cash Return
4.6%
Cap rate
0.6%
Rent to Value Ratio
Active
$400,000
4
bds
|
3
ba
|
0
sqft
|
built
1996
1309 Nottingham Cir, Shawnee, OK 74804
$-571
Cash flow
-7.4%
Cash-on-Cash Return
4.0%
Cap rate
0.5%
Rent to Value Ratio
Active
$349,000
3
bds
|
3
ba
|
2,349
sqft
|
built
2000
2324 S Rockford Pkwy, Ardmore, OK 73401
$-598
Cash flow
-8.9%
Cash-on-Cash Return
3.6%
Cap rate
0.6%
Rent to Value Ratio
Active
$311,900
4
bds
|
2
ba
|
2,207
sqft
|
built
1984
13850 E 121st St S, Gore, OK 74435
$-66
Cash flow
-1.1%
Cash-on-Cash Return
5.4%
Cap rate
0.7%
Rent to Value Ratio
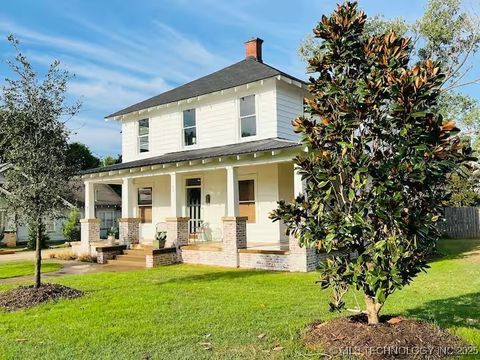
Active
$329,000
4
bds
|
3
ba
|
2,603
sqft
|
built
1938
421 N 9th Ave, Durant, OK 74701
$82
Cash flow
1.3%
Cash-on-Cash Return
6.0%
Cap rate
0.8%
Rent to Value Ratio
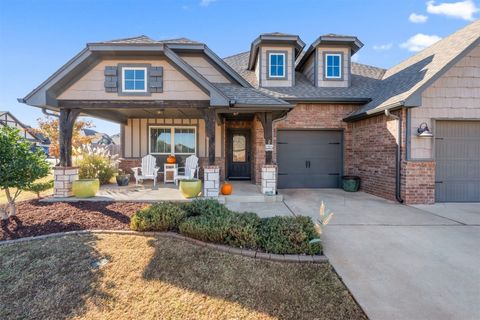
Active
$419,000
4
bds
|
3
ba
|
0
sqft
|
built
2017
4809 Crater Lake Dr, Edmond, OK 73025
$-447
Cash flow
-5.6%
Cash-on-Cash Return
4.4%
Cap rate
0.7%
Rent to Value Ratio
Active
$395,000
3
bds
|
3
ba
|
0
sqft
|
built
2009
5609 NW 130th St, Oklahoma City, OK 73142
$-570
Cash flow
-7.5%
Cash-on-Cash Return
3.9%
Cap rate
0.6%
Rent to Value Ratio

Active
$350,000
3
bds
|
3
ba
|
0
sqft
|
built
2000
1261 Paulette, Piedmont, OK 73078
$-478
Cash flow
-7.1%
Cash-on-Cash Return
4.0%
Cap rate
0.6%
Rent to Value Ratio
Active
$399,000
3
bds
|
2
ba
|
0
sqft
|
built
1936
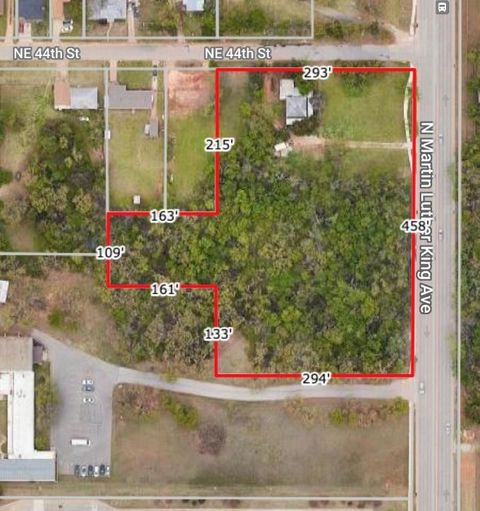
4435 N Martin Luther King Ave, Oklahoma City, OK 73111
$-461
Cash flow
-6.0%
Cash-on-Cash Return
4.3%
Cap rate
0.6%
Rent to Value Ratio
Active
$312,000
3
bds
|
2
ba
|
0
sqft
|
built
2001
1801 Del Simmons Dr, Edmond, OK 73003
$-379
Cash flow
-6.3%
Cash-on-Cash Return
4.2%
Cap rate
0.6%
Rent to Value Ratio
Active
$900,000
4
bds
|
5
ba
|
0
sqft
|
built
1987
5801 Oak Tree Rd, Edmond, OK 73025
$-1,687
Cash flow
-9.8%
Cash-on-Cash Return
3.4%
Cap rate
0.6%
Rent to Value Ratio
Active
$930,000
4
bds
|
2
ba
|
0
sqft
|
built
1965
13902 Valley View Rd, Shawnee, OK 74804
$-2,293
Cash flow
-12.9%
Cash-on-Cash Return
2.7%
Cap rate
0.3%
Rent to Value Ratio
Active
$1,200,000
6
bds
|
9
ba
|
0
sqft
|
built
1969
2961 Twin Acres Dr, Norman, OK 73071
$-2,718
Cash flow
-11.8%
Cash-on-Cash Return
3.0%
Cap rate
0.4%
Rent to Value Ratio
Active
$750,000
2
bds
|
1
ba
|
1,120
sqft
|
built
2015
249 Ag Rd, Ardmore, OK 73401
$-2,541
Cash flow
-17.7%
Cash-on-Cash Return
1.6%
Cap rate
0.3%
Rent to Value Ratio
Active
$1,250,000
6
bds
|
5
ba
|
0
sqft
|
built
2014
5451 Cottonwood Creek Cir, Norman, OK 73069
$-3,424
Cash flow
-14.3%
Cash-on-Cash Return
2.4%
Cap rate
0.4%
Rent to Value Ratio
Active
$899,800
4
bds
|
4
ba
|
0
sqft
|
built
2024
2220 NW 27th St, Oklahoma City, OK 73107
$-3,150
Cash flow
-18.3%
Cash-on-Cash Return
1.5%
Cap rate
0.2%
Rent to Value Ratio
Active
$498,900
5
bds
|
5
ba
|
4,957
sqft
|
built
1995
8031 W 16th St N, Muskogee, OK 74401
$-608
Cash flow
-6.4%
Cash-on-Cash Return
4.2%
Cap rate
0.6%
Rent to Value Ratio
Active
$135,000
3
bds
|
1
ba
|
864
sqft
|
built
1956
134 W 50th Ct N, Tulsa, OK 74126
$-256
Cash flow
-9.9%
Cash-on-Cash Return
3.4%
Cap rate
0.8%
Rent to Value Ratio