Oklahoma Investment Properties for Sale
Browse homes for sale and investment properties in Oklahoma. Refine your search by price, property type, or more.
Best cash flowing properties in Oklahoma
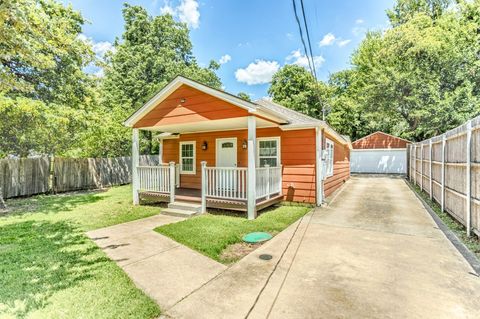
Active
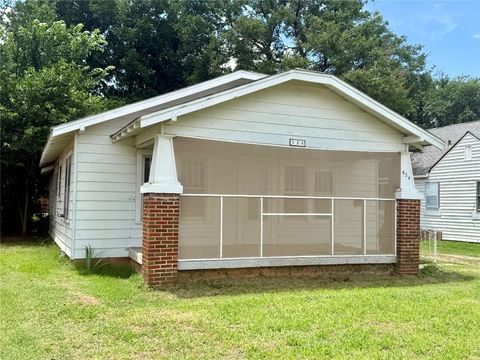
$52,000
3
bds
|
1
ba
|
0
sqft
|
built
1930
524 S 8th St, Clinton, OK 73601
$520
Cash flow
11.7%
Cash-on-Cash Return
12.0%
Cap rate
1.5%
Rent to Value Ratio
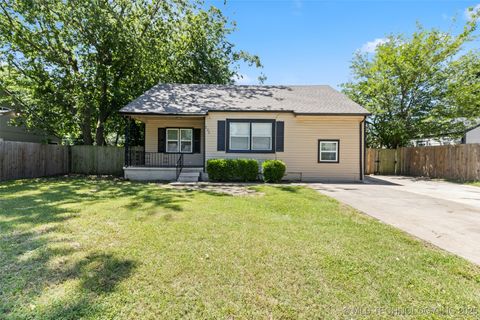
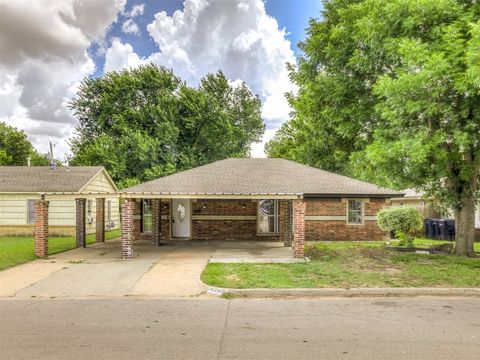
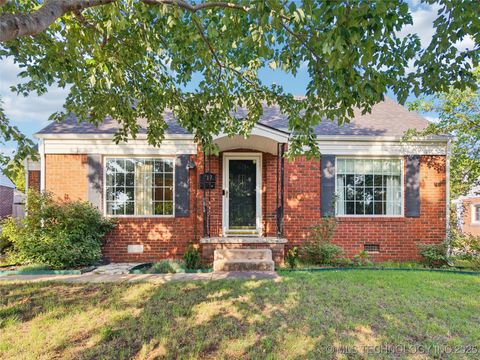
Active
$135,000
4
bds
|
1
ba
|
881
sqft
|
built
1942
232 E Mohawk Blvd, Tulsa, OK 74106
$210
Cash flow
8.1%
Cash-on-Cash Return
7.5%
Cap rate
1.0%
Rent to Value Ratio
6,463 out of 13,363 properties for sale in Oklahoma
Limited Results Shown
Create a free account, or log in to reveal all property listings and enjoy the complete experience.
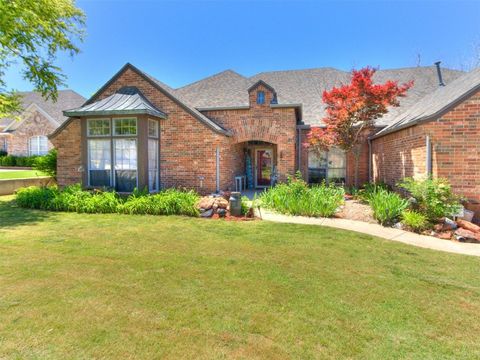
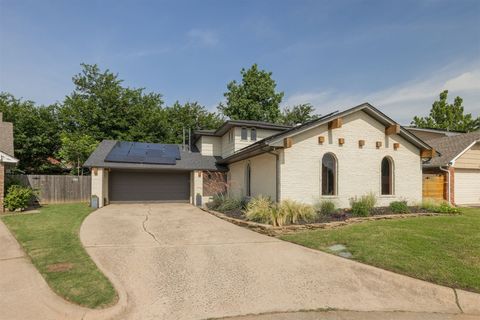
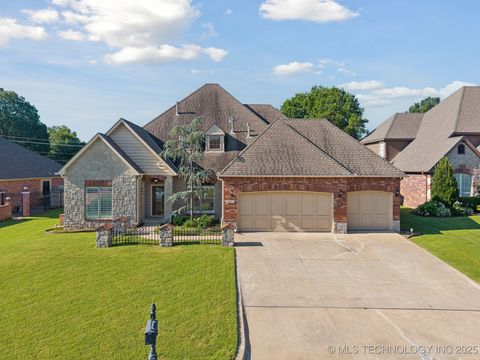
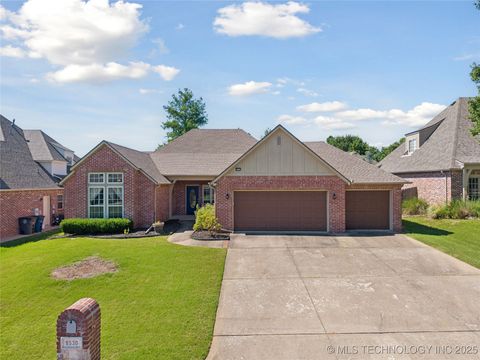
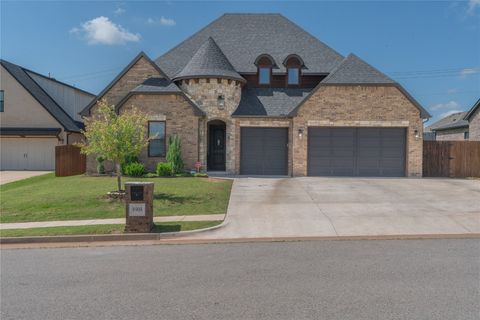
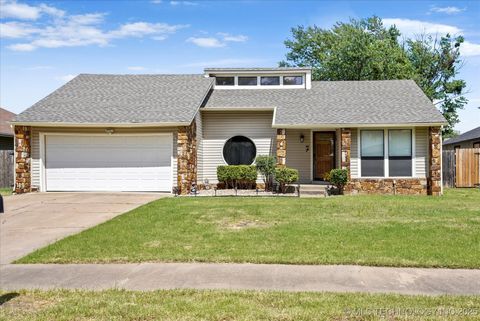
Active
$515,000
4
bds
|
4
ba
|
0
sqft
|
built
1996
19609 Filly Dr, Edmond, OK 73012
$-688
Cash flow
-7.0%
Cash-on-Cash Return
4.1%
Cap rate
0.6%
Rent to Value Ratio
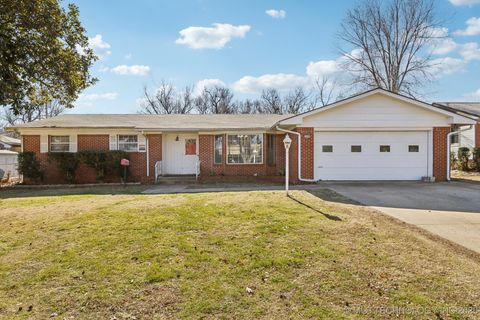
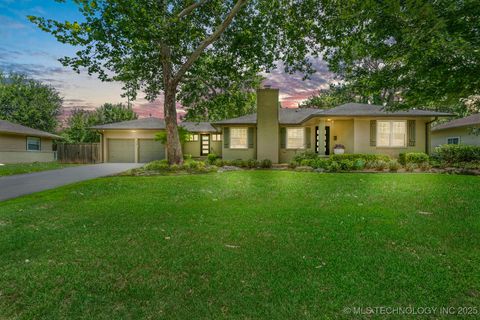
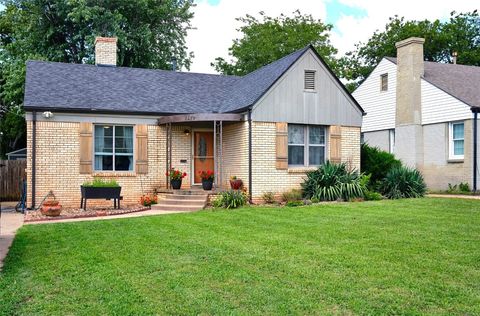
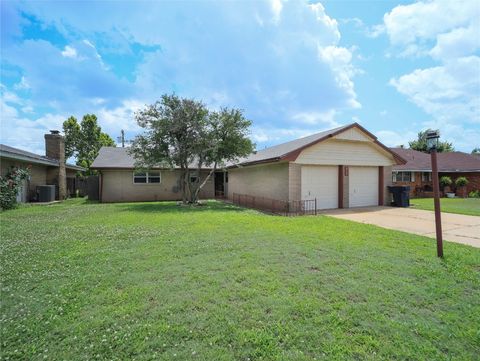
Active
$169,500
3
bds
|
2
ba
|
1,625
sqft
|
built
1965
1908 E 10th St, Okmulgee, OK 74447
$152
Cash flow
4.7%
Cash-on-Cash Return
6.8%
Cap rate
0.9%
Rent to Value Ratio
Active
$340,000
4
bds
|
4
ba
|
0
sqft
|
built
1972
9209 Knightsbridge Rd, Oklahoma City, OK 73132
$-467
Cash flow
-7.2%
Cash-on-Cash Return
4.0%
Cap rate
0.6%
Rent to Value Ratio
Active
$150,000
2
bds
|
1
ba
|
0
sqft
|
built
1937
1624 N Mc Millan Ave, Oklahoma City, OK 73127
$6
Cash flow
0.2%
Cash-on-Cash Return
5.7%
Cap rate
0.8%
Rent to Value Ratio
Active
$169,500
3
bds
|
2
ba
|
0
sqft
|
built
1952
4024 S Brookline Ave, Oklahoma City, OK 73119
$60
Cash flow
1.8%
Cash-on-Cash Return
6.1%
Cap rate
0.8%
Rent to Value Ratio
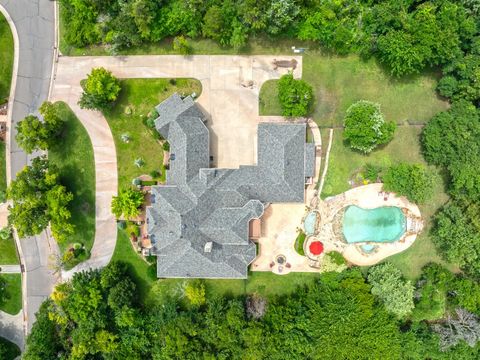
Active
$600,000
4
bds
|
4
ba
|
2,543
sqft
|
built
1954
3447 S Gary Pl, Tulsa, OK 74105
$-1,371
Cash flow
-11.9%
Cash-on-Cash Return
2.9%
Cap rate
0.5%
Rent to Value Ratio
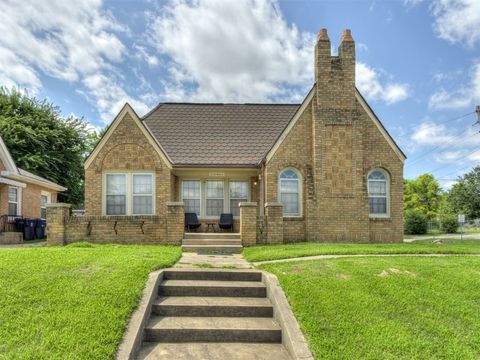
Active
$395,000
3
bds
|
2
ba
|
2,103
sqft
|
built
1958
3432 E 57th Pl, Tulsa, OK 74135
$-769
Cash flow
-10.2%
Cash-on-Cash Return
3.3%
Cap rate
0.5%
Rent to Value Ratio
Active
$220,500
3
bds
|
2
ba
|
1,395
sqft
|
built
1943
717 S Pittsburg Ave, Tulsa, OK 74112
$-87
Cash flow
-2.1%
Cash-on-Cash Return
5.2%
Cap rate
0.7%
Rent to Value Ratio
Active
$364,900
4
bds
|
3
ba
|
2,639
sqft
|
built
2005
9222 E 80th Pl, Tulsa, OK 74133
$-532
Cash flow
-7.6%
Cash-on-Cash Return
3.9%
Cap rate
0.6%
Rent to Value Ratio
Active
$230,000
3
bds
|
2
ba
|
0
sqft
|
built
1940
2629 Cashion Pl, Oklahoma City, OK 73112
$-155
Cash flow
-3.5%
Cash-on-Cash Return
4.9%
Cap rate
0.7%
Rent to Value Ratio
Active
$220,000
3
bds
|
2
ba
|
1,692
sqft
|
built
1961
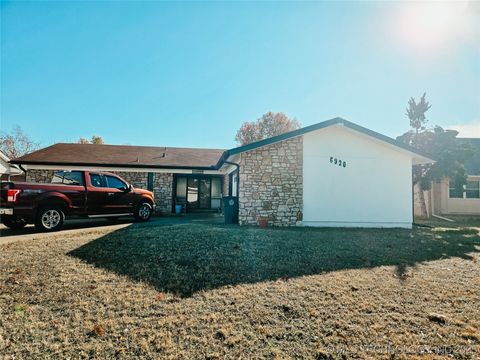
6920 E 20th St, Tulsa, OK 74112
$-151
Cash flow
-3.6%
Cash-on-Cash Return
4.9%
Cap rate
0.7%
Rent to Value Ratio
Active
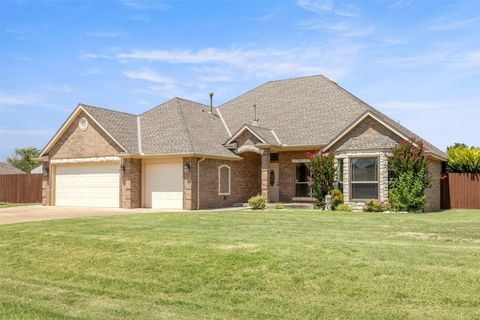
$420,000
3
bds
|
3
ba
|
0
sqft
|
built
2008
18395 Wild Horse Trl, Norman, OK 73072
$-551
Cash flow
-6.8%
Cash-on-Cash Return
4.1%
Cap rate
0.6%
Rent to Value Ratio
Active
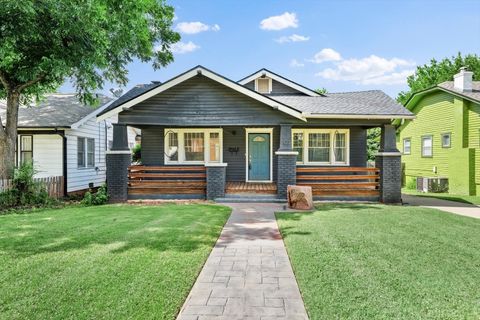
$215,000
2
bds
|
1
ba
|
0
sqft
|
built
1922
833 NW 34th St, Oklahoma City, OK 73118
$-34
Cash flow
-0.8%
Cash-on-Cash Return
5.5%
Cap rate
0.8%
Rent to Value Ratio
Active
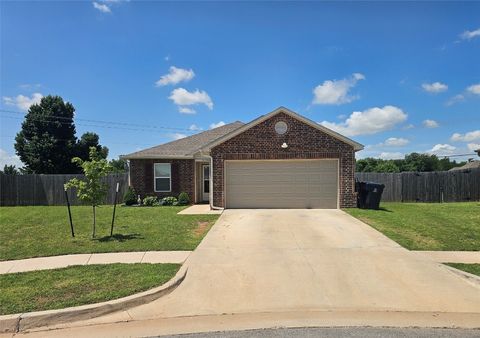
$207,000
3
bds
|
2
ba
|
0
sqft
|
built
2020
10544 NW 17th St, Oklahoma City, OK 73127
$-156
Cash flow
-3.9%
Cash-on-Cash Return
4.8%
Cap rate
0.7%
Rent to Value Ratio
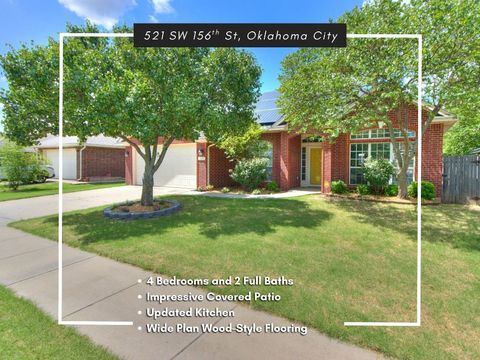
Active
$284,900
4
bds
|
2
ba
|
0
sqft
|
built
2000
521 SW 156th St, Oklahoma City, OK 73170
$-326
Cash flow
-6.0%
Cash-on-Cash Return
4.3%
Cap rate
0.6%
Rent to Value Ratio
Active
$415,000
2
bds
|
2
ba
|
1,604
sqft
|
built
1939
3202 S Detroit Ave, Tulsa, OK 74105
$-954
Cash flow
-12.0%
Cash-on-Cash Return
2.9%
Cap rate
0.5%
Rent to Value Ratio
Active
$227,000
3
bds
|
2
ba
|
1,272
sqft
|
built
1957
3926 E 51st Pl, Tulsa, OK 74135
$-156
Cash flow
-3.6%
Cash-on-Cash Return
4.9%
Cap rate
0.7%
Rent to Value Ratio

Active
$199,896
3
bds
|
2
ba
|
1,261
sqft
|
built
1940
1720 N Elgin Ave, Tulsa, OK 74106
$-50
Cash flow
-1.3%
Cash-on-Cash Return
5.4%
Cap rate
0.8%
Rent to Value Ratio
Active
$395,000
3
bds
|
2
ba
|
2,288
sqft
|
built
1960
4706 S Madison Ave, Tulsa, OK 74105
$-969
Cash flow
-12.8%
Cash-on-Cash Return
2.7%
Cap rate
0.4%
Rent to Value Ratio
Active
$300,000
4
bds
|
3
ba
|
2,850
sqft
|
built
1970
2962 E 77th Pl, Tulsa, OK 74136
$-164
Cash flow
-2.9%
Cash-on-Cash Return
5.0%
Cap rate
0.7%
Rent to Value Ratio
Active
$261,000
3
bds
|
2
ba
|
1,419
sqft
|
built
2023
14618 E 39th St S, Tulsa, OK 74134
$-353
Cash flow
-7.1%
Cash-on-Cash Return
4.1%
Cap rate
0.7%
Rent to Value Ratio
Active
$290,000
4
bds
|
3
ba
|
2,488
sqft
|
built
1978
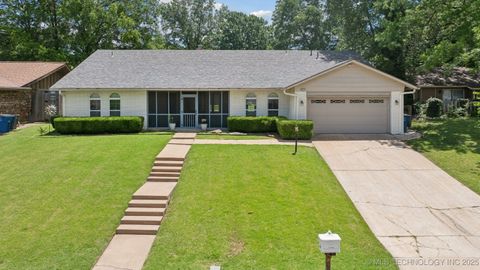
1101 S Chestnut Ave, Broken Arrow, OK 74012
$-347
Cash flow
-6.2%
Cash-on-Cash Return
4.2%
Cap rate
0.7%
Rent to Value Ratio
Active
$52,000
3
bds
|
1
ba
|
0
sqft
|
built
1930
524 S 8th St, Clinton, OK 73601
$520
Cash flow
11.7%
Cash-on-Cash Return
12.0%
Cap rate
1.5%
Rent to Value Ratio
Active
$189,000
2
bds
|
2
ba
|
1,193
sqft
|
built
1950
4903 E 25th St, Tulsa, OK 74114
$-99
Cash flow
-2.7%
Cash-on-Cash Return
5.0%
Cap rate
0.7%
Rent to Value Ratio
Active
$90,000
2
bds
|
2
ba
|
910
sqft
|
built
1970
6717 S Richmond Ave, Tulsa, OK 74136
$130
Cash flow
7.5%
Cash-on-Cash Return
7.4%
Cap rate
1.4%
Rent to Value Ratio
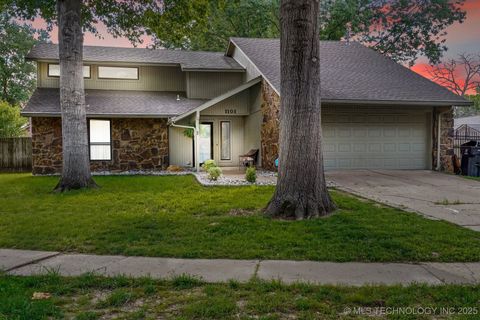
Active
$329,000
4
bds
|
3
ba
|
2,500
sqft
|
built
1997
8530 E 97th St, Tulsa, OK 74133
$-371
Cash flow
-5.9%
Cash-on-Cash Return
4.3%
Cap rate
0.7%
Rent to Value Ratio
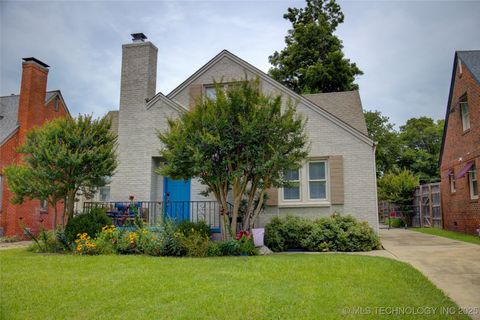
Active
$399,500
4
bds
|
2
ba
|
1,844
sqft
|
built
1930
2619 E 14th Pl, Tulsa, OK 74104
$-420
Cash flow
-5.5%
Cash-on-Cash Return
4.4%
Cap rate
0.7%
Rent to Value Ratio
Active
$135,000
4
bds
|
1
ba
|
881
sqft
|
built
1942
232 E Mohawk Blvd, Tulsa, OK 74106
$210
Cash flow
8.1%
Cash-on-Cash Return
7.5%
Cap rate
1.0%
Rent to Value Ratio
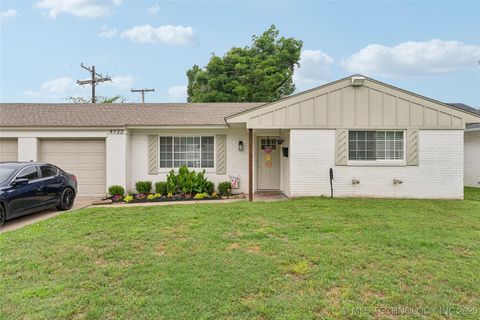
Active
$395,000
3
bds
|
2
ba
|
2,288
sqft
|
built
1960
4722 S Madison Ave, Tulsa, OK 74105
$-973
Cash flow
-12.9%
Cash-on-Cash Return
2.7%
Cap rate
0.4%
Rent to Value Ratio
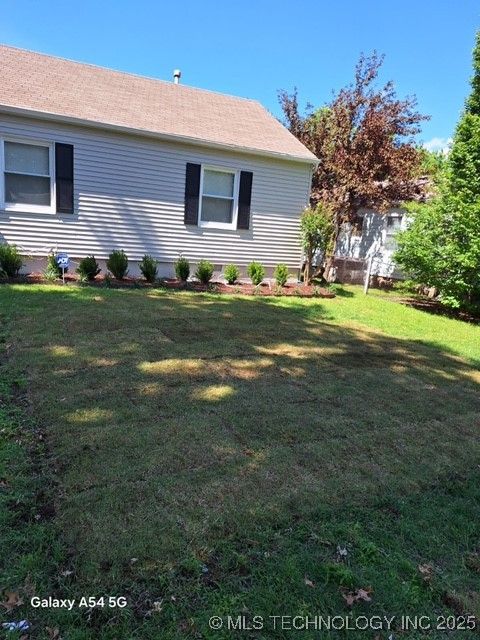
Active
$199,000
2
bds
|
1
ba
|
943
sqft
|
built
1941
3833 E 22nd St, Tulsa, OK 74114
$-91
Cash flow
-2.4%
Cash-on-Cash Return
5.1%
Cap rate
0.7%
Rent to Value Ratio
Active
$539,900
4
bds
|
3
ba
|
0
sqft
|
built
2020
8908 NW 130th St, Oklahoma City, OK 73142
$-999
Cash flow
-9.7%
Cash-on-Cash Return
3.5%
Cap rate
0.6%
Rent to Value Ratio
Active
$399,900
4
bds
|
3
ba
|
2,600
sqft
|
built
2007
16410 E 49th St, Tulsa, OK 74134
$-628
Cash flow
-8.2%
Cash-on-Cash Return
3.8%
Cap rate
0.6%
Rent to Value Ratio
Active
$259,900
3
bds
|
2
ba
|
1,666
sqft
|
built
1983
9237 S 91st East Ave, Tulsa, OK 74133
$-249
Cash flow
-5.0%
Cash-on-Cash Return
4.5%
Cap rate
0.7%
Rent to Value Ratio
Active
$395,000
3
bds
|
2
ba
|
2,288
sqft
|
built
1960
4707 S Madison Ave, Tulsa, OK 74105
$-973
Cash flow
-12.9%
Cash-on-Cash Return
2.7%
Cap rate
0.4%
Rent to Value Ratio
Active
$259,900
3
bds
|
2
ba
|
1,668
sqft
|
built
1982
3843 S 117th East Ave, Tulsa, OK 74146
$-301
Cash flow
-6.0%
Cash-on-Cash Return
4.3%
Cap rate
0.6%
Rent to Value Ratio
Active
$1,475,000
5
bds
|
7
ba
|
0
sqft
|
built
2006
11801 Old Mill Rd, Oklahoma City, OK 73131
$-5,456
Cash flow
-19.3%
Cash-on-Cash Return
1.2%
Cap rate
0.2%
Rent to Value Ratio
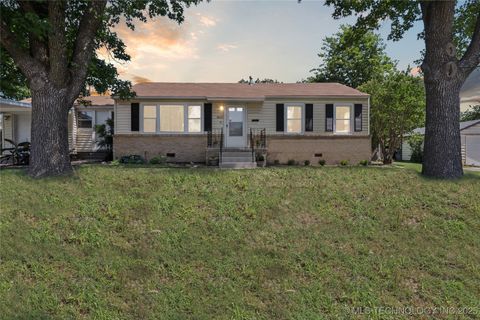
Active
$190,000
3
bds
|
2
ba
|
0
sqft
|
built
1964
516 SW 63rd Ter, Oklahoma City, OK 73139
$50
Cash flow
1.4%
Cash-on-Cash Return
6.0%
Cap rate
0.8%
Rent to Value Ratio
Active
$220,000
3
bds
|
1
ba
|
0
sqft
|
built
1931
2560 NW 23rd St, Oklahoma City, OK 73107
$-129
Cash flow
-3.1%
Cash-on-Cash Return
5.0%
Cap rate
0.7%
Rent to Value Ratio
Active
$230,000
3
bds
|
2
ba
|
1,338
sqft
|
built
1956
5350 E 27th Pl, Tulsa, OK 74114
$-258
Cash flow
-5.9%
Cash-on-Cash Return
4.3%
Cap rate
0.6%
Rent to Value Ratio

Active
$699,900
4
bds
|
4
ba
|
0
sqft
|
built
2023
3261 Red Ridge Dr, Blanchard, OK 73010
$-1,173
Cash flow
-8.7%
Cash-on-Cash Return
3.7%
Cap rate
0.4%
Rent to Value Ratio