Oklahoma Investment Properties for Sale
Browse homes for sale and investment properties in Oklahoma. Refine your search by price, property type, or more.
Best cash flowing properties in Oklahoma
Active
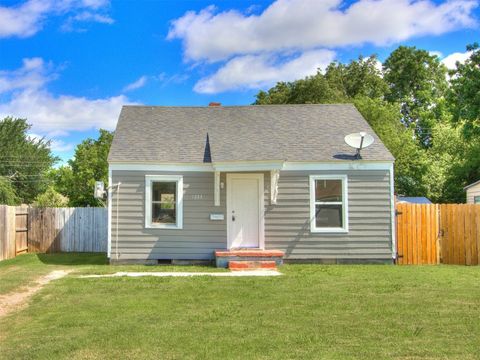
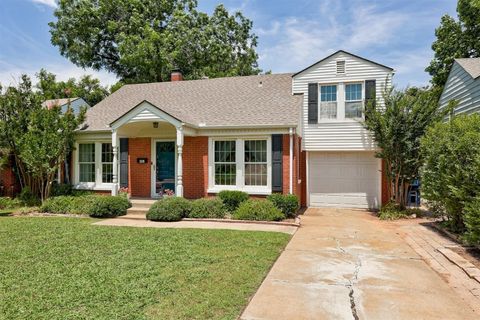
$125,000
2
bds
|
1
ba
|
0
sqft
|
built
1941
1233 SW 34th St, Oklahoma City, OK 73109
$241
Cash flow
10.1%
Cash-on-Cash Return
8.0%
Cap rate
1.0%
Rent to Value Ratio
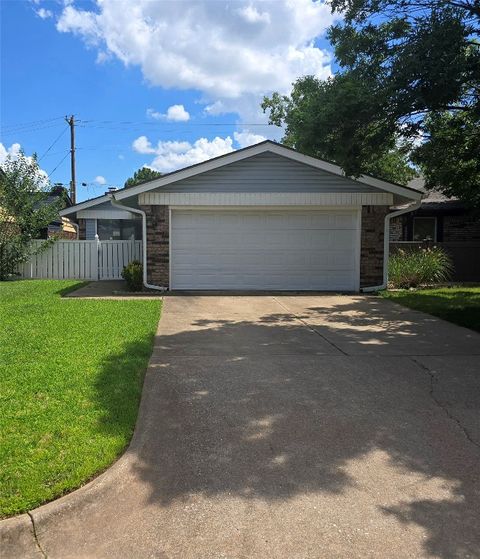
Active
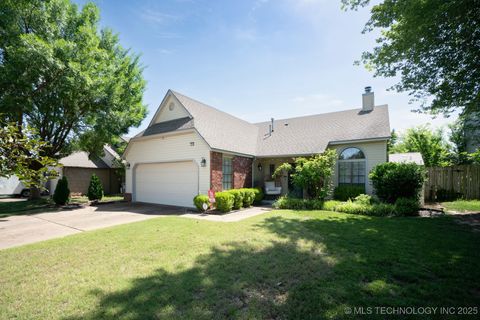
$155,000
2
bds
|
2
ba
|
0
sqft
|
built
1984
5904 Vixen Way, Oklahoma City, OK 73142
$223
Cash flow
7.5%
Cash-on-Cash Return
7.4%
Cap rate
1.0%
Rent to Value Ratio
6,463 out of 13,363 properties for sale in Oklahoma
Limited Results Shown
Create a free account, or log in to reveal all property listings and enjoy the complete experience.

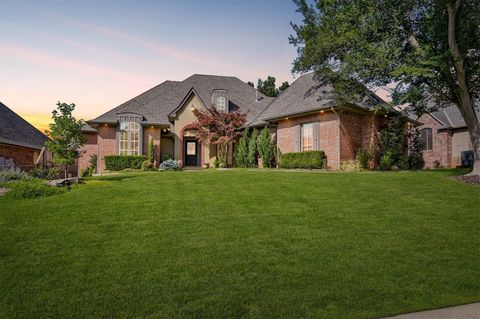
Active
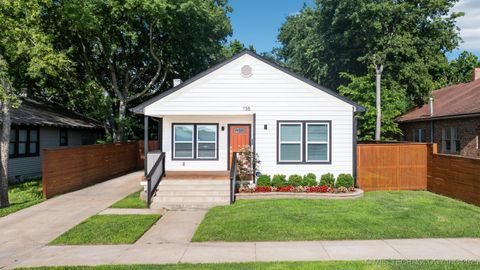
$500,000
4
bds
|
4
ba
|
0
sqft
|
built
2000
2600 SW 120th St, Oklahoma City, OK 73170
$-1,033
Cash flow
-10.8%
Cash-on-Cash Return
3.2%
Cap rate
0.5%
Rent to Value Ratio
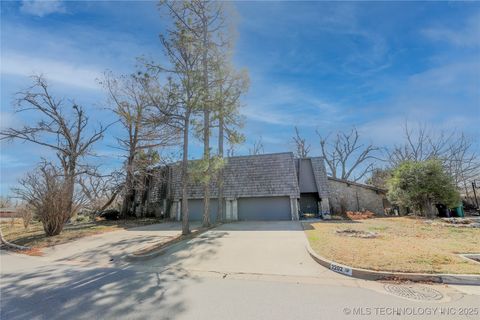
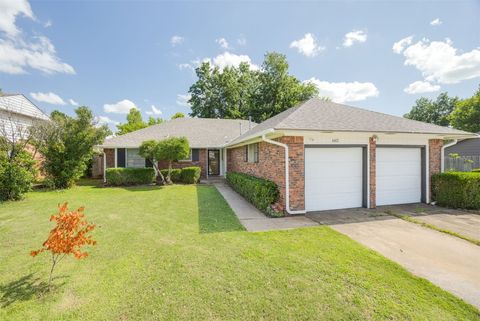
Active
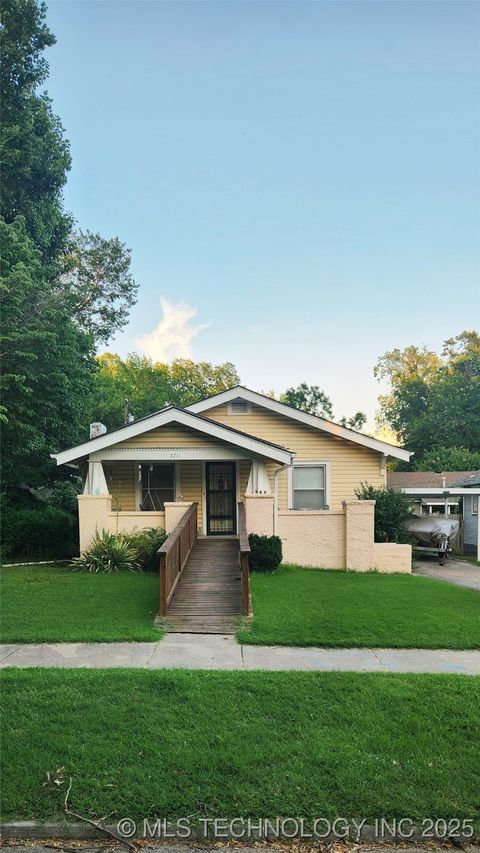
$579,000
3
bds
|
5
ba
|
4,755
sqft
|
built
1980
2202 NW 45th St, Oklahoma City, OK 73112
$-1,474
Cash flow
-13.3%
Cash-on-Cash Return
2.6%
Cap rate
0.4%
Rent to Value Ratio
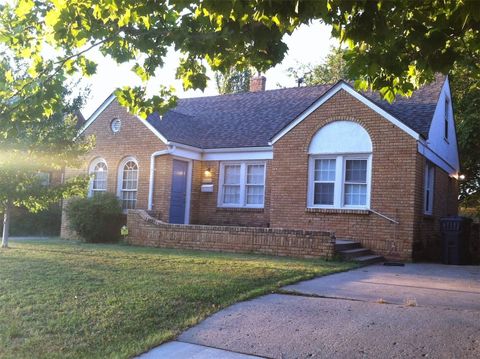
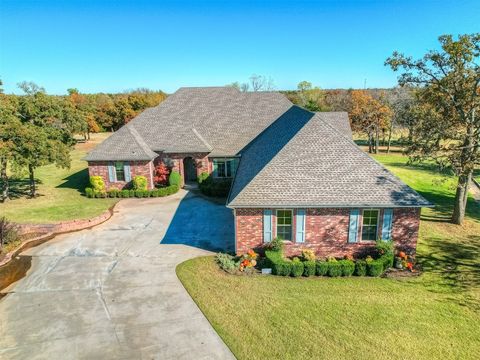
Active
$215,000
2
bds
|
1
ba
|
0
sqft
|
built
1929
2329 NW 22nd St, Oklahoma City, OK 73107
$-217
Cash flow
-5.3%
Cash-on-Cash Return
4.5%
Cap rate
0.6%
Rent to Value Ratio
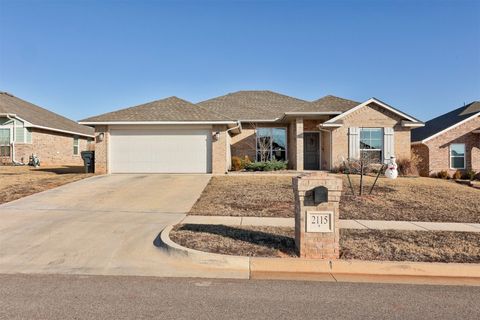
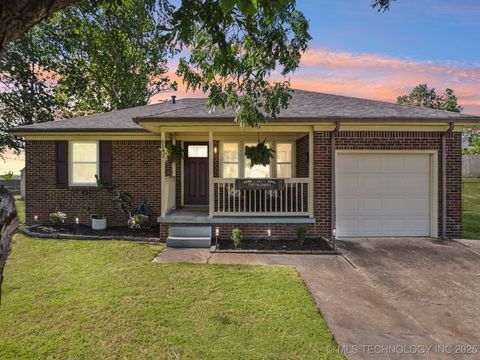
Active
$314,500
4
bds
|
2
ba
|
0
sqft
|
built
2022
2115 Arcady Ave, Norman, OK 73026
$-475
Cash flow
-7.9%
Cash-on-Cash Return
3.9%
Cap rate
0.6%
Rent to Value Ratio
Active
$295,000
3
bds
|
3
ba
|
0
sqft
|
built
1966
6704 Tall Oaks Dr, Oklahoma City, OK 73127
$-168
Cash flow
-3.0%
Cash-on-Cash Return
5.0%
Cap rate
0.7%
Rent to Value Ratio
Active
$399,900
4
bds
|
3
ba
|
0
sqft
|
built
2022
13513 NW 1st St, Yukon, OK 73099
$-746
Cash flow
-9.7%
Cash-on-Cash Return
3.4%
Cap rate
0.6%
Rent to Value Ratio
Active
$155,000
2
bds
|
2
ba
|
0
sqft
|
built
1984
5904 Vixen Way, Oklahoma City, OK 73142
$223
Cash flow
7.5%
Cash-on-Cash Return
7.4%
Cap rate
1.0%
Rent to Value Ratio
Active
$140,000
2
bds
|
2
ba
|
0
sqft
|
built
1982
4400 Hemingway Dr, Oklahoma City, OK 73118
$-188
Cash flow
-7.0%
Cash-on-Cash Return
4.1%
Cap rate
0.9%
Rent to Value Ratio
Active
$125,000
2
bds
|
1
ba
|
0
sqft
|
built
1941
1233 SW 34th St, Oklahoma City, OK 73109
$241
Cash flow
10.1%
Cash-on-Cash Return
8.0%
Cap rate
1.0%
Rent to Value Ratio
Active
$419,000
4
bds
|
3
ba
|
3,420
sqft
|
built
1985
7222 E 87th St, Tulsa, OK 74133
$-497
Cash flow
-6.2%
Cash-on-Cash Return
4.3%
Cap rate
0.7%
Rent to Value Ratio
Active
$244,500
3
bds
|
2
ba
|
1,734
sqft
|
built
1978
2110 S 70th St E, Muskogee, OK 74403
$-14
Cash flow
-0.3%
Cash-on-Cash Return
5.6%
Cap rate
0.7%
Rent to Value Ratio

Active
$369,995
4
bds
|
2
ba
|
0
sqft
|
built
2010
1646 County Road 1245, Tuttle, OK 73089
$-208
Cash flow
-2.9%
Cash-on-Cash Return
5.0%
Cap rate
0.8%
Rent to Value Ratio
Active
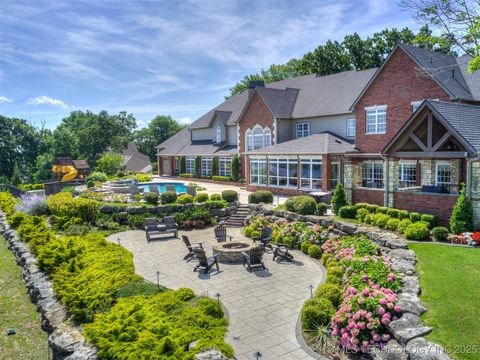
$799,999
5
bds
|
6
ba
|
5,949
sqft
|
built
1996
5501 E 108th St, Tulsa, OK 74137
$-2,228
Cash flow
-14.5%
Cash-on-Cash Return
2.3%
Cap rate
0.4%
Rent to Value Ratio
Active
$165,000
3
bds
|
1
ba
|
1,239
sqft
|
built
1940
409 N Cherokee Ave, Claremore, OK 74017
$5
Cash flow
0.2%
Cash-on-Cash Return
5.7%
Cap rate
0.7%
Rent to Value Ratio
Active
$1,995,000
5
bds
|
8
ba
|
10,777
sqft
|
built
2001
34159 E 698 Rd, Wagoner, OK 74467
$-7,407
Cash flow
-19.4%
Cash-on-Cash Return
1.2%
Cap rate
0.2%
Rent to Value Ratio
Active
$240,000
3
bds
|
2
ba
|
0
sqft
|
built
1981
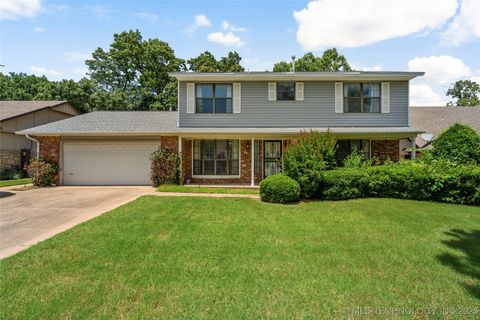
824 Waterview Rd, Oklahoma City, OK 73170
$-71
Cash flow
-1.5%
Cash-on-Cash Return
5.3%
Cap rate
0.8%
Rent to Value Ratio
Active
$150,000
2
bds
|
2
ba
|
0
sqft
|
built
1982
4400 Hemingway Dr, Oklahoma City, OK 73118
$-154
Cash flow
-5.4%
Cash-on-Cash Return
4.4%
Cap rate
0.9%
Rent to Value Ratio
Active
$550,000
3
bds
|
3
ba
|
0
sqft
|
built
1929
814 NE 18th St, Oklahoma City, OK 73105
$-1,502
Cash flow
-14.2%
Cash-on-Cash Return
2.4%
Cap rate
0.3%
Rent to Value Ratio
Active
$514,900
4
bds
|
5
ba
|
0
sqft
|
built
1995
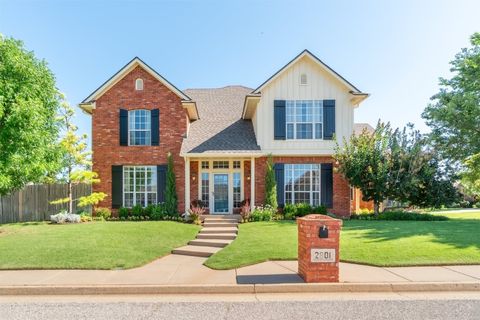
2801 NW 154th St, Edmond, OK 73013
$-868
Cash flow
-8.8%
Cash-on-Cash Return
3.7%
Cap rate
0.5%
Rent to Value Ratio
Active
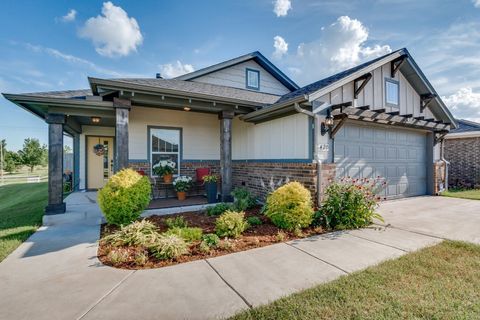
$319,900
3
bds
|
2
ba
|
0
sqft
|
built
2022
6420 SE 88th St, Oklahoma City, OK 73135
$-631
Cash flow
-10.3%
Cash-on-Cash Return
3.3%
Cap rate
0.6%
Rent to Value Ratio
Active
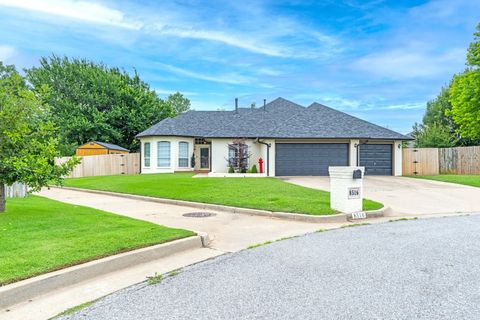
$275,000
3
bds
|
2
ba
|
0
sqft
|
built
1995
8516 NW 116th St, Oklahoma City, OK 73162
$-310
Cash flow
-5.9%
Cash-on-Cash Return
4.3%
Cap rate
0.7%
Rent to Value Ratio
Active
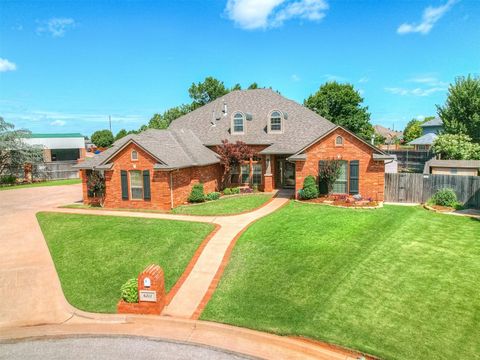
$544,900
5
bds
|
4
ba
|
0
sqft
|
built
1994
6717 NW 111th Ct, Oklahoma City, OK 73162
$-847
Cash flow
-8.1%
Cash-on-Cash Return
3.8%
Cap rate
0.6%
Rent to Value Ratio
Active
$305,000
2
bds
|
2
ba
|
0
sqft
|
built
1941
701 NW 46th St, Oklahoma City, OK 73118
$-386
Cash flow
-6.6%
Cash-on-Cash Return
4.2%
Cap rate
0.7%
Rent to Value Ratio
Active
$295,000
3
bds
|
2
ba
|
1,851
sqft
|
built
1987
9345 S 93rd East Ave, Tulsa, OK 74133
$-442
Cash flow
-7.8%
Cash-on-Cash Return
3.9%
Cap rate
0.6%
Rent to Value Ratio
Active
$350,000
3
bds
|
2
ba
|
1,728
sqft
|
built
1920
1135 S Lewis Pl, Tulsa, OK 74104
$-712
Cash flow
-10.6%
Cash-on-Cash Return
3.2%
Cap rate
0.5%
Rent to Value Ratio
Active
$350,000
3
bds
|
2
ba
|
2,209
sqft
|
built
1930
1711 S Saint Louis Ave, Tulsa, OK 74120
$-601
Cash flow
-9.0%
Cash-on-Cash Return
3.6%
Cap rate
0.5%
Rent to Value Ratio
Active
$295,000
4
bds
|
3
ba
|
2,479
sqft
|
built
1980
7033 E 99th St, Tulsa, OK 74133
$-416
Cash flow
-7.4%
Cash-on-Cash Return
4.0%
Cap rate
0.6%
Rent to Value Ratio
Active
$260,000
3
bds
|
2
ba
|
0
sqft
|
built
1939
2917 N Venice Blvd, Oklahoma City, OK 73107
$6
Cash flow
0.1%
Cash-on-Cash Return
5.7%
Cap rate
0.7%
Rent to Value Ratio
Active
$535,000
2
bds
|
3
ba
|
0
sqft
|
built
1982
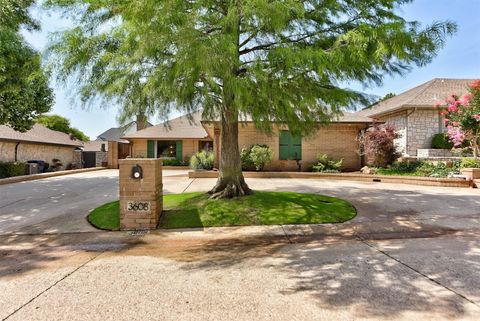
3608 Meadow Lark Ln, Oklahoma City, OK 73120
$-919
Cash flow
-9.0%
Cash-on-Cash Return
3.6%
Cap rate
0.6%
Rent to Value Ratio
Active
$750,000
4
bds
|
3
ba
|
0
sqft
|
built
1933
1001 NW 38th St, Oklahoma City, OK 73118
$-2,660
Cash flow
-18.5%
Cash-on-Cash Return
1.4%
Cap rate
0.3%
Rent to Value Ratio
Active
$175,000
3
bds
|
1
ba
|
925
sqft
|
built
1952
6240 E Latimer Pl, Tulsa, OK 74115
$11
Cash flow
0.3%
Cash-on-Cash Return
5.8%
Cap rate
0.7%
Rent to Value Ratio
Active
$249,900
3
bds
|
2
ba
|
1,391
sqft
|
built
2021
14864 E 37th Pl S, Tulsa, OK 74134
$-311
Cash flow
-6.5%
Cash-on-Cash Return
4.2%
Cap rate
0.6%
Rent to Value Ratio
Active
$242,000
4
bds
|
2
ba
|
1,539
sqft
|
built
1951
4262 E 24th Pl, Tulsa, OK 74114
$-302
Cash flow
-6.5%
Cash-on-Cash Return
4.2%
Cap rate
0.6%
Rent to Value Ratio
Active
$435,000
4
bds
|
3
ba
|
0
sqft
|
built
2017
2209 Marjoree Ln, Yukon, OK 73099
$-789
Cash flow
-9.5%
Cash-on-Cash Return
3.5%
Cap rate
0.6%
Rent to Value Ratio
Active
$699,500
4
bds
|
4
ba
|
0
sqft
|
built
2001
825 Crystal Creek Pl, Edmond, OK 73034
$-1,036
Cash flow
-7.7%
Cash-on-Cash Return
3.9%
Cap rate
0.6%
Rent to Value Ratio
Active
$208,000
2
bds
|
2
ba
|
0
sqft
|
built
1962
4412 NW 57th St, Oklahoma City, OK 73112
$-89
Cash flow
-2.2%
Cash-on-Cash Return
5.2%
Cap rate
0.8%
Rent to Value Ratio
Active
$589,000
4
bds
|
3
ba
|
0
sqft
|
built
2016
13450 Fairway Dr, Choctaw, OK 73020
$-814
Cash flow
-7.2%
Cash-on-Cash Return
4.0%
Cap rate
0.6%
Rent to Value Ratio
Active
$205,000
3
bds
|
1
ba
|
1,020
sqft
|
built
1955
6142 E 19th St, Tulsa, OK 74112
$-177
Cash flow
-4.5%
Cash-on-Cash Return
4.6%
Cap rate
0.7%
Rent to Value Ratio
Active
$289,000
3
bds
|
2
ba
|
1,458
sqft
|
built
1956
4019 E 37th St, Tulsa, OK 74135
$-407
Cash flow
-7.3%
Cash-on-Cash Return
4.0%
Cap rate
0.6%
Rent to Value Ratio
Active
$170,000
2
bds
|
1
ba
|
1,308
sqft
|
built
1930
3027 W Cameron St, Tulsa, OK 74127
$-93
Cash flow
-2.9%
Cash-on-Cash Return
5.0%
Cap rate
0.6%
Rent to Value Ratio