Oklahoma Investment Properties for Sale
Browse homes for sale and investment properties in Oklahoma. Refine your search by price, property type, or more.
Best cash flowing properties in Oklahoma
Active
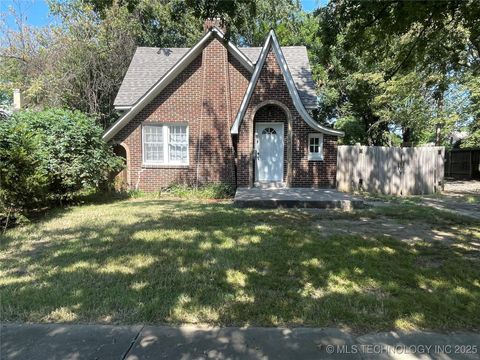
$85,000
1
bds
|
1
ba
|
1,070
sqft
|
built
1960
319 S 15th St, Muskogee, OK 74401
$309
Cash flow
19.0%
Cash-on-Cash Return
10.0%
Cap rate
1.3%
Rent to Value Ratio
Active
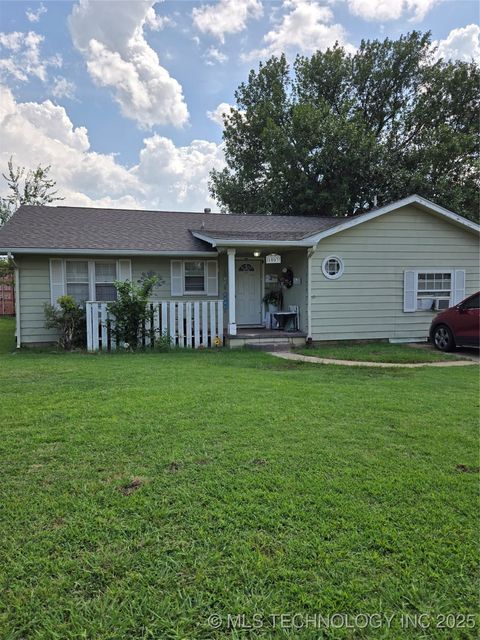
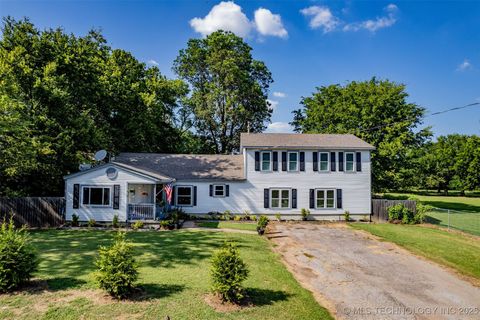
$124,000
4
bds
|
2
ba
|
1,384
sqft
|
built
1952
1003 E 4th St, Cushing, OK 74023
$249
Cash flow
10.5%
Cash-on-Cash Return
8.1%
Cap rate
1.0%
Rent to Value Ratio
2,018 out of 3,769 properties for sale in Oklahoma
Limited Results Shown
Create a free account, or log in to reveal all property listings and enjoy the complete experience.
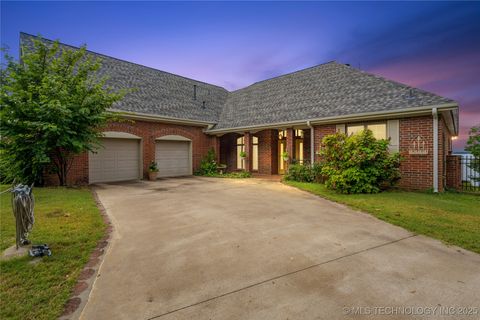
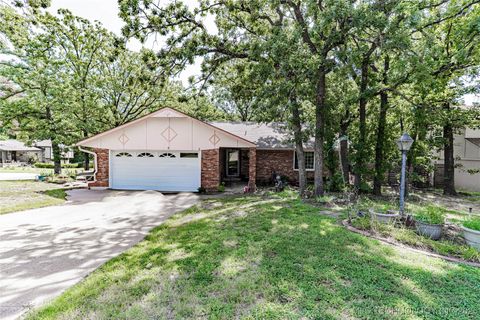
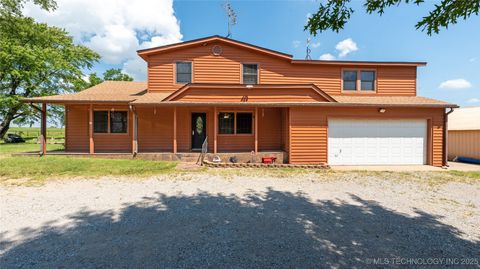
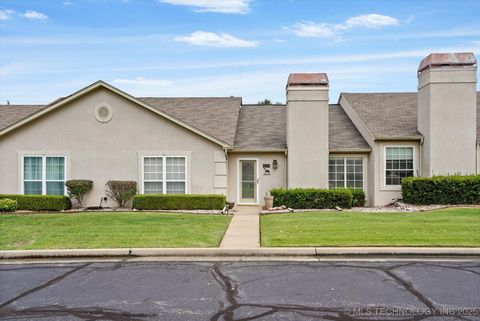
Active
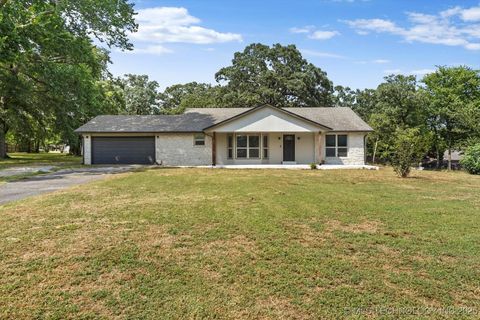
$285,000
2
bds
|
2
ba
|
1,762
sqft
|
built
1982
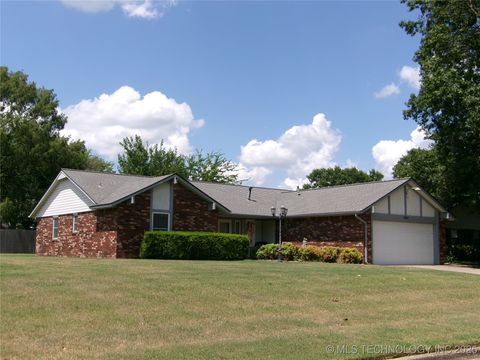
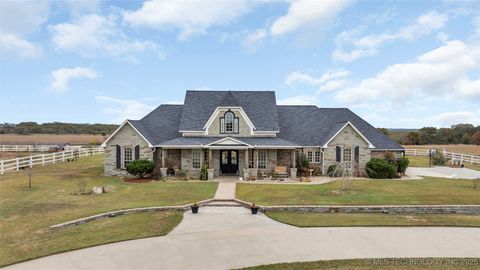
6255 E Canyon View Dr, Claremore, OK 74019
$-337
Cash flow
-6.2%
Cash-on-Cash Return
4.3%
Cap rate
0.6%
Rent to Value Ratio
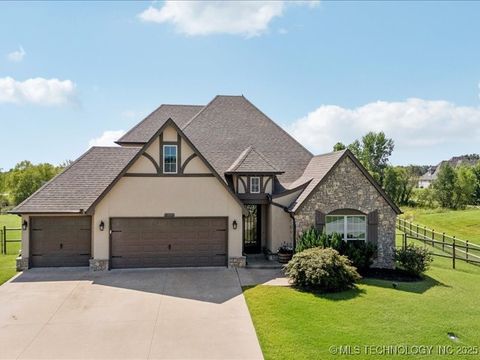
Active
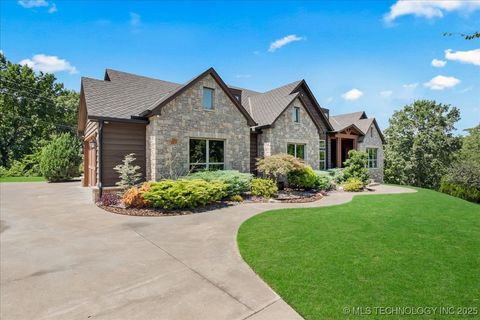
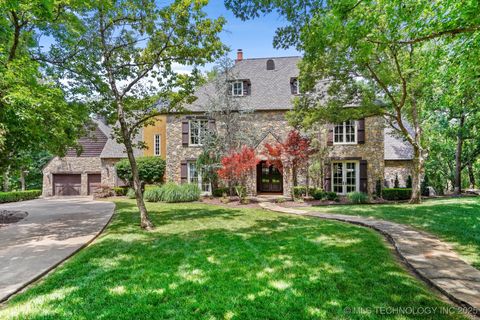
$925,000
3
bds
|
4
ba
|
4,101
sqft
|
built
2017
12636 S 13th Pl, Jenks, OK 74037
$-3,445
Cash flow
-19.4%
Cash-on-Cash Return
1.2%
Cap rate
0.3%
Rent to Value Ratio
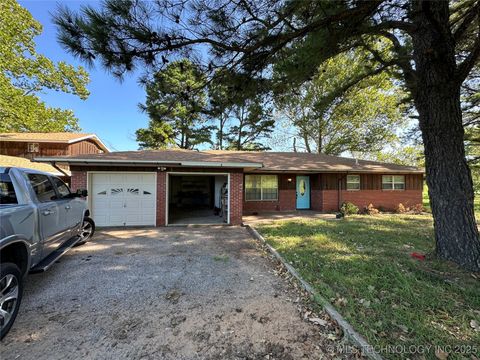
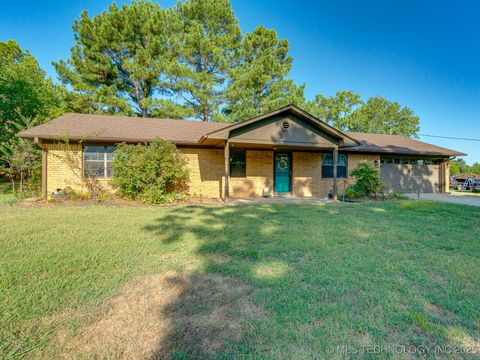
Active
$207,500
3
bds
|
2
ba
|
1,634
sqft
|
built
1982
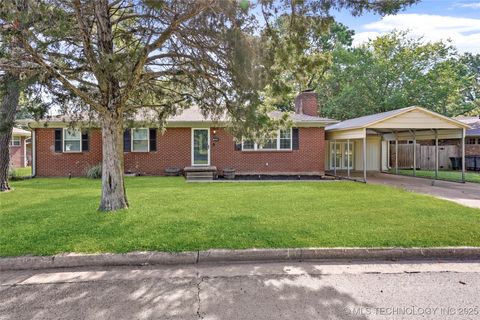
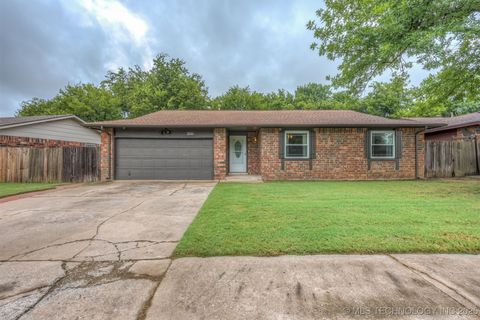
707 Foltz Ln, Muskogee, OK 74403
$17
Cash flow
0.4%
Cash-on-Cash Return
5.8%
Cap rate
0.8%
Rent to Value Ratio
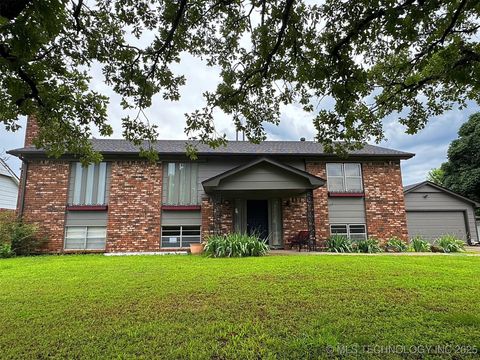
Active
$259,900
3
bds
|
2
ba
|
1,546
sqft
|
built
1956
1905 S Fulton Ave, Tulsa, OK 74112
$-185
Cash flow
-3.7%
Cash-on-Cash Return
4.8%
Cap rate
0.7%
Rent to Value Ratio
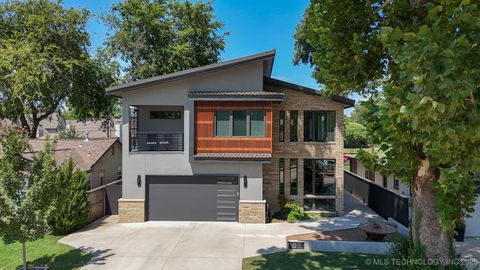
Active
$925,000
4
bds
|
5
ba
|
5,479
sqft
|
built
2014
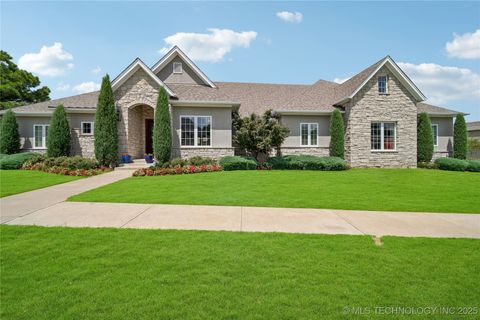
644 W 77th Pl, Tulsa, OK 74132
$-2,986
Cash flow
-16.8%
Cash-on-Cash Return
1.8%
Cap rate
0.3%
Rent to Value Ratio
Active
$575,000
3
bds
|
4
ba
|
3,402
sqft
|
built
1979
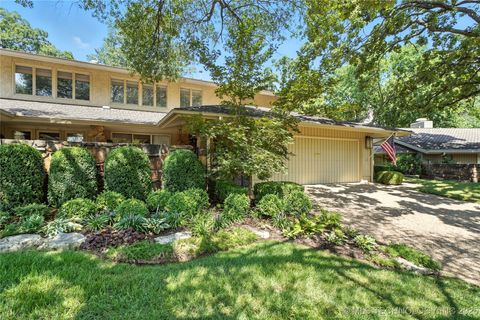
7240 S Gary Ave, Tulsa, OK 74136
$-1,749
Cash flow
-15.9%
Cash-on-Cash Return
2.0%
Cap rate
0.6%
Rent to Value Ratio
Active
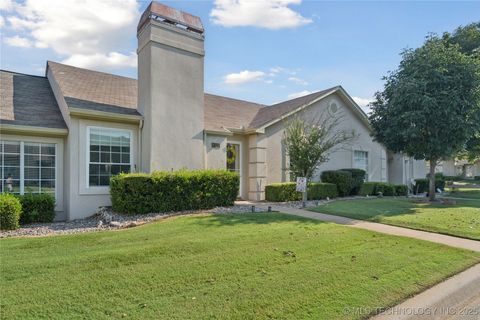
$239,900
3
bds
|
2
ba
|
1,488
sqft
|
built
2009
14812 S Fern Pl, Glenpool, OK 74033
$-283
Cash flow
-6.2%
Cash-on-Cash Return
4.3%
Cap rate
0.7%
Rent to Value Ratio
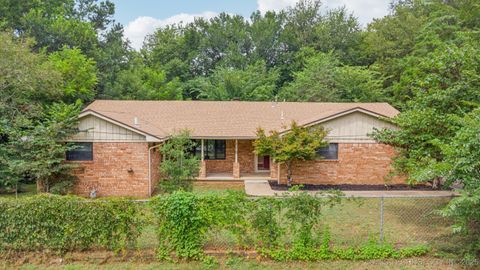
Active
$249,300
4
bds
|
2
ba
|
1,552
sqft
|
built
1963
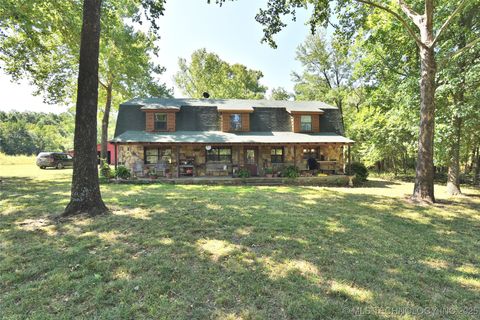
17995 S 4160 Rd, Claremore, OK 74017
$-184
Cash flow
-3.9%
Cash-on-Cash Return
4.8%
Cap rate
0.6%
Rent to Value Ratio
Active
$337,500
4
bds
|
2
ba
|
1,976
sqft
|
built
2012
2029 E 133rd Pl S, Bixby, OK 74008
$-369
Cash flow
-5.7%
Cash-on-Cash Return
4.4%
Cap rate
0.7%
Rent to Value Ratio
Active
$153,000
3
bds
|
2
ba
|
1,233
sqft
|
built
1976
6102 N Wheeling Ave, Tulsa, OK 74130
$-20
Cash flow
-0.7%
Cash-on-Cash Return
5.5%
Cap rate
0.8%
Rent to Value Ratio
Active
$850,000
4
bds
|
5
ba
|
5,110
sqft
|
built
2001
10144 N Dover Pl, Owasso, OK 74055
$-1,309
Cash flow
-8.0%
Cash-on-Cash Return
3.8%
Cap rate
0.6%
Rent to Value Ratio
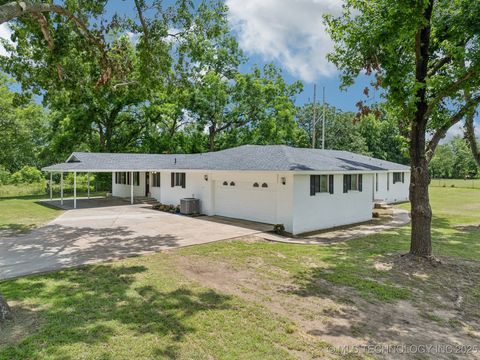
Active
$400,000
5
bds
|
3
ba
|
3,137
sqft
|
built
1950
508 NW 10th St, Wagoner, OK 74467
$-533
Cash flow
-7.0%
Cash-on-Cash Return
4.1%
Cap rate
0.6%
Rent to Value Ratio
Active
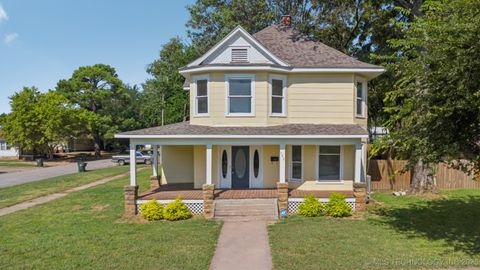
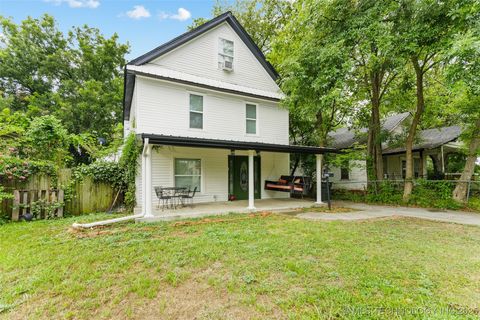
$192,500
4
bds
|
2
ba
|
1,949
sqft
|
built
1920
322 S Porter Ave, Okmulgee, OK 74447
$173
Cash flow
4.7%
Cash-on-Cash Return
6.8%
Cap rate
0.9%
Rent to Value Ratio
Active
$489,000
7
bds
|
5
ba
|
3,889
sqft
|
built
1998
508 Covington Pl, Tahlequah, OK 74464
$-1,060
Cash flow
-11.3%
Cash-on-Cash Return
3.1%
Cap rate
0.5%
Rent to Value Ratio
Active
$735,000
4
bds
|
4
ba
|
3,546
sqft
|
built
2010
4598 Kings Rd, Ardmore, OK 73401
$-1,628
Cash flow
-11.6%
Cash-on-Cash Return
3.0%
Cap rate
0.5%
Rent to Value Ratio
Active
$660,000
3
bds
|
2
ba
|
2,660
sqft
|
built
2003
20048 S Pistol Point Rd, Hulbert, OK 74441
$-1,429
Cash flow
-11.3%
Cash-on-Cash Return
3.1%
Cap rate
0.4%
Rent to Value Ratio
Active
$550,000
5
bds
|
2
ba
|
2,800
sqft
|
built
1988
1884 County Road 5535, Ralston, OK 74650
$-1,194
Cash flow
-11.3%
Cash-on-Cash Return
3.1%
Cap rate
0.4%
Rent to Value Ratio
Active
$319,900
5
bds
|
3
ba
|
3,242
sqft
|
built
1969
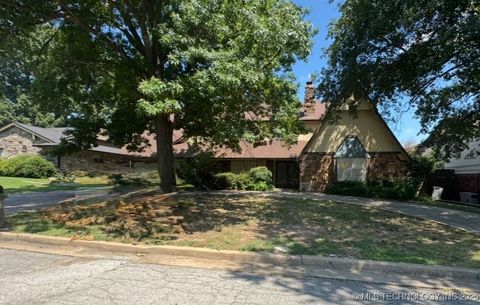
7603 E 66th St, Tulsa, OK 74133
$-303
Cash flow
-4.9%
Cash-on-Cash Return
4.5%
Cap rate
0.7%
Rent to Value Ratio
Active
$514,900
4
bds
|
3
ba
|
2,794
sqft
|
built
2014
2068 E 174th Pl S, Mounds, OK 74047
$-611
Cash flow
-6.2%
Cash-on-Cash Return
4.3%
Cap rate
0.6%
Rent to Value Ratio
Active
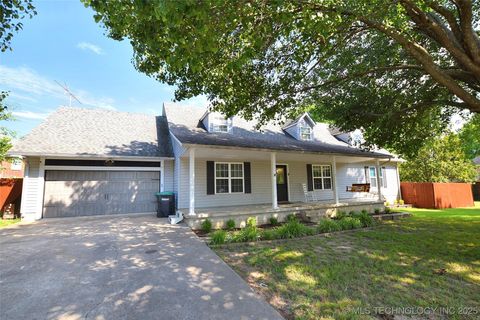
$225,000
3
bds
|
2
ba
|
1,652
sqft
|
built
1973
1103 S Division St, Sapulpa, OK 74066
$39
Cash flow
0.9%
Cash-on-Cash Return
5.9%
Cap rate
0.7%
Rent to Value Ratio
Active
$1,150,000
4
bds
|
4
ba
|
4,061
sqft
|
built
2019
1433 E 38th St, Tulsa, OK 74105
$-4,161
Cash flow
-18.9%
Cash-on-Cash Return
1.3%
Cap rate
0.3%
Rent to Value Ratio
Active
$360,000
3
bds
|
2
ba
|
1,354
sqft
|
built
1966
1615 W 4th St, Okmulgee, OK 74447
$-688
Cash flow
-10.0%
Cash-on-Cash Return
3.4%
Cap rate
0.4%
Rent to Value Ratio
Active
$699,000
5
bds
|
4
ba
|
4,104
sqft
|
built
1985
23611 E 300 Rd, Chelsea, OK 74016
$-786
Cash flow
-5.9%
Cash-on-Cash Return
4.3%
Cap rate
0.6%
Rent to Value Ratio
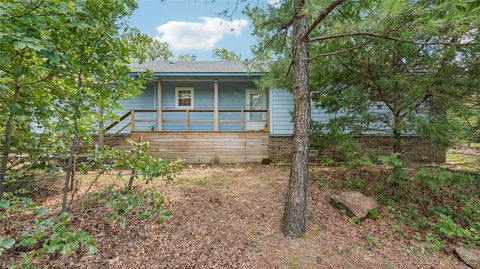
Active
$229,000
3
bds
|
2
ba
|
1,250
sqft
|
built
1985
9581 County Road 3590, Ada, OK 74820
$-184
Cash flow
-4.2%
Cash-on-Cash Return
4.7%
Cap rate
0.6%
Rent to Value Ratio
Active
$399,000
4
bds
|
3
ba
|
3,328
sqft
|
built
1969
618 Oak Ridge Dr, Sand Springs, OK 74063
$-456
Cash flow
-6.0%
Cash-on-Cash Return
4.3%
Cap rate
0.6%
Rent to Value Ratio
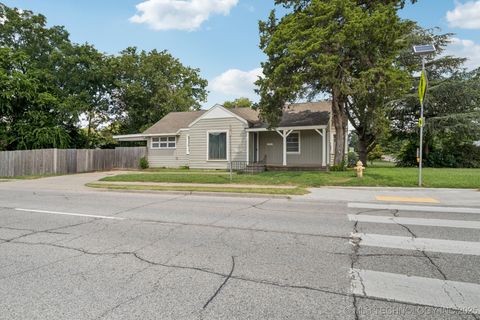
Active
$195,000
2
bds
|
1
ba
|
1,316
sqft
|
built
1941
4119 E 15th St, Tulsa, OK 74112
$-67
Cash flow
-1.8%
Cash-on-Cash Return
5.3%
Cap rate
0.7%
Rent to Value Ratio
Active
$250,000
3
bds
|
2
ba
|
2,051
sqft
|
built
1960
110 N 70th West Ave, Tulsa, OK 74127
$-162
Cash flow
-3.4%
Cash-on-Cash Return
4.9%
Cap rate
0.7%
Rent to Value Ratio
Active
$275,400
2
bds
|
2
ba
|
1,530
sqft
|
built
1997
8323 E 81st Pl, Tulsa, OK 74133
$-584
Cash flow
-11.1%
Cash-on-Cash Return
3.1%
Cap rate
0.6%
Rent to Value Ratio
Active
$235,000
3
bds
|
2
ba
|
1,219
sqft
|
built
2004
857 Bayshore Dr, Sand Springs, OK 74063
$-345
Cash flow
-7.7%
Cash-on-Cash Return
3.9%
Cap rate
0.6%
Rent to Value Ratio
Active
$324,000
3
bds
|
3
ba
|
2,396
sqft
|
built
1974
10541 Sahoma Lake Rd, Sapulpa, OK 74066
$-376
Cash flow
-6.1%
Cash-on-Cash Return
4.3%
Cap rate
0.6%
Rent to Value Ratio
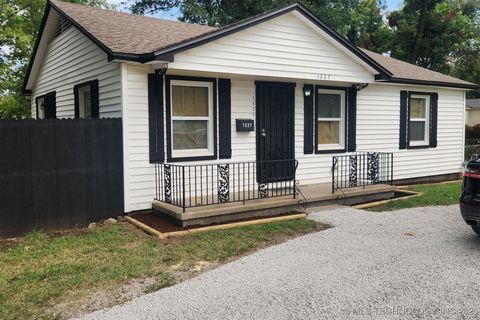
Active
$164,900
2
bds
|
1
ba
|
1,105
sqft
|
built
1952
1227 S 75th East Ave, Tulsa, OK 74112
$-180
Cash flow
-5.7%
Cash-on-Cash Return
4.4%
Cap rate
0.6%
Rent to Value Ratio
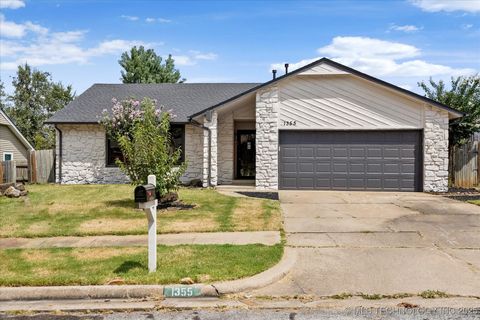
Active
$229,900
3
bds
|
2
ba
|
1,358
sqft
|
built
1985
1355 E 138th Pl, Glenpool, OK 74033
$-130
Cash flow
-3.0%
Cash-on-Cash Return
5.0%
Cap rate
0.7%
Rent to Value Ratio
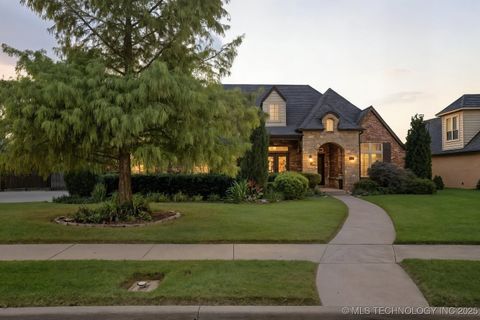
Active
$624,900
4
bds
|
3
ba
|
3,349
sqft
|
built
2013
218 E 128th St S, Jenks, OK 74037
$-1,329
Cash flow
-11.1%
Cash-on-Cash Return
3.1%
Cap rate
0.5%
Rent to Value Ratio
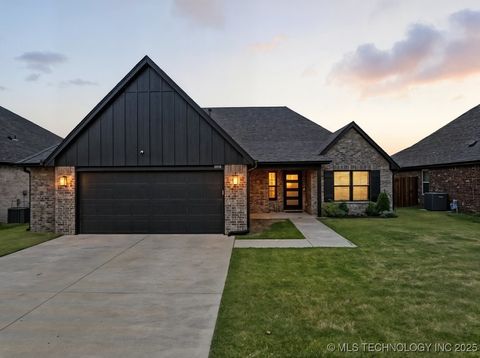
Active
$350,000
4
bds
|
2
ba
|
2,159
sqft
|
built
2022
10106 S 228th East Ave, Broken Arrow, OK 74014
$-499
Cash flow
-7.4%
Cash-on-Cash Return
4.0%
Cap rate
0.6%
Rent to Value Ratio
Active
$240,000
3
bds
|
2
ba
|
1,477
sqft
|
built
1978
2016 W Delmar St, Broken Arrow, OK 74012
$-197
Cash flow
-4.3%
Cash-on-Cash Return
4.7%
Cap rate
0.7%
Rent to Value Ratio
Active
$275,000
2
bds
|
2
ba
|
1,391
sqft
|
built
1997
8327 E 81st Pl, Tulsa, OK 74133
$-520
Cash flow
-9.9%
Cash-on-Cash Return
3.4%
Cap rate
0.6%
Rent to Value Ratio
Active
$223,000
4
bds
|
4
ba
|
2,406
sqft
|
built
1910
406 E 2nd St, Skiatook, OK 74070
$-142
Cash flow
-3.3%
Cash-on-Cash Return
4.9%
Cap rate
0.7%
Rent to Value Ratio

Active
$427,500
3
bds
|
3
ba
|
2,392
sqft
|
built
2021
2334 W Maple St, Collinsville, OK 74021
$-906
Cash flow
-11.1%
Cash-on-Cash Return
3.1%
Cap rate
0.5%
Rent to Value Ratio