Oklahoma Investment Properties for Sale
Browse homes for sale and investment properties in Oklahoma. Refine your search by price, property type, or more.
Best cash flowing properties in Oklahoma
Active
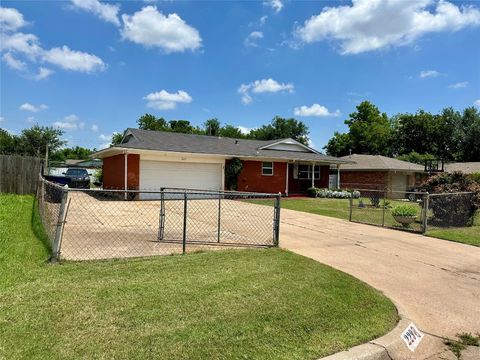
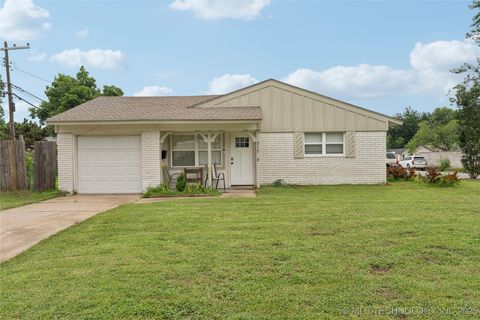
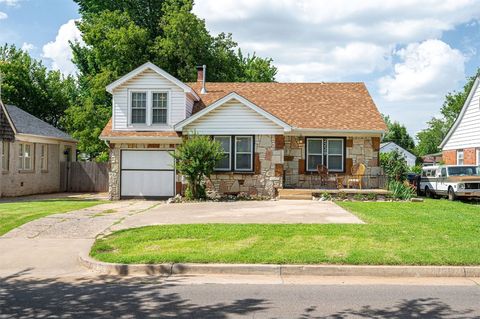
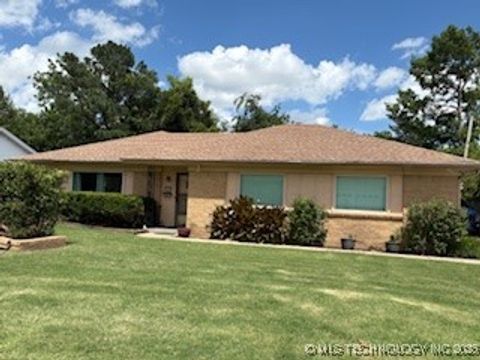
$125,000
3
bds
|
2
ba
|
0
sqft
|
built
1965
229 NW 79th St, Oklahoma City, OK 73114
$322
Cash flow
13.4%
Cash-on-Cash Return
8.8%
Cap rate
1.1%
Rent to Value Ratio
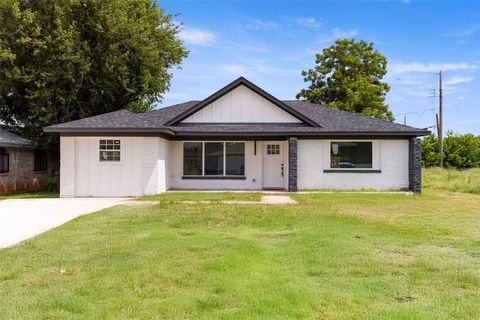
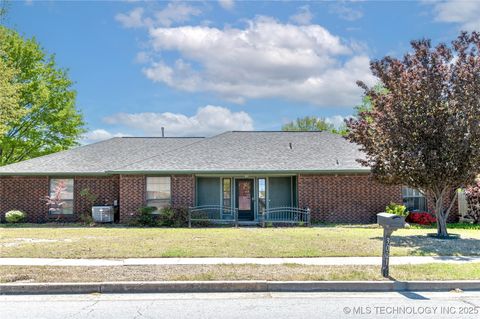
Active
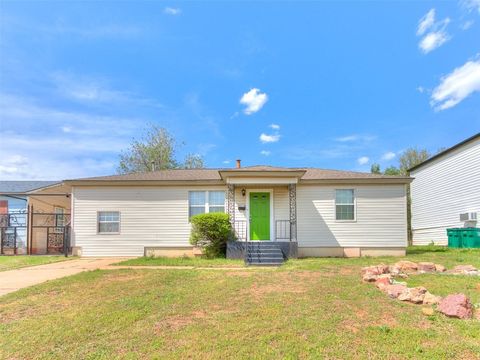
$110,000
2
bds
|
1
ba
|
0
sqft
|
built
1953
3109 NE 15th St, Oklahoma City, OK 73117
$273
Cash flow
12.9%
Cash-on-Cash Return
8.7%
Cap rate
1.1%
Rent to Value Ratio
6,463 out of 13,363 properties for sale in Oklahoma
Limited Results Shown
Create a free account, or log in to reveal all property listings and enjoy the complete experience.
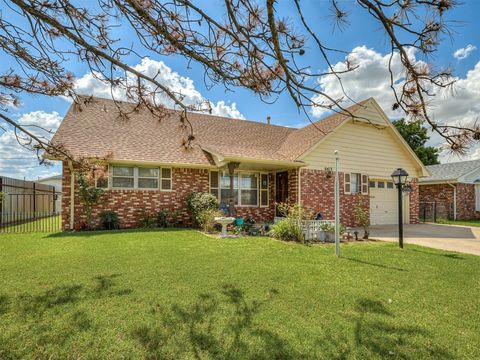
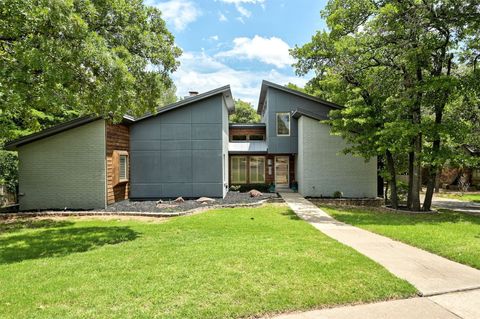
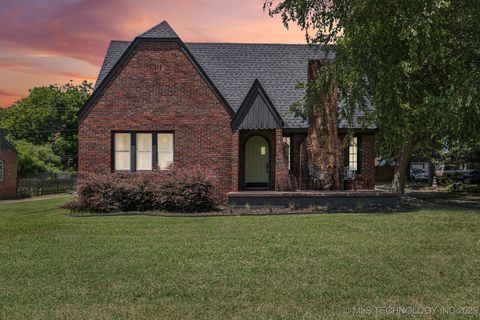
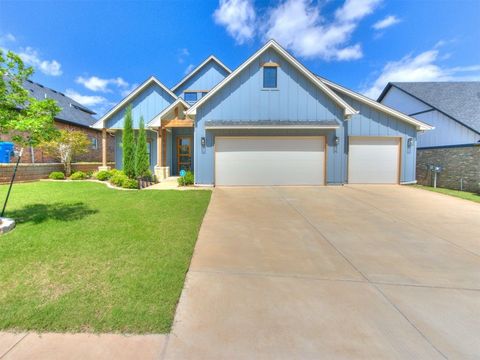
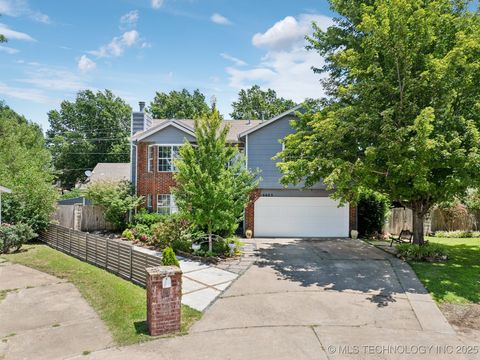
Active
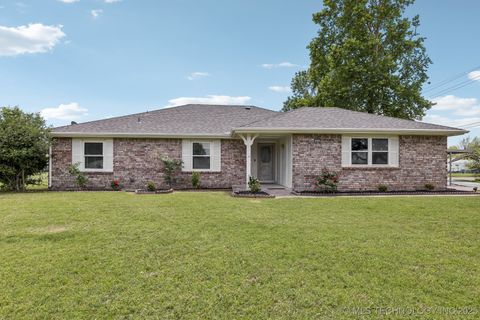
$335,900
3
bds
|
2
ba
|
1,586
sqft
|
built
1979
14506 E 76th St N, Owasso, OK 74055
$-520
Cash flow
-8.1%
Cash-on-Cash Return
3.8%
Cap rate
0.5%
Rent to Value Ratio
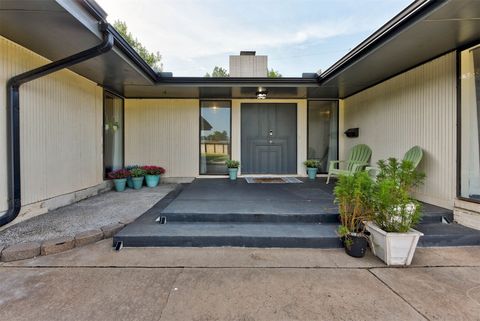
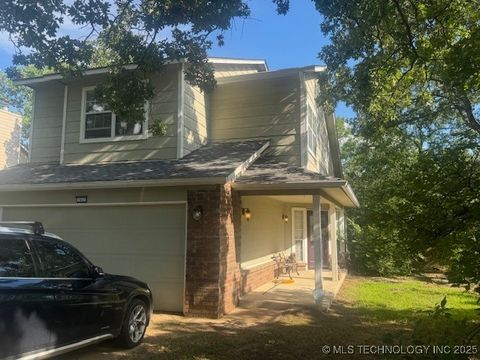
Active
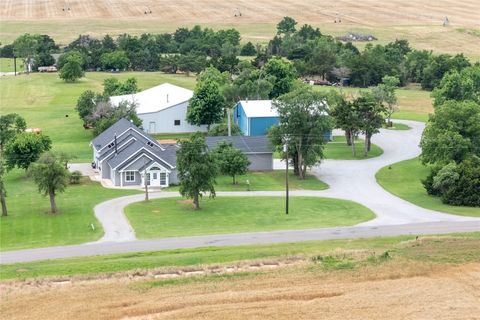
$500,000
3
bds
|
3
ba
|
0
sqft
|
built
1930
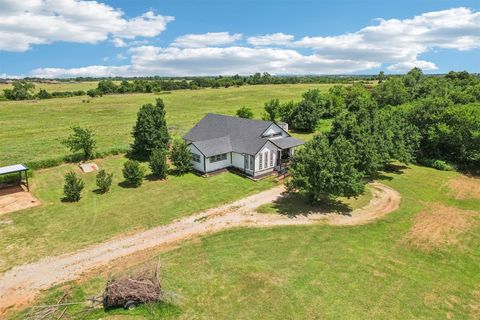
24484 E 990 Rd, Weatherford, OK 73096
$-1,201
Cash flow
-12.5%
Cash-on-Cash Return
2.8%
Cap rate
0.4%
Rent to Value Ratio
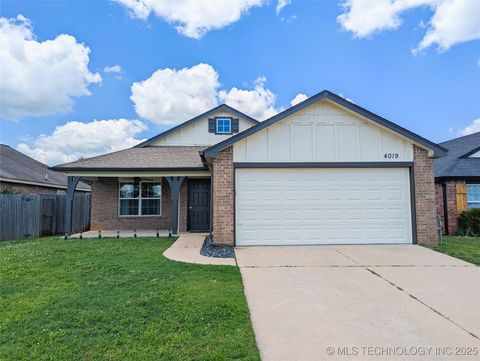
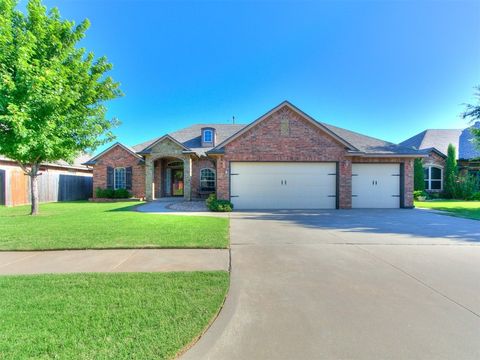
Active
$265,000
3
bds
|
2
ba
|
1,393
sqft
|
built
2009
4019 W 103rd Ct S, Jenks, OK 74037
$-473
Cash flow
-9.3%
Cash-on-Cash Return
3.5%
Cap rate
0.6%
Rent to Value Ratio

Active
$699,900
4
bds
|
4
ba
|
0
sqft
|
built
2023
3261 Red Ridge Dr, Blanchard, OK 73010
$-1,173
Cash flow
-8.7%
Cash-on-Cash Return
3.7%
Cap rate
0.4%
Rent to Value Ratio
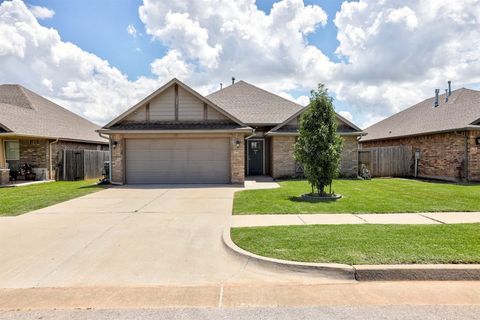
Active
$249,900
3
bds
|
2
ba
|
0
sqft
|
built
2018
4004 Brougham Way, Oklahoma City, OK 73179
$-222
Cash flow
-4.6%
Cash-on-Cash Return
4.6%
Cap rate
0.7%
Rent to Value Ratio
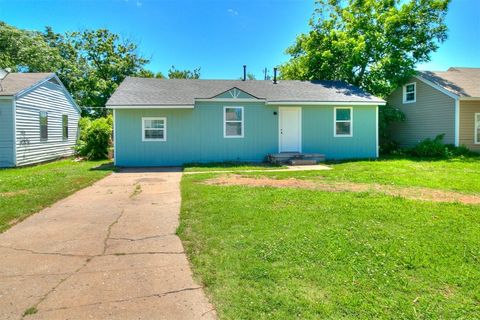
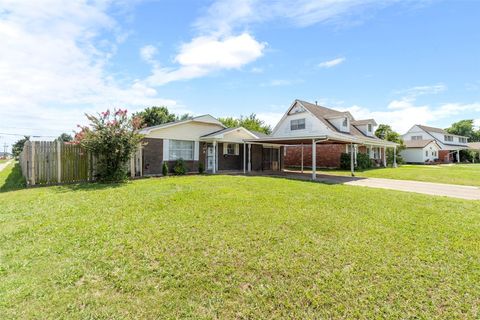
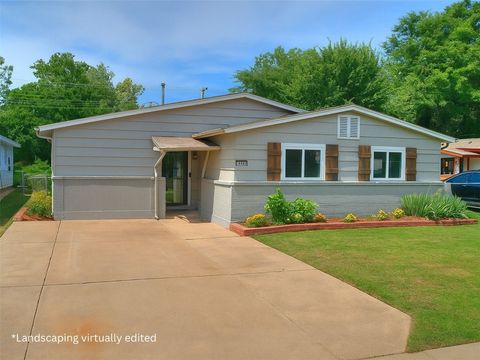
Active
$137,500
3
bds
|
1
ba
|
0
sqft
|
built
1948
3320 S Woodward Ave, Oklahoma City, OK 73119
$-76
Cash flow
-2.9%
Cash-on-Cash Return
5.0%
Cap rate
0.7%
Rent to Value Ratio
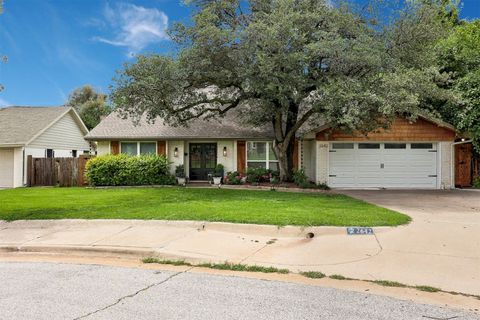
Active
$435,250
3
bds
|
2
ba
|
0
sqft
|
built
1954
2642 NW 42nd St, Oklahoma City, OK 73112
$-306
Cash flow
-3.7%
Cash-on-Cash Return
4.8%
Cap rate
0.6%
Rent to Value Ratio
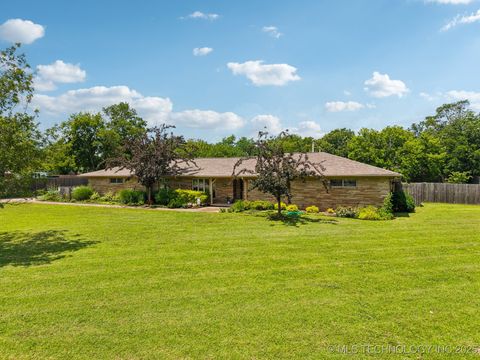
Active
$230,000
5
bds
|
3
ba
|
0
sqft
|
built
1961
6413 S Mc Kinley Ave, Oklahoma City, OK 73139
$75
Cash flow
1.7%
Cash-on-Cash Return
6.1%
Cap rate
0.8%
Rent to Value Ratio
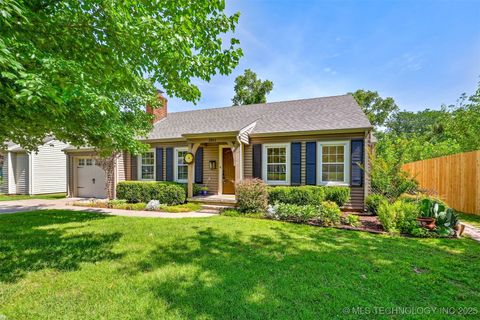
Active
$497,000
3
bds
|
2
ba
|
2,246
sqft
|
built
1938
2811 E 22nd St, Tulsa, OK 74114
$-991
Cash flow
-10.4%
Cash-on-Cash Return
3.3%
Cap rate
0.5%
Rent to Value Ratio
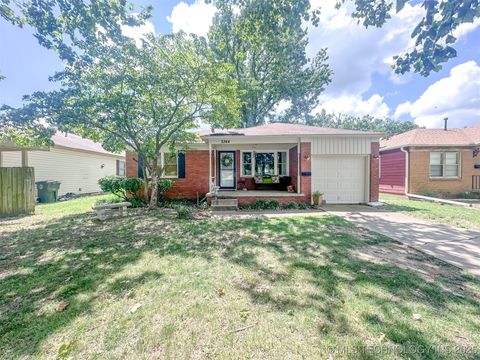
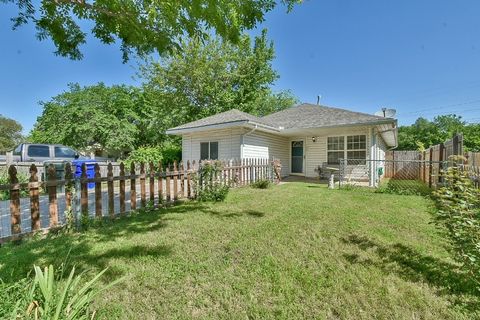
Active
$125,000
3
bds
|
1
ba
|
1,002
sqft
|
built
1950
3744 S Louisville Ave, Tulsa, OK 74135
$253
Cash flow
10.6%
Cash-on-Cash Return
8.1%
Cap rate
1.1%
Rent to Value Ratio
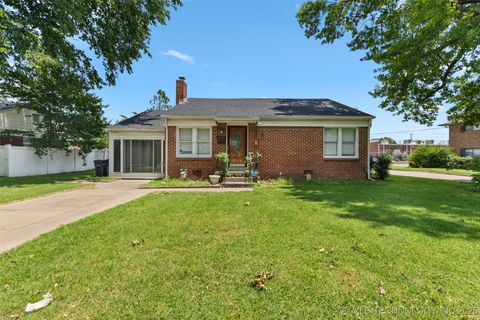
Active
$285,000
2
bds
|
2
ba
|
1,787
sqft
|
built
1945
4247 S Owasso Ave, Tulsa, OK 74105
$-497
Cash flow
-9.1%
Cash-on-Cash Return
3.6%
Cap rate
0.6%
Rent to Value Ratio
Active
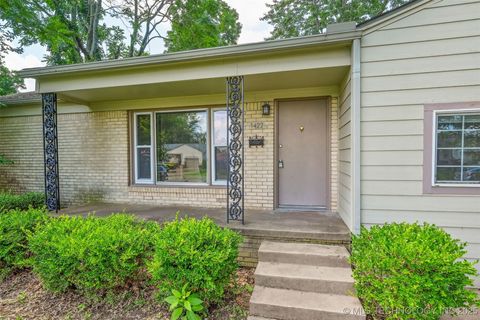
$161,900
3
bds
|
1
ba
|
980
sqft
|
built
1951
1422 E 52nd St, Tulsa, OK 74105
$-60
Cash flow
-1.9%
Cash-on-Cash Return
5.2%
Cap rate
0.7%
Rent to Value Ratio
Active
$249,900
3
bds
|
2
ba
|
0
sqft
|
built
1993
817 Glenwood Dr, Moore, OK 73160
$-146
Cash flow
-3.0%
Cash-on-Cash Return
5.0%
Cap rate
0.7%
Rent to Value Ratio
Active
$465,000
4
bds
|
3
ba
|
0
sqft
|
built
1988
402 Hunters Ct, Edmond, OK 73034
$-1,003
Cash flow
-11.3%
Cash-on-Cash Return
3.1%
Cap rate
0.5%
Rent to Value Ratio
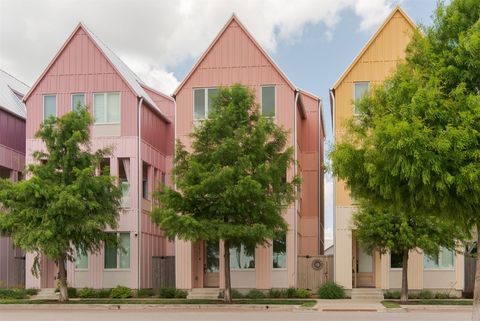
Active
$475,000
3
bds
|
4
ba
|
0
sqft
|
built
2022
222 Alamosa Rd, Norman, OK 73069
$-879
Cash flow
-9.7%
Cash-on-Cash Return
3.5%
Cap rate
0.6%
Rent to Value Ratio
Active
$550,000
4
bds
|
3
ba
|
0
sqft
|
built
1975
1810 Sandpiper Dr, Edmond, OK 73034
$-822
Cash flow
-7.8%
Cash-on-Cash Return
3.9%
Cap rate
0.6%
Rent to Value Ratio
Active
$125,000
3
bds
|
2
ba
|
0
sqft
|
built
1965
229 NW 79th St, Oklahoma City, OK 73114
$322
Cash flow
13.4%
Cash-on-Cash Return
8.8%
Cap rate
1.1%
Rent to Value Ratio
Active
$323,000
3
bds
|
3
ba
|
0
sqft
|
built
1964
6708 Pendell Dr, Oklahoma City, OK 73116
$-313
Cash flow
-5.1%
Cash-on-Cash Return
4.5%
Cap rate
0.7%
Rent to Value Ratio
Active
$189,900
3
bds
|
2
ba
|
0
sqft
|
built
1964
2900 SW 61st St, Oklahoma City, OK 73159
$-55
Cash flow
-1.5%
Cash-on-Cash Return
5.3%
Cap rate
0.7%
Rent to Value Ratio
Active
$426,500
4
bds
|
3
ba
|
2,751
sqft
|
built
1962
8969 E 16th St, Tulsa, OK 74112
$-775
Cash flow
-9.5%
Cash-on-Cash Return
3.5%
Cap rate
0.5%
Rent to Value Ratio
Active
$395,000
3
bds
|
2
ba
|
2,314
sqft
|
built
1960
313 E 48th St, Tulsa, OK 74105
$-697
Cash flow
-9.2%
Cash-on-Cash Return
3.6%
Cap rate
0.5%
Rent to Value Ratio
Active
$275,000
4
bds
|
2
ba
|
0
sqft
|
built
1955
46 E 14th St, Edmond, OK 73034
$-151
Cash flow
-2.9%
Cash-on-Cash Return
5.0%
Cap rate
0.7%
Rent to Value Ratio
Active
$175,000
2
bds
|
1
ba
|
0
sqft
|
built
1952
1436 NW 97th St, Oklahoma City, OK 73114
$-83
Cash flow
-2.5%
Cash-on-Cash Return
5.1%
Cap rate
0.7%
Rent to Value Ratio
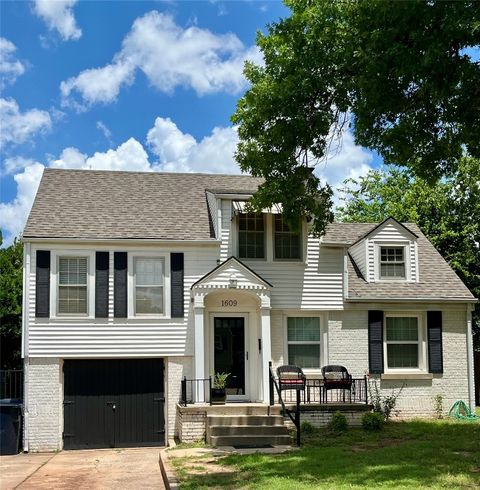
Active
$259,000
3
bds
|
2
ba
|
0
sqft
|
built
1938
1609 NW 43rd St, Oklahoma City, OK 73118
$-122
Cash flow
-2.5%
Cash-on-Cash Return
5.1%
Cap rate
0.8%
Rent to Value Ratio
Active
$410,000
5
bds
|
4
ba
|
0
sqft
|
built
2002
1600 Silver Stone Rd, Blanchard, OK 73010
$-132
Cash flow
-1.7%
Cash-on-Cash Return
5.3%
Cap rate
0.7%
Rent to Value Ratio
Active
$174,950
2
bds
|
1
ba
|
0
sqft
|
built
1958
1601 Dakota St, Norman, OK 73069
$192
Cash flow
5.7%
Cash-on-Cash Return
7.0%
Cap rate
0.9%
Rent to Value Ratio
Active
$535,000
3
bds
|
3
ba
|
0
sqft
|
built
2021
1821 Wheeler St, Oklahoma City, OK 73108
$-1,415
Cash flow
-13.8%
Cash-on-Cash Return
2.5%
Cap rate
0.3%
Rent to Value Ratio
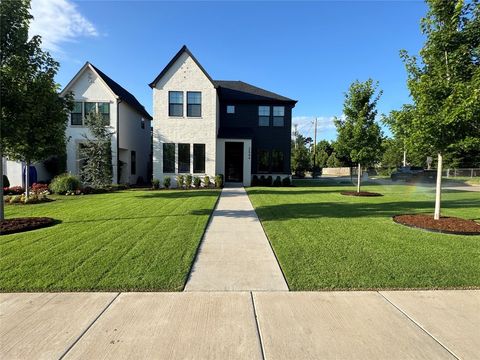
Active
$679,000
3
bds
|
4
ba
|
0
sqft
|
built
2023
2644 NW 57th St, Oklahoma City, OK 73112
$-1,495
Cash flow
-11.5%
Cash-on-Cash Return
3.0%
Cap rate
0.5%
Rent to Value Ratio
Active
$210,000
3
bds
|
1
ba
|
0
sqft
|
built
1935
2229 NW 30th St, Oklahoma City, OK 73112
$-55
Cash flow
-1.4%
Cash-on-Cash Return
5.4%
Cap rate
0.8%
Rent to Value Ratio
Active
$204,000
4
bds
|
2
ba
|
0
sqft
|
built
1951
1529 NE 44th St, Oklahoma City, OK 73111
$-300
Cash flow
-7.7%
Cash-on-Cash Return
3.9%
Cap rate
0.5%
Rent to Value Ratio
Active
$299,000
3
bds
|
2
ba
|
1,652
sqft
|
built
1928
1222 S Braden Ave, Tulsa, OK 74112
$-491
Cash flow
-8.6%
Cash-on-Cash Return
3.7%
Cap rate
0.5%
Rent to Value Ratio
Active
$240,000
3
bds
|
3
ba
|
1,597
sqft
|
built
1992
7412 W 38th St, Tulsa, OK 74107
$-136
Cash flow
-3.0%
Cash-on-Cash Return
5.0%
Cap rate
0.7%
Rent to Value Ratio
Active
$245,000
3
bds
|
2
ba
|
1,708
sqft
|
built
1962
4533 S Hudson Pl, Tulsa, OK 74135
$-206
Cash flow
-4.4%
Cash-on-Cash Return
4.7%
Cap rate
0.7%
Rent to Value Ratio
Active
$249,900
3
bds
|
2
ba
|
1,822
sqft
|
built
1979
3001 W Broadway St, Broken Arrow, OK 74012
$-116
Cash flow
-2.4%
Cash-on-Cash Return
5.1%
Cap rate
0.7%
Rent to Value Ratio
Active
$465,900
4
bds
|
4
ba
|
0
sqft
|
built
2022
2309 El Cajon St, Edmond, OK 73034
$-693
Cash flow
-7.8%
Cash-on-Cash Return
3.9%
Cap rate
0.6%
Rent to Value Ratio
Active
$190,000
3
bds
|
1
ba
|
0
sqft
|
built
2004
109 E Hayes St, Norman, OK 73069
$-139
Cash flow
-3.8%
Cash-on-Cash Return
4.8%
Cap rate
0.7%
Rent to Value Ratio
Active
$280,000
3
bds
|
3
ba
|
1,966
sqft
|
built
1991
6603 S 107th East Ave, Tulsa, OK 74133
$-314
Cash flow
-5.9%
Cash-on-Cash Return
4.3%
Cap rate
0.6%
Rent to Value Ratio
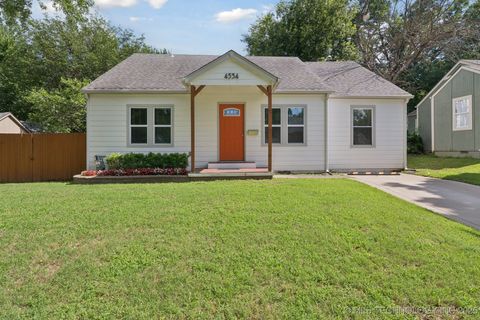
Active
$229,000
3
bds
|
2
ba
|
1,274
sqft
|
built
1939
4534 E 5th Pl, Tulsa, OK 74112
$-205
Cash flow
-4.7%
Cash-on-Cash Return
4.6%
Cap rate
0.6%
Rent to Value Ratio
Active
$110,000
2
bds
|
1
ba
|
0
sqft
|
built
1953
3109 NE 15th St, Oklahoma City, OK 73117
$273
Cash flow
12.9%
Cash-on-Cash Return
8.7%
Cap rate
1.1%
Rent to Value Ratio
Active
$355,000
3
bds
|
3
ba
|
0
sqft
|
built
2009
8509 NW 111th St, Oklahoma City, OK 73162
$-527
Cash flow
-7.7%
Cash-on-Cash Return
3.9%
Cap rate
0.6%
Rent to Value Ratio